
K.B. Yeo
Centre for Materials and Minerals, Universiti Malaysia Sabah, 88999 Kota Kinabalu, Sabah, Malaysia
E.H. Lim
Centre for Materials and Minerals, Universiti Malaysia Sabah, 88999 Kota Kinabalu, Sabah, Malaysia
Journal of Applied Sciences
Year: 2010 | Volume: 10 | Issue: 21 | Page No.: 2663-2667


ABSTRACT
Post fracture analysis is an important methodology to provide enormous important physical insights to the failure mechanisms of a material. The novelty of micrographic approach or technique for linear-elastic fracture characterization of a metallic solid in particular has adopted material forensic techniques for post fracture evaluation through microscopic measurement of crack initiation zone using the Infinite Focus Microscope (IFM) and the Scanning Electron Microscope (SEM). The IFM has been utilized to analyze the surface roughness profile of the critical fractured surfaces and identify the transition crack initiation zone to develop over a small region of crack increment of about 17 microns. Alternatively, the high magnification SEM could also measure the band width or the incremental crack length at initiation to about 10 microns, in addition to the capability to reveal the microstructures of the crack; namely river patterns and the feather marks, which appear as trademarks leftover due to cleavage linear-elastic fracture.
PDF Abstract XML References Citation
How to cite this article
K.B. Yeo and E.H. Lim, 2010. Micrographic Technique For Linear-Elastic Fracture Evaluation of Crack Initiation Zone. Journal of Applied Sciences, 10: 2663-2667.
DOI: 10.3923/jas.2010.2663.2667
URL: https://scialert.net/abstract/?doi=jas.2010.2663.2667
DOI: 10.3923/jas.2010.2663.2667
URL: https://scialert.net/abstract/?doi=jas.2010.2663.2667
INTRODUCTION
Fracture toughness parameter has been a critical concept in Fracture Mechanics analysis. The thickness-independent plane-strain fracture toughness in particular is commonly used to characterize the applicability of the Linear-Elastic Fracture Mechanics (LEFM) concepts (Beng et al., 2007). Considerably tough medium carbon steel would exhibits plane-strain fracture toughness value about 30 MPa m½ (Davis, 1998; Brandes and Brook, 1998). On top of the quantitative approach to characterize the linear-elastic fracture, the evidence to a metallic material exhibits linear-elastic fracture could also be alternatively verified by carrying out a qualitative post fracture analysis to reveal the important physical insights to the subsequent fracture mechanism.
Valued efforts from Inglis (1913), Griffith (1920) in their contributions to the Fracture Mechanics have conferred a solid theory in which fracture initiates from a high-stress-concentrated crack tip zone. For the LEFM-concepts to be applicable, the deformation of materials at the crack-tip zone must constrain to a typical small-scale yielding or trivial plasticity effect so that the crack initiation zone is relatively very small. In addition, a fracture process normally leaves telltale marks on the fractured surfaces. Cleavage failure for example portrays unique trademarks, namely the feather marks and river patterns (Anderson, 1995). Therefore, by measurement of the bandwidth of the crack initiation zone and the investigation of cleavage trademarks observed within the area of interest, fracture can be characterized and verified the state of linear-elastic mode of failure. This micrographic approach for fracture evaluation at the crack initiation zone can be very effectively carried out using the Infinite Focus Microscope (IFM) and the Scanning Electron Microscope (SEM).
MATERIALS AND SPECIMEN
The material of interest in this analysis is a medium carbon steel (contains of 0.33% C), possessing a hardness property up to 183 HB, yield strength equal to 360.4 MPa, ductility 22%, surface fraction of pearlite-ferrite structure 43% and plane-strain fracture toughness equal to 33 MP am. Compact tension geometry specimens have been fabricated from this material-type as shown in the Fig. 1.
 | |
| Fig. 1: | Compact tension specimen made of medium carbon steel |
This geometry is designed specifically for plane strain fracture evaluation based on the ASTM standard test method coded E-399 (1997).
The specimen is subjected to Mode-I tensile loading at under quasi-static test. All testing configuration are adopted according to standard guidelines described in the ASTM E-399 (1997). Upon testing, the induced fracture by crack initiation is performed and the data of loads and strains are collected for determination of plane-strain fracture toughness. At the same time, the fractured specimen is separated to two halves, to reveal the critical part of the fractured surfaces, as shown in the Fig. 2, for post fracture evaluation.
 | |
| Fig. 2: | Fractured surfaces of a compact tension specimen |
MICROSTRUCTURE ANALYSIS USING IFM
The Infinite Focus Microscope (IFM) is a recent technology for surface metrological work, where scanner is turned into three-dimensional (3D) measurement device, allowing direct 3D surface analysis at up to nano scale on two-dimensional (2D) images. This instrument is ideal for surface roughness measurement as geometries with steep flank can be measured with a vertical resolution down to 20 nm. The optical system with vertical scanning is capable of capturing 2D topographical and colour images from the variation of focus. These images are subsequently reconstructed using unique algorithms into a 3D model that allows the verification of measurement results.
Using the IFM, the surface roughness analysis is carried out by focus on the area of interest on the fractured surfaces. Region across the three distinctive fracture mechanisms, namely the pre-crack zone, crack initiation or onset zone and the post-crack zone has been investigated. Reconstruction of sample is carried out with the 5x objective. The geometry measurements and roughness of the surfaces are then performed with the profile analysis module. The general operating principle is illustrated in the Fig. 3.
 | |
| Fig. 3: | Surface roughness analysis using the Infinite Focus Microscope |
 | |
| Fig. 4: | Microstructure analysis using the Scanning Electron Microscope |
MICROSTRUCTURE ANALYSIS USING SEM
The Scanning Electron Microscope (SEM) is a high magnification microscope, using electrons to illuminate observed material surfaces and create enlarged images. This instrument allows more areas to be in focus at one time and greater control in degree of magnification, as well as the prominently clear images, making it very useful in microstructure analysis of fractured surfaces. In the vacuumed chamber, the electron gun emits a beam of high energy electrons traveling through a series of magnetic lenses to focus the electrons to a very fine focal spot sized one to five nanometers. A pair of scanning coil in the objective lens will deflect the beam both horizontally and vertically such that a raster scan could be conducted over a rectangular area of the sample surface. The collision of beam electrons on the sample causes electrons to be knocked loose from the surface. These emitted backscattered, secondary and transmitted electrons, as well as X-rays and cathodoluminescence will be detected and fed to a synchronous Cathode Ray Tube (CRT), to display extreme minute microscopic details or images on monitor screen. The principle of the electron probe and emission is demonstrated in the Fig. 4.
Using the SEM, the characteristic features of three distinctive fractured zones; fatigue pre-crack, crack initiation and gross fracture, are captured in enlarged high resolution images for micrographic investigation. The identification of unique microstructure pertaining to cleavage failure at the crack initiation zone (the transition between fatigue pre-crack and gross fracture zones) is of particular concern.
RESULTS AND DISCUSSION
The Infinite-Focus Microscope (IFM) and the Scanning Electron Microscope (SEM) have been used in performing the micrograph investigations on the fractured of compact tension specimen, in particular at the crack initiation zone. The micrographic approach to evaluate the linear-elastic fracture mechanism is carried out through the measurement of the bandwidth of the initiation zone and the identification of cleavage microstructure deformation within the area of interest.
Measurement of crack initiation zone: In the Fig. 3, the pseudo color model constructed by the IFM algorithms indicates the surface roughness profile of the region across the pre-crack zone, crack initiation zone and the post-crack zone. The 3D image is utilized to generate the 2D depth profile diagram, showing the variations of surface roughness along the critical fracture path, as shown in the Fig. 5.
Fracture deformation is consistently distributed at the pre-crack zone, but serrated and irregular at the post-crack area. The later may be associated with significant gross surface deformation due to coalescence of microvoids at varying sizes, whereas the surface profile of pre-crack is due to low-frequency fatigue load.
 | |
| Fig. 5: | Variations of surface roughness along critical fracture path |
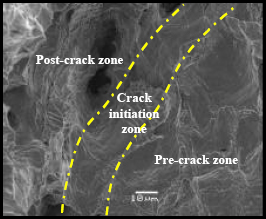 | |
| Fig. 6: | Bandwidth of crack initiation zone from the SEM micrograph |
Most importantly, the diagram shows that the transition crack initiation zone can be identified to develop over a small region of crack increment of about 17 micron. In parallel, micrograph is also captured using the SEM as shown in the Fig. 6; the transition crack initiation zone is also measured to about 10-15 micron.
These two observations provided the identification of the crack initiation zone size sufficiently small to achieve excellent correlation to the evaluation of linear-elastic fracture.
Cleavage microstructures: Further observations into the crack initiation zone using SEM have found two repetitive unique microstructure patterns, similar to river-lines and feather-marks, as shown in the Fig. 7 and 8.
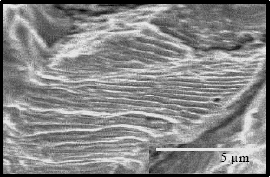 | |
| Fig. 7: | River-line microstructures at 5,000x magnification |
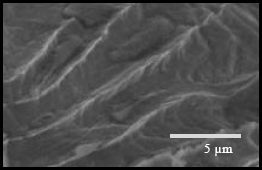 | |
| Fig. 8: | Feather-mark microstructures at 5,000x magnification |
These patterns are also unique features that are evidences of fracture occurred in cleavage, a type of brittle deformation, which indicate elastic fracture behavior.
CONCLUSIONS
The micrographic approach for linear-elastic fracture evaluation through crack initiation zone is considerably successful. Both IFM and SEM analyses have measured the size of crack initiation zone of the fractured compact tension specimen to about 10 to 17 microns, suggesting a very small-scale yielding at fracture. Addition to the verification of linear-elastic fracture is the revelation of river-lines and feather-marks, which provided further evidences to cleavage fracture at the crack initiation zone.
ACKNOWLEDGMENTS
The authors would like to acknowledge the Centre of Materials and Minerals-CMM ([email protected]), School of Engineering and Information Technology of the Universiti Malaysia Sabah-UMS ([email protected]) for the full support of this research project.
REFERENCES
- ASTM Standard E 399-90, 1997. Standard test method for plane strain fracture toughness of metallic materials. Annu. Book ASTM Standards, 3: 1-31.
Direct Link - Brandes, E.A. and G.B. Brook, 1998. Smithells Light Metals Handbook. Butterworth-Heinemann, United Kingdom, ISBN: 0750636254, pp: 88-97.
Direct Link - Davis, J.R., 1998. Metals Handbook Desk Edition. 1st Edn., CRC Press, London, ISBN: 0-87170-654-7, pp: 1535.
Direct Link - Beng, Y.K., M. Harimi and L.E. Har, 2007. Brittle fracture validation through crystallographic deformation for the characterization of cleavage in carbon steel. J. Applied Sci., 7: 2206-2210.
CrossRefDirect Link