
S.A. Hameed
Department of Electrical and Computer Engineering, Faculty of Engineering, International Islamic University Malaysia, 53100 Gombak, Kuala Lumpur, Malaysia
B.B. Zaidan
Department of Electrical and Computer Engineering, Faculty of Engineering, International Islamic University Malaysia, 53100 Gombak, Kuala Lumpur, Malaysia
A.A. Zaidan
Department of Electrical and Computer Engineering, Faculty of Engineering, International Islamic University Malaysia, 53100 Gombak, Kuala Lumpur, Malaysia
A.W. Naji
Department of Electrical and Computer Engineering, Faculty of Engineering, International Islamic University Malaysia, 53100 Gombak, Kuala Lumpur, Malaysia
O.F. Tawfiq
Department of Electrical and Computer Engineering, Faculty of Engineering, International Islamic University Malaysia, 53100 Gombak, Kuala Lumpur, Malaysia
Journal of Applied Sciences
Year: 2010 | Volume: 10 | Issue: 2 | Page No.: 145-150


ABSTRACT
The goal of this study is to investigate and evaluate how far three-dimensional skull biometric is reliable in term of the accurate measurements, capability and applicability. It was hard to evaluate or simulate an application use three-dimensional skull in biometric, however, can field imaging systems provide a new suitable environment to simulate a new three-dimensional skull biometric. The second goal of this study is to assess how good the new three-dimensional image system is. Subsequently, this study will evaluate the reliability and dependability of using skull biometric. The simulation based on the three-dimensional skull recognition using three-dimensional matching technique. The feature of the simulate system shows the capability of using three-dimensional matching system as an efficient way to identify the person through his or her skull by match it with database, this technique grantee fast processing with optimizing the false positive and negative as well.
PDF Abstract XML References Citation
How to cite this article
S.A. Hameed, B.B. Zaidan, A.A. Zaidan, A.W. Naji and O.F. Tawfiq, 2010. An Accurate Method to Obtain Bio-Metric Measurements for Three Dimensional Skull. Journal of Applied Sciences, 10: 145-150.
DOI: 10.3923/jas.2010.145.150
URL: https://scialert.net/abstract/?doi=jas.2010.145.150
DOI: 10.3923/jas.2010.145.150
URL: https://scialert.net/abstract/?doi=jas.2010.145.150
INTRODUCTION
Biometrics verification is any means by which a person can be uniquely identified by evaluating one or more unique biological traits. Unique identifiers include fingerprints, retina and iris patterns, voice waves, DNA, hand geometry, earlobe geometry and signatures, it has been widely used in the security applications such as Electronic access control, Inmate booking and release/parole ID, safe and vault security, elimination of welfare fraud, information security, ATM. Fingerprint, Iris-pattern and retina-pattern authentication methods are already engaged in some bank automatic teller machines (See et al., 2007). Voice waveform recognition, a method of verification that has been used for many years with tape recordings in telephone wiretaps, is now being used for access to proprietary databanks in research facilities. Hand geometry is being used in industry to provide physical access to buildings. Facial-recognition technology has been used by law enforcement to pick out individuals in large crowds with considerable reliability (Abdul-Talib et al., 2009).
Currently, biometric technology is most identified with border control and transport agencies with both fingerprints and iris scanning being deployed in airports such as Schipol in the Netherlands (Abdul-Talib et al., 2009).
However, it is also starting to gain prominence in commercial sectors such as financial services, a move being further driven by regulatory compliance across Europe. In the last two years, numerous financial organizations have deployed non-Automated Fingerprint Identification System (AFIS) fingerprint recognition and voice verification to meet FFIEC (Federal Financial Institutions Examination Council) guidelines. Recent analysis from Frost and Sullivan of the world financial biometrics market found that it earned revenues of $117.3 million in 2006, with estimates to reach $2.07 billion in 2013. Biometric systems are now becoming widely used by many organizations to provide greatest level of security because it more reliable than then password and it represent the user. Many biometric research publications are already done especially related to pattern recognition and digital signal processing issues.
In the literature, three-dimensional analysis of facial biometric has been involved, such as (Abdul-Talib et al., 2009) perform three-dimensional face recognition using a sparse depth map constructed from stereo images. Iso-luminance contours are used for the stereo matching. Both two dimensional edges and is also luminance contours are used in finding the irises. In this specific limited sense, this approach is multi-modal. However, there is no separate recognition result from two-dimensional face recognition (Lao et al., 2000).
Lao et al. (2000), using the iris locations, other feature points are found so that poses standardization can be done. Recognition rates of 87 to 96% are reported using a data set of ten persons, with four images taken at each of nine poses for each person. Extend eigenface and hidden Markov model approaches used for two-dimensional face recognition to work with range images. They present results for a dataset of 24 persons, with 10 images per person and report 100% recognition using an adaptation of the two-dimensional face recognition algorithms (Messer et al., 1999).
Multi-modal faces recognition using three-dimensional and color images has been reported by Messer et al. (1999). The use of color rather than simply gray-scale intensity appears to be unique among the multi-modal work surveyed here. Results of experiments using images of 40 persons from the XM2VTS dataset (Achermann et al., 1997) are reported for color images alone, three-dimensional alone and three-dimensional color. The recognition algorithm is PCA style matching, plus a combination of the PCA results for the individual color planes and range image. Recognition rates as high as 99% are achieved for the multi-modal algorithm and multi-modal performance is found to be higher than for either three-dimensional or two-dimensional alone (Yongsheng, 2002).
See et al. (2007) presents a new method of measurement using 3D color speckle stereophotogrammetry and its application in the assessment of NLFV. The VECTRA-3D system was validated to determine its minimum resolution and accuracy.
MATERIALS AND METHODS
Can field imaging system accuracy: In the literature, Can field Imaging System Accuracy has been tested as it has been shown in (Fukuta et al., 2008) they did a case experiment for sixteen spheres were formed from the deformable material and the weight of these spheres ranged from 0.0137 to 26.804 g. Through calculation from the above equation, a volume reference scale is generated, ranging from 0.0076 to 14.8913 mL. Volumes measured using VAM® software ranged between 0.0025 and 14.0167 mL. Excellent correlation was observed between the true volumes and volumes measured by both observers. For observer 1, the correlation coefficient, r = 0.9997 (confidence interval 0.9990 to 0.9999, p-value <0.0001). For observer 2, the correlation coefficient, r = 0.9992 (confidence interval 0.9975 to 0.9997, p<0.0001). The intra-rater variability, as measured by the coefficient of variation is 0.6748%. The inter-rater agreement kappa (k) value between both observers was 0.906, which indicates a very good strength of agreement (Lin et al., 2008). The relationship between the true volumes and volumes measured by both observers (See et al., 2007) shown in (Fig. 1).
 | |
| Fig. 1: | The Relationship between the true volumes and volumes measured by both observers (See et al., 2007) |
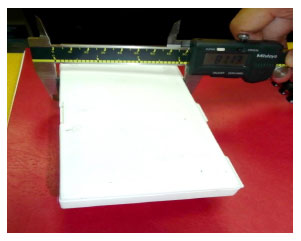 | |
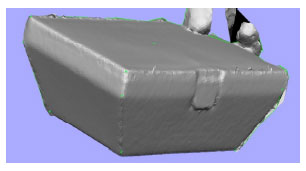
| Fig. 2: | Big geometric box measurement (the real measurement) |
Reliability check-big geometric: Plastic box with constant dimensions was measured directly by calipers (real measurements) and a 3D model was captured and measured for the same box by Vectra 3D device computer measurements.
The real measurements: In this experiment we will try to compare between the real measurement and the computer measurement as shown in Fig. 2 and 3.
Table 1 includes the real measurement for the box, like the height width, etc.
Computer 3D measurements: Figure 4-6 is the images taken from the software, Table 1 shows the computer measurement.
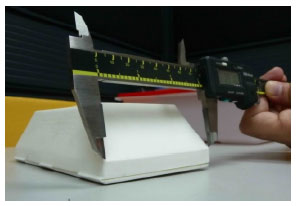 | |
| Fig. 3: | Measuring the box |
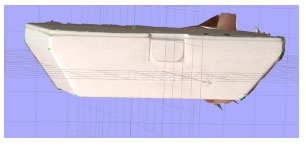 | |
| Fig. 4: | The box measurement in the computer |
 | |
| Fig. 5: | Other image toke from the software |
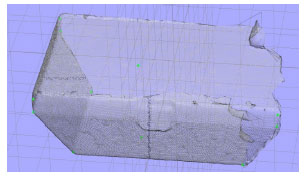 | |
| Fig. 6: | Other angle for the box in the software |
Results for big (geometric): Measurements showed max 0.32 mm difference between the real and computer measurements, which means no significant differences between the real measurement and the computer measurement (Table 2).
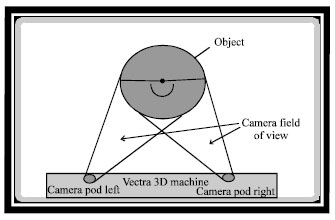 | |
| Fig. 7: | Shows how the camera takes the pictures |
| Table 1: | The real measurement of the big geometry |
 | |
| Table 2: | Computer measurement to the big geometry and the Abs differences |
 | |
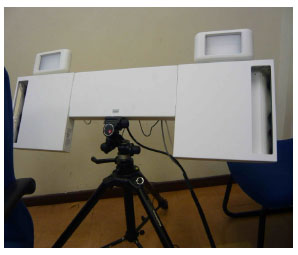
Vectra 3D device: Consist of 8 cameras fixed on left and right ends of the device. The cameras field of view is limited as is the camera captures instant images (Fig. 7).
System setup: Can field imaging system includes two parts, hardware and software, below the descriptions of the system.
Hardware: The device engaged in this study is the VECTRA-3D dual module system for full face imaging (Can field Scientific, Fairfield, NJ, USA).
The VECTRA-3D features two pods held together by a central bracket that mounts onto a tripod or stand (Fig. 8). Each camera pod contains three high-resolution digital cameras and a speckle texture flash projector. The camera positions, orientations and imaging characteristics, such as the lens distortions, are predetermined by the calibration system.
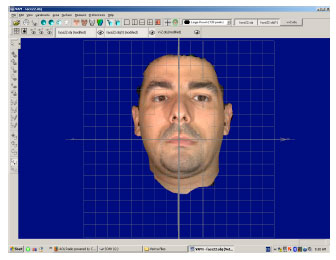
Software: The 3D model that is generated can be analyzed using VAM® (visualization, analysis, measurement) application software. As it is a digital facial model, one is able to rotate, pan, or zoom into the images as well as view multiple surfaces simultaneously to facilitate analysis, (Fig. 9).
 | |
| Fig. 8: | The VECTRA-3D camera |
 | |
| Fig. 9: | VAM software |
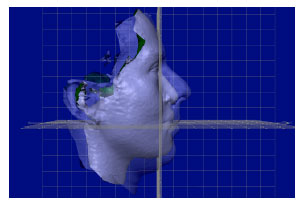
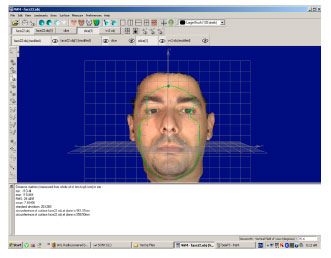
Facial image experiment: Several applications might be applied using VAM system upon. The first experiment in this study was for three dimensional faces. In this experiment we has tried to show the flexibility of the new system, also the reliability of the measurement. The Fig. 10-12a and b show many possible for the image view and also experimentally two faces matched and other were not.
Figure 10 and 11 show two faced matched, where in Fig. 6 the same face need to be rotate. To be more clear, two pictures from different angles has been taking automatically.
The final step both of the faces has been establish matching in (Fig. 13).
The other possible application might also apply the new approach in the crime and forensic application; in fact, Can field Imaging System with the new features gives the green light to the researchers to apply those algorithms in a very fixable environment.
 | |
| Fig. 10: | Unmatched faces |
 | |
| Fig. 11: | Unmatched area bounded by a white color |
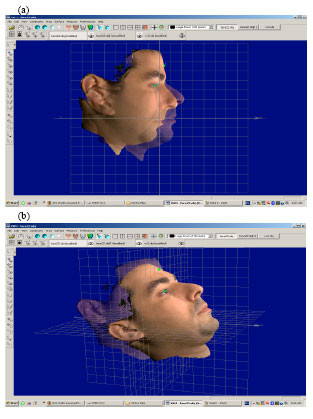 | |
| Fig. 12: | (a, b) Two faces from the same person has been started to match |
 | |
| Fig. 13: | Two faces matched |
RESULTS AND DISCUSSION
Three dimensional skull: This system has choice three-dimensional detection system for the skull and the reason of choosing this correlation between skull recognition and three-dimensional matching technique is that in this algorithm is to make less process by use the number of sold matching pixel. Three-dimensional technology has improved in the last decade and may become increasingly mainstream in the future. Recently, authors have used three-dimensional reconstruction of the face biometric.
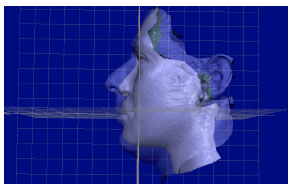
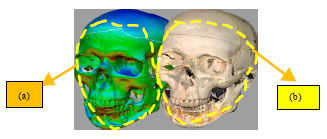
In this research the three-dimensional technology to improve a new biometric using skull object was used (Fig. 14) is snapshot from the simulation shows two skull matching for the same person.
Using the software, we were able to superimpose each upright image onto the corresponding supine image and measure the distance between the two surfaces. This represents the movement that occurs in the soft tissues from upright to supine. Figure 8 shows the changes that occur to the soft tissues of the face from upright to supine by color (See et al., 2007).
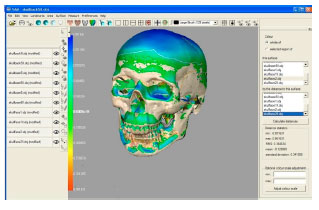
In the Fig. 15 and 16, there different skull some of them match and other were not, it shows clearly how accurate and reliable using three-dimensional skull recognition in the biometric. Moreover, the snapshots below recommended using the new can field imaging system for the three dimensional applications.
In Fig. 15a, b skull a in the red color and skull b in brown color, the experiment shows skull a and skull b are match. In Fig. 16a different skull a can not match with skull b, as a summery this system might be use to measure any 3D application with a very low rate of error.
 | |
| Fig. 14: | Snapshots from the simulation |
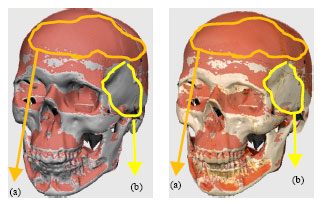 | |
| Fig. 15: | Match skull |
 | |
| Fig. 16: | Different skulls unmatched |
Different skull used experimentally to test the reliability of the using the skull in the 3-D bio-metric, the conduct test measurement shows skull bio-metric is qualified and capable to be used in the bio metric, forensic, computer forensics, etc. as it shown above the red image is actually a matching.
CONCLUSION
Reliability in personal authentication is the key to the stringent security requirements in many application domains ranging from airport surveillance to electronic banking. In this study, we used the new Can field Imaging Systems for processing the 3D images, there are two goals approved in this study, the reliability of 3D skull biometric and evaluate the dependability of the simulator, different test on the 3D skull and 3D face has been used to insure both of the projects goals give the appreciated result. The new system has given a very good result in term of accuracy, time cost and optimizing the false positive and false negative. These entire features have been improved by using a very simple technique, three-dimensional matching with skull. Data captured used a very high image quality, in fact, more than 8 MB, .obi images. In additional, this study highlights several biometric approaches to determine a wide review about the current bio-metric applications.
ACKNOWLEDGMENTS
This project has been funded in part from International Islamic University of Malaya. The Author would like to thank the entire workers on this project and the people who help in any way. This study was supported in part by University of Malaya/ Kuala Lumpur, Malaysia. All the 3-D skull measurements and 3-D images has been taken and processed at the Faculty of Dentistry Lab., University of Malaya, using Can field Vectra three-dimensional system/Can field Imaging Systems for 3-D image processing.
REFERENCES
- Achermann, B., X. Jiang and H. Bunke, 1997. Face recognition using range images. Proceedings of the International Conference on Virtual Systems and MultiMedia, Sept. 10-12, Geneva, Switzerland, pp: 129-136.
Direct Link - Fukuta, K., T. Nakagawa, Y. Hayashi, Y. Hatanaka, T. Hara and H. Fujita, 2008. Personal identification based on blood vessels of retinal fundus images. Proc. SPIE. Med. Imaging, 6914: 69141-69141.
Direct Link - Messer, K., J. Matas, J. Kittler, J. Luettin and G. Maitre, 1999. XM2VTSDB, The extended M2VTS database. Proceedings of the 2nd International Conference on Audio-and Video-based Biometric Person Authentication, March 1999, Washington DC., pp: 72-77.
Direct Link - See, M.S., M.R. Foxton, N.A.M. Sinclair, C.E. Roberts and C. Nduka, 2007. Stereophotogrammetric measurement of the nasolabial fold in repose a study of age and posture-related changes. Eur. J. Plast Surg., 29: 387-393.
CrossRef - Lin, S.J., N. Patel, K.O. Shaughnessy and N. Fine, 2008. A new three-dimensional imaging device in facial aesthetic and reconstructive surgery. Otolaryngol. Head Neck Surg., 139: 313-315.
CrossRef - Lao, S., Y. Sumi, M. Kawade, Y. Sumi and F. Tomita, 2000. 3D template matching for pose invariant face recognition using 3D facial model built with iso-luminance line based stereo vision. Proc. Int. Conf. Pattern Recognition, 2: 2911-2916.
Direct Link - Yongsheng, G., 2002. Leung, face recognition using line edge map. IEEE Trans. Pattern Anal. Mach. Intell., 24: 764-779.
CrossRefDirect Link