
Padet Praditphet
National Centre of Excellence for Environmental and Hazardous Waste Management, Chulalongkorn University, Bangkok, 10140, Thailand
Journal of Applied Sciences
Year: 2009 | Volume: 9 | Issue: 18 | Page No.: 3236-3249


ABSTRACT
This study proposes air pollution prevention applications for urban area transportation aimed at minimizing pollution and meeting ambient air quality standards through the use of transport and vehicle emissions models that account for air pollution changes resulting from prevention strategies. This study combines pollution prevention techniques and transport and vehicle emissions models to enhance air pollution prevention in an urban area. The amount of air emissions from transportation continues to rise as travel patterns expand, necessitating reduced pollution emissions from the transportation sector. This study aims to probe the major causes for the increase in air pollutants in the transportation sector of Bangkok and proposes a feasible method capable of reducing and controlling its associated air pollution. Furthermore, the results suggest that the most effective countermeasures to transportation-based air emissions include four potential solutions that promote the use of Natural Gas Vehicle (NGV) buses and the institution of rerouting existing services. The current study can be used to formulate policies related to air pollution on a macro scale.
PDF Abstract XML References Citation
How to cite this article
Padet Praditphet, 2009. Air Pollution Prevention Applications for the Transport Sector by Integrating Urban Area Transport and Vehicle Emission Models with the Case Study of Bangkok, Thailand. Journal of Applied Sciences, 9: 3236-3249.
DOI: 10.3923/jas.2009.3236.3249
URL: https://scialert.net/abstract/?doi=jas.2009.3236.3249
DOI: 10.3923/jas.2009.3236.3249
URL: https://scialert.net/abstract/?doi=jas.2009.3236.3249
INTRODUCTION
Air pollution is generated in large amounts in urban areas by the transportation sector. Mayer et al. (1999). Since, a large portion of the population of many countries is located in urbanized areas, these areas greatly affect the total amount of pollution generated worldwide (Shah and Nagpal, 1997). Bangkok is one such urban area experiencing serious air pollution; the situation worsens especially during rush hours, resulting in lower ambient air quality in the city (Asian Development Bank, 2003). Beside, air pollution has significant effects on human health and the quality of life (Holgate et al., 1999).
The Pollution Control Department, Thailand, determined the emission sources of several particular pollutants, referred to as an emission inventory. Three major sources (including gasoline and diesel emissions) are point sources (industries), mobile sources (traffic) and area sources (residential) of Bangkok in 2001. It was found that emission level were 329,161 tons per year of nitrogen oxides (NOX), 463,775 tons per year of carbon monoxide (CO) and 38,192 tons per year of particulate matter (PM10). Ratio of pollutant emission depends on the emission sources. Mobile sources (traffic) are one of the major generators of NOX 80% and another left are from point sources and area sources, 75% of CO is from mobile sources and other 35% are from point and area sources and 54% of PM10 is from mobile source, 36% is from area and 10% is from point source.
United States Environmental Protection Agency (EPA) explained that pollution prevention is one of the strategic methods, which has been applied to solve the air pollution. Office of Transport and Traffic Policy and Planning, Thailand, suggested using the transport model to determine the transportation demands and Global Sustainable Systems Research (2004) suggested using the vehicle emissions model to evaluate the emission pollution modelling. However, many recent techniques and models of transport and vehicle emissions designed for United States and Europe are considered clearly inappropriate for application to Asian cities (Okamato et al., 1990). In addition, lack of suitable techniques to clarify the sources of problems especially air emissions from transportation sector is another problem (Jones et al., 2000).
Consequently, this study combines and modifies pollution prevention techniques and transport and vehicle emissions models to enhance air pollution prevention in an urban area (Banister, 1998). The amount of air emissions from transportation continues to rise as travel patterns expand and then it necessitates reduction of pollution emissions from the transportation sector in order to probe the major causes of air pollution generated by the transportation sector in Bangkok and also proposes strategies designed to reduce and control the levels of air emissions (Hesketh, 1991). Source reduction is explored as an effective means of pollution prevention for air emissions (Glasson et al., 1994). The results of this study reveal the most effective means for minimizing the air emissions of the transportation sector.
MATERIALS AND METHODS
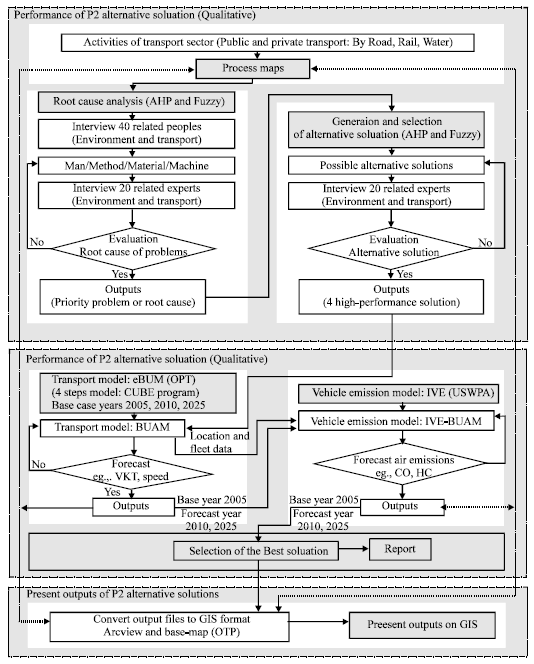
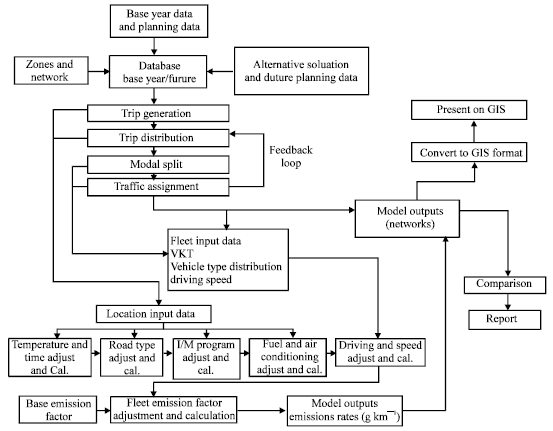
This study consists of two parts: qualitative and quantitative analysis of pollution prevention techniques. The qualitative part includes a root cause analysis and the formulation and selection of alternative solutions, whereas the quantitative part integrates transport and vehicle emissions methodologies with GIS data presentation techniques, as shown in Fig. 1. The area studied in this report consists of 1,568 km2 of the Bangkok, Thailand metropolis and the research methodology is divided into two main phases. The First main phase is conducted during February to November in year 2007 and the second phase is conducted during December in year 2007 to February in year 2009. The base year in phase two is chosen as 2005 and the forecast year as year 2010 and 2025.
Phase 1: Developing air pollution prevention techniques for the transportation sector: Air pollution prevention techniques for the transportation sector that is used here, are undertaken by applying existing techniques employed by the U.S. EPA.
 | |
| Fig. 1: | Framework of methodology |
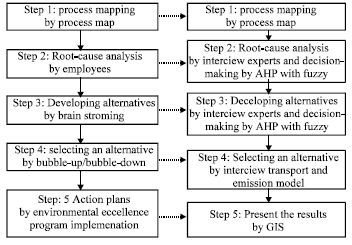 | |
| Fig. 2: | Principle and applied pollution prevention technique |
Application of these techniques to the transport sector is illustrated in Fig. 2 and explained in detail below. Phase 1 involves the implementation of four main steps:
Step 1: Process mapping: This includes mapping steps used by persons to travel from an origin to a destination, permitting identification of the activities that cause air pollution. In the present study, the activities that lead to air pollution are highlighted within the transport sector of the Bangkok urban area using a process map.
Step 2: Root-cause analysis: This step focuses on the direct sources of the transportation pollution problem. A cause and effect diagram is used to highlight why and where air pollution is created, helping identify specific areas for improvement and possible contributing factors, including man, transportation methods, the machines and materials. The root-cause analysis is undertaken as follows:
| • | To identify the causes of pollution: A focus group of forty individuals are invited whose works are related to the environmental and transportation sectors in Thailand, including the Ministry of Natural Resources and Environment, Ministry of Transport, Police Department, Universities and other related organizations |
| • | Interviews: These are conducted for twenty experts in the area of environmental and transportation sectors using a multi-criteria analysis (Analytic Hierarchy Process (AHP) and Fuzzy software programmes). These twenty experts are interviewed two times; first to identify the problems of the highest priority; and then to generate alternative solutions and rank four potential solutions |
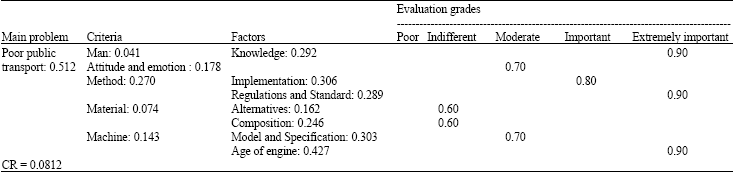
In step 2, a multi-criteria analysis is performed using the AHP and the Fuzzy software. AHP is widely used for complex and intangible decision-making problems in various fields. In order to obtain the optimal overall decisions in traditional AHP, structuring and weighting synthesis procedures are required. In the present study, a hierarchy structure is established with four criteria and eight factors to select the best solutions.
Owing to the subjectivities inherent to the experts’ judgments, fuzzy set and entropy graded approaches are the most appropriate methods for prioritizing the proposed solutions. The hierarchy structure is described in Fig. 3.
Step 3: Developing alternatives: This step employs brain-storming to generate as many pollution counter measures as possible. A multi-criteria analysis using the AHP and fuzzy models is then performed as in Fig. 4. Thus, alternative solutions are obtained as the output.
Step 4: Alternative selection: An alternative is selected herein by considering all of the solutions and their prioritiesizing the alternatives. Factors such as cost, ease of implementation and effectiveness are considered in evaluating and prioritizing the alternative solutions.
In the present study, a three-level hierarchy of the priority problem and an evaluation of the alternative solutions using a combination of multiple-criteria analysis with AHP and fuzzy models are performed by executing the following four steps (Yang and Chen, 2004):
| • | Determination of the evaluation criteria and the factor sets: |
| (1) |
Where:
| (2) |
| (3) |
| (4) |
| (5) |
where, U is objective function of the study, C1, C2, C3,...,Cn is criteria and D1, D2, D3,…,Dn is factors.
Figure 4 and 5 indicate the three-level hierarchical framework of the proposed priority problem and the resulting solutions.
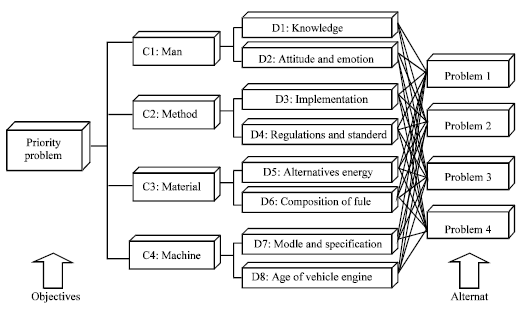 | |
| Fig. 3: | Hierarchy structure of selection the priority problem |
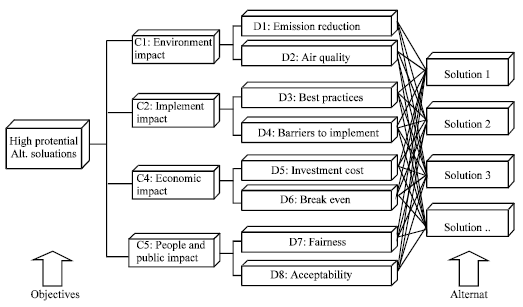 | |
| Fig. 4: | Hierarchy structure of selection the alternative solutions |
The first level includes the priority problem and the evaluation of the various solutions (U). The second level includes the evaluation criteria and the third level, the factor sets.
| • | Determination of the fuzzy set of the evaluation: |
| (6) |
where, V = Set of evaluations, v1 = Very important, v2 = Important, v3 = Moderate, v4 = Indifferent, v5 = Poor.
| • | Determination of the weight vector using the AHP: |
| (7) |
| (8) |
where, A is weight vector and a1,a2,..., am is criteria
| • | Computation of the results and evaluation |
This step ensures that all factors are considered, which will minimize the amount of information lost:
| (9) |
where, B is evaluation result, A is Fuzzy subset of U (weight vector of U), R is Fuzzy relation on U × V, e1 is the degree to which the evaluation results are very important, e2 is the degree to which the evaluation results are important, e3 is the degree to which the evaluation results are moderate, e4 is the degree to which the evaluation results are indifferent and e5 is the degree to which the evaluation results are poor.
 | |
| Fig. 5: | Integrated transport model (BUAM) and emission model (IVE-BUAM) |
Consequently, AHP is based on three steps: (1) the decomposition of the decision problem and the construction of hierarchies, (2) a comparison of the decision elements and (3) a synthesis of the priorities. AHP is used to handle both tangible and intangible criteria and the factors that affect the decision-making process. At the same time, the relative importance (weights) of all decision elements (i.e., weight vector A) can be shown through pair-wise comparisons, on appropriate scales, before the fuzzy set is used to determine the grades of the evaluations.
As discussed above, priority problems and their corresponding solutions are essentially decision-making processes that involve value judgments by experts (Lorie, 1980).
Phase 2: Integration of transport and vehicle emissions models: The four best solutions obtained from Phase 1 are evaluated by integrating transport and vehicle emissions models, as follows:
Step 1: Modification of the transport model (Extended Bangkok Urban Model: EBUM) provided by the Office of Transport and Traffic Policy and Planning (OTP) by applying the CUBE Voyager programme to the Bangkok Urban Area Model (BUAM) for the base year 2005 and the forecast years 2010 and 2025 (before improvement) has provided development of these tools since 2004 in an effort to provide the same tools and database for all related agencies. In addition, this study utilizes the transport master plan and transport database of the OTP, Ministry of Transport.
The transport model consists of four stages or sub-models:
| • | The trip generation model defines the relationship between trip generation and other variables of travel in each traffic zone. The relationship between the explanatory variables, such as the social and economic characteristics of the population and employment, is characterized using a series of linear regression equations (Extended Bangkok Urban Model: EBUM): |
| (10) |
where, Trip is number of trips in each zone, Pop is population of each zone, Inc is average income in each
zone, Emp is employment in each zone and α, β, γ, θ is coefficients of independent variables (e.g., elasticity of changes in the population, income and employment).
| • | The trip distribution model is used to calculate trips from one zone to another. The results from this type of analysis shows the trip distribution within the study area, which can be used to forecast future trip distributions using a series of linear regression equations as follows (Extended Bangkok Urban Model: EBUM): |
| (11) |
where, Tij is total trips from zone i to zone j, Pi is trip productions in zone i, Aj is trip attractions in zone j, Ai bj is coefficients, F(Cij) is function of the travel costs from zone i to zone j Kij is adjustment factor for trips from zone i to zone j (e.g., socio-economic adjustment factor).
| • | The modal split model is used to determine the proportion of trips utilizing private or public modes of transportation. The results from this analysis can be used to forecast future travel via the various modes, enabling planners to establish suitable traffic and transport plans using a binomial (two alternatives) logic model (Extended Bangkok Urban Model: EBUM): |
| (12) |
where, Pijk is proportion of travel by k between zone i to zone j, Cij is difference in travel cost between private and public modes of transportation, α is legit curve, δ = bias valuation of public transportation.
| • | The traffic assignment model determines the routes and services used for trips based on a relationship between the speed and volume of traffic and the road capacity and is represented in terms of the generalized cost of travel by the following linear regression equation (Extended Bangkok Urban Model: EBUM): |
| (13) |
where, GC is generalized cost of total travel, Time is total travel time, Distance is total distance travelled, Toll is expense toll and a, b, c is coefficients for changing the other value to the value of time or the value of cost.
The output of the transport model is presented in terms of Vehicle-Kilometres Travelled (VKT), Vehicle-Hours Travelled (VHT) and the speeds of the vehicles (km h-1).
Step 2: This step includes modifying the vehicle emissions model using the International Vehicle Emissions (IVE) model from the U.S. EPA to the International Vehicle Emissions for the Bangkok Urban Area Model (IVE-BUAM) and accounting for driving cycles in Bangkok for each type of motor vehicle, as reported by the OTP and Pollution Control Department (PCD).
Global Sustainable Systems Research (2004) has been developing the basic base emission rate predicted by IVE characterizes emissions with a series of correction factors to estimate the amount of pollution from a variety of vehicle types, as shown below in Eq. 14 and divides the estimates of base emission rates for running emissions in Eq. 15 and for start emissions in Eq. 16, as follows (Global Sustainable Systems Research, 2004);
| (14) |
| (15) |
| (16) |
where, B[t] is base emission rate for each technology (start (g) or running (g km-1)), Q[t] is adjusted emission rate for each technology (start (g) or running (g)), Q is average emission rate for the entire fleet (start (g) or running (g)), f[t] is fraction of travel by a specific technology, f[dt] is fraction of each type of driving or soak by a specific technology, f FTP is average velocity of the driving cycle (a constant (g km-1)), D is distance travelled as input by a user in the location file (km), fC is average velocity from the specific driving cycle as input by users in the location file (km h-1), K(Base)[t] is adjustment to the base emission rate, K(Tmp)[t] is temperature correction factor, K(Hmd)[t] is humidity correction factor, K(IM)[t] is inspection/ maintenance correction factor, K(Fuel)[t] is fuel quality correction factor, K(Alt)[t] is altitude correction factor, K(Cntry)[t] is country correction factor, K[dt] is driving or soak style correction factor (also accounts for other load effects due to air conditioning usage and the road grade).
The results from IVE provide an estimate of a fleet’s running emissions for the allocated travel distance or travel time in grams per hour (g h-1) or in grams per kilometer (g km-1), respectively (Global Sustainable Systems Research, 2004).
Step 3: The integrated transport model (BUAM) and vehicle emission model (IVE-BUAM) are used to analyze four potential solutions by comparing them with the base case (before and after improvement) in 2005 and the forecast years of 2010 and 2025 for the morning peak and for daily modes. The BUAM and IVE-BUAM models are shown in Fig. 5.
Phase 3: Results presented by GIS: In this phase, the best solution is selected in order to minimize the air emissions and ensure that the air emission levels meet ambient air standards; the overall outputs of the air pollution prevention strategies are converted into the GIS format.
RESULTS AND DISCUSSION
The results are divided into four sections, namely, the development of air pollution prevention techniques according to the U.S. EPA; listing all activities of the transportation sector in Bangkok using process maps to elucidate how air emissions are created and finding the root cause of problems and possible prevention strategies; evaluation of four potential solutions using the integrated transport and vehicle emissions models and
selecting the best solution in order to minimize air emissions and ensure that air emission pollutants meet ambient air standards. The overall outputs of the air pollution prevention strategies can be classified as follows:
| • | Applied process characterization with hierarchical process mapping: For pollution prevention, the whole system of travel is taken into consideration by process mapping an origin and destination. This map reveals the inputs and outputs for each trip in the transportation sector, as shown in Fig. 6-8. These figures highlight the roads or pathways that have several benefits. Roads or pathways, like other production processes and sectors, generate primary products and a variety of unintended by-products, such as air emissions, noise and waste, effects that are largely unpleasant and undesirable. These represent side effects of the road or pathway, which are more generally referred to as environmental effects or environmental impacts. This study evaluates the potential environmental impacts of any proposed trip using a road or pathway in the transportation sector by focusing on three main air pollutants: CO, NO2 and PM |
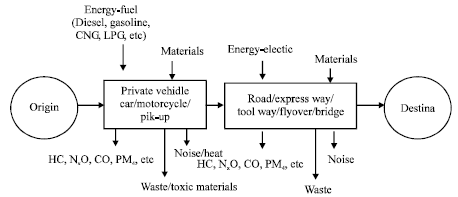 | |
| Fig. 6: | Process map of travel by private vehicle |
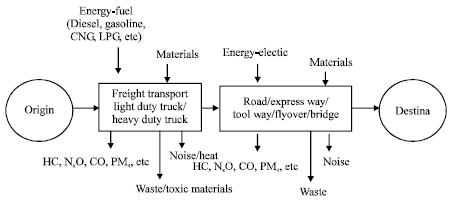 | |
| Fig. 7: | Process map of freight transport |
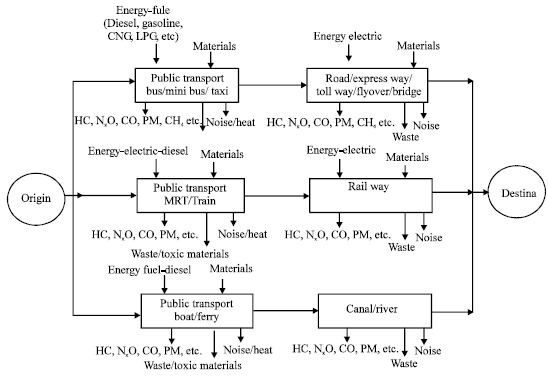 | |
| Fig. 8: | Process map of public transport |
| • | Root-cause analysis: In this step, the major effect of the study is derived and the sub-causes of the effect are identified. Interviews are conducted for the focus group, target people and experts involved in the areas of air quality and transportation. The following outputs are generated: |
| • | Initially, interviews are conducted for forty participants from the Ministry of Natural Resources and Environment, Ministry of Transport, Police Department, various Universities and other related organizations. An open questionnaire is used and the responses are classified. The questions are based on four categories: man, machine, method and material, following the P2 technique. The responses from the forty participants are then used to frame the questionnaire for the experts |
The results of the questions for the four classifications are as follows:
Man: Due to government subsidies and fixed fare-based policies, drivers are discouraged from paying attention to maintaining their vehicles and there is insufficient training for public transportation drivers, leading to poor attitudes and careless driving. Most of the public buses that are shared and owned by private individuals are quite old. They are major producers of air emission on streets. Similarly, due to the lack of convenience and reliability of public bus services, passengers are discouraged from using public transportation and private transportation instead. These factors contribute to the increased level of air emissions.
Method: Poor air quality monitoring, especially for air emissions, is a result of the lack of advanced technology for effective measurement; also in addition, some follow-up programmes are poor. Moreover, the current emissions’ standards and fuel specifications have encouraged lax implementation, monitoring and inspection technologies, including a lack of integrated transport and land use planning, which also contribute to air emissions.
Machine: A significant amount of the air emissions from motor vehicle engines may be caused by poor maintenance and old engines, resulting in increased fuel consumption.
Material: The poor quality of fuel increases the levels of air emissions, as such fuel contains high pollutant content and the fuel standards are insufficient. Moreover, fuel-pricing mechanisms are lacking, which could potentially discourage fuel consumption.
| • | Based on the results obtained from the initial survey of forty participants, the results obtained are used to construct a questionnaire for twenty environmental and transportation experts. The experts are also asked to grade the questions based on their expertise in the areas of man, methods, machines and materials |
The answers from the questionnaires are computed by the AHP and fuzzy software programmes. The results of these models are depicted in Table 1 and 2. Based on the responses, Poor Public Transportation ranked as the highest cause (0.512) of increased vehicular emissions.
It can be noted that from the interviews of the twenty experts Poor Public Transport is identified as an important cause of air emissions from the transportation sector in Bangkok. This result is represented in a cause-and-effect diagram as in Fig. 9.
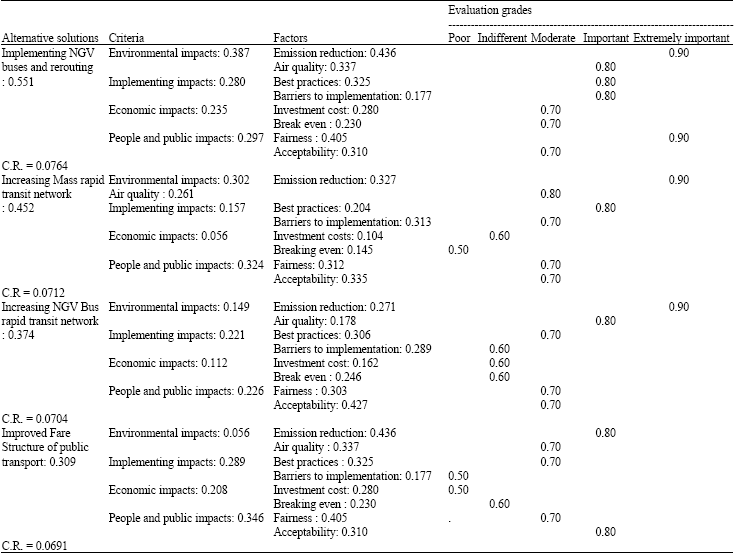
Formulation and selection of alternative solutions: As discussed above, Poor Public Transportation is identified as an important cause of high levels of emissions. In order to identify alternative solutions, the same group of twenty experts is asked for viable solutions. The experts graded and weighed their answers for various categories: implementation impacts, environmental impacts, economic impacts and people and public impacts.
| Table 1: | Results from twenty experts for all perceived causes of air pollution in the transportation sector |
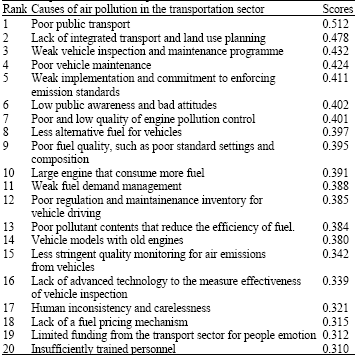 | |
| Table 2: | Results of the priority problem or main root-cause of air emissions from the transportation sector |
 | |
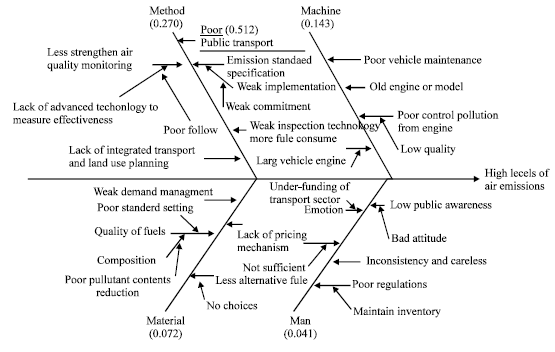 | |
| Fig. 9: | Cause-and-effect diagram of priority problem (poor public transport) of air emissions from transportation sector |
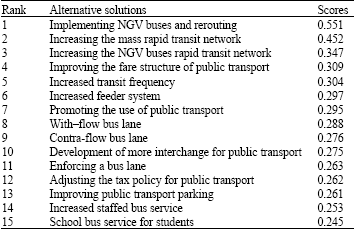
The results of their responses are shown in Table 3. The majority of the respondents perceived that promoting or implementing NGV buses and rerouting the existing services would yield the best results (ranked at 0.551). The second rank is increasing the mass rapid transit network (ranked at 0.452) while promoting an NGV-powered bus rapid transit network and improving the fare structure of public transport are in the third and fourth rank (0.374 and 0.309).
| Table 3: | Results from the twenty experts for all alternative solutions for poor public transportation |
 | |
These proposed options by the experts are tested using an integrated model, as discussed below and shown in Table 4.
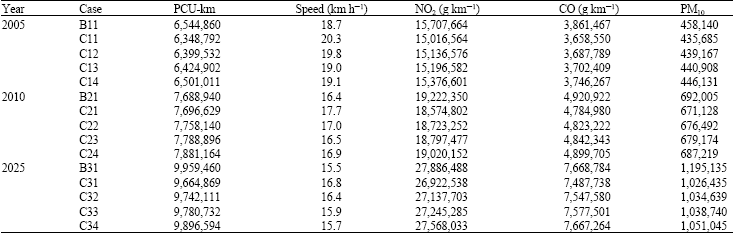
Selecting alternative solutions: Analysis of the four potential solutions is shown in Table 5. The model outputs shown in Table 6 and 7 indicate:
| • | Passenger Car Unit per kilometer (PCU-km) for the four potential solutions |
| • | Average speed (km h-1) for the four potential solutions and three main air pollutants (NO2, CO and PM10) emitted from vehicles for the four potential solutions |
In the case in which NGV buses are implemented and rerouting is performed, it can be observed from the table that for 2005, 2010 and 2025 (case C11, C21, C31, C211, C221 and C331) the solution obtained for the Passenger Car Unit (PCU) is lower than other solutions and the speed of this solution is the highest.
| Table 4: | Four alternative solutions for poor public transport |
 | |
| Table 5: | Analysis of four high-potential alternative solutions |
 | |
| B11, B21, B31, B211, B221, B331: Base case, C11, C21, C31, C211, C221, C331: Implementing NGV buses and rerouting, C12, C22, C32, C212, C222, C332: Increasing Mass rapid transit network, C13, C23, C33, C213, C223, C333: Increasing NGV Bus rapid transit (BRT) network and C14, C24, C34, C214, C224, C334: Improved Fare Structure of public transport | |
| Table 6: | Results of the Integrated transport model and vehicle emission model (Base case: with four high-potential alternative solutions: Daily) |
 | |
| Table 7: | Integrated transport model result and vehicle emission model(Base case: with four high-potential alternative solutions: A.M. Peak) |
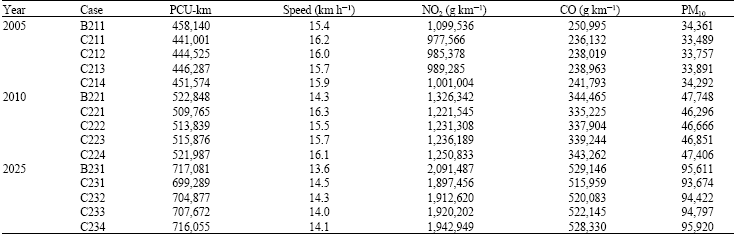 | |
At the same time, the solutions obtained for vehicular emissions (NO2, CO and PM10) are lowest compared with the other solutions, such as increasing the mass rapid transit network (cases C12, C22, C32, C212, C222 and C332), increasing the NGV bus rapid transit (BRT) network (cases C13, C23, C33, C213, C223 and C333) and improving the fare structure of public transportation (cases C14, C24, C34, C214, C224 and C334). The forecast emission levels meet the requirements of macro-ambient air quality standards.
The outputs of the P2 alternative solutions: The final results obtained from the abovementioned stages are converted into GIS format for further analysis and decision-making strategies as in Fig. 10.
GIS can perform a spatial analysis and produce graphical displays that are able to enhance the efficiency of the communication between transportation and environmental planners with the public. The need for environmental planning in Bangkok has been recognized by the transport and environment planners to prevent and control air pollution generated by the transportation sector.
This study carried out in 2 phases; Phase 1 concentrates on the application of pollution prevention technique to transportation sector in order to reduce air pollution emission, Phase 2 performs integration of transport and vehicle model for simulation of air pollutant emission.
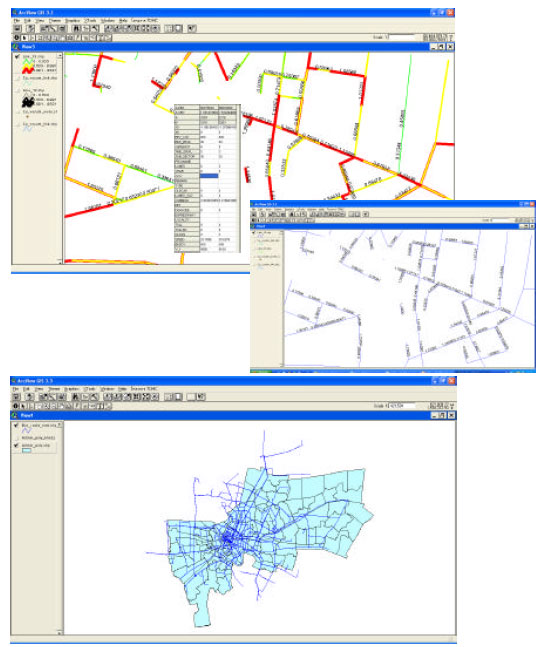 | |
| Fig. 10: | Outputs present on GIS format |
The main assumptions of this study are integration of pollution prevention techniques, transport and vehicle emission models, which can provide potential applications for prevention of air pollution from the transportation sector as a part of a move toward sustainable development and source reduction is a driving force or strategy tool for achieving prevention of high-risk air pollution. In practice, many recent techniques and models of transport and vehicle emissions are designed for United States and European which are clearly inappropriate for application to Asian cities (Okamato et al., 1990). In addition, lack of suitable techniques to clarify the sources of problems especially air emissions from transportation sector is another problem (Jones et al., 2000). This study proposes an efficient modelling solution of those problems in order to find out the appropriate techniques, which can be applied to Bangkok and the significant conclusions are as follows:
Air pollution prevention technique derived from United State Environment Protection Agency and multi-criteria analysis with AHP and fuzzy program could be applied through step by step on process mapping, root cause analysis/priority problem and generating.
Integrated transport and vehicle model (eBUAM and IVE) is used to simulate for selecting the alternative solutions. With scenario simulation for implementing NGV buses and rerouting, which scenario gives the lower air pollution NO2, CO and PM10
Source reduction is the process that is frequently used in environmental issues while implementing the principle in the transport sector has not been attempted before. This study has used the principle in creating an integrated model to forecast the reduction in emissions in forecasted years for Bangkok. The study showed that the integrated model forecasted results that predict reduction in emissions should be suggested by solutions i.e., implementing NGV and rerouting buses of the existing services for efficiency fosteration.
The result of this study is much different from the previous study as because of its successful filling the vacuum of the requirement for integrated tools or techniques for the analysis of vehicular emissions along with pollution prevention techniques, transport and vehicle emission models as developed for Bangkok only. The methodology of this study is based on the ideas of source reduction, where in process mapping, root-cause analysis, generating of alternative solutions and selecting the best solution are implicit and can find out the solutions which suite Bangkok. For example, The Pollution Prevention processes normally used in industrial lines in order to find out the result of prevention schemes (Graedel and Allenby, 1995), International Vehicle Emission (IVE) model is used to improve the understanding of the vehicle fleets, activity and emissions, to be made better choices for future transportation in developing countries (Davis, 2004). On the other hand, the transportation model is applied to simulate or forecasted the levels of traffic flow and travel conditions prior to estimation of emissions from traffic system (Taylor et al., 2001).
Conclusively, the above mentioned reasons would bolster the assumptions on application of pollution prevention and the integrated transport and vehicle emissions model for air pollution prevention from transport sector. It suggests that it is tested positively to reduce the passenger car kilometer (PCU-km), which is represented as a mobile source and reduces pollution by implementing NGV bus for using clean alternative fuel (Compress Natural Gas: CNG) and achieve dramatically improvement of air emissions generated form transportation sector.
CONCLUSIONS
This study discusses the causes of air pollution emission by the transportation sector. The results of this study include practical solutions that can reduce and control the levels of air emissions from the transportation sector in Thailand. A main component of this study is the use of source reduction to lower air emissions from the transportation sector in Thailand. Finally, this study proposes four potential solutions, including promoting the use of Natural Gas Vehicle (NGV) buses and instituting the rerouting of existing services, which are identified as the most effective and least expensive way to minimize air emissions.
Moreover, this study analyses air pollution prevention for the transportation sector by combining pollution prevention, transport, vehicle emissions and GIS techniques. Further studies should be conducted to facilitate the elucidation of suitable solutions that reduce pollution and are more environmentally friendly. However, a study on implementing NGV bus services and rerouting the existing bus service might not be successful, if it is not integrated with other strategic solutions, such as improved alternative fuels, transportation planning and vehicle standards and technologies. Furthermore, government support of these strategies is crucial.
ACKNOWLEDGMENTS
The authors would like to thank the National Research Centre for Environmental and Hazardous Waste Management, Chulalongkorn University, Thailand for financial support. We also thank the Research Centre for Environmental and Hazardous Substance management and the Department of Environmental Engineering and the Faculty of Engineering at Khon Kaen University, Thailand.
REFERENCES
- Yang, C.C. and B.S. Chen, 2004. Key quality performance evaluation using fuzzy AHP. J. Chinese Inst. Ind. Engineers, 21: 543-550.
Direct Link - Jones, S.G., B.E.A. Fisher, N. Gonzalez-Flesca and R. Sokhi, 2000. The use of measurement programmes and models to assess concentrations next to major road in urban areas. Environ. Monitor. Assess., 64: 531-547.
Direct Link - Mayer, H., C. Haustein and A. Matzarakis, 1999. Urban air pollution caused by motor-traffic. Adv. Air Pollut., 6: 251-260.
Direct Link - Okamato, S., K. Kobayashi, O. Norihito, K. Kitabayashi and K. Noritaka, 1990. Comparative study of estimation methods for NOx emission from roadway. Atmos. Environ., 24: 1535-1544.
Direct Link