
D. Nikkami
Soil Conservation and Watershed Management Research Institute, P.O. Box 13445-1136, Tehran, Iran
M. Shabani
Arsanjan Unit, Azad University, Fars, Iran
H. Ahmadi
Faculty of Natural Resources, Tehran University, Tehran, Iran
Journal of Applied Sciences
Year: 2009 | Volume: 9 | Issue: 2 | Page No.: 287-295


ABSTRACT
The main objective of this research is to study the optimized combination of land allocation to different land uses like rangeland, orchard, irrigated farming and dry farming for minimized soil erosion and maximized people`s net income in Kharestan watershed located in the Northwest of Eghlid, Fars province, Iran. A multi-objective Linear Programming (LP) model was applied in three different land use scenarios including existing land uses plus land management (Scenario 1), existing land uses with some degree of land management (Scenario 2), and proper land uses plus land management (Scenario 3). The amount of soil loss and net benefit in each land use were computed and used as inputs to formulate the objective functions and governing constraints in optimization problem. The problem was solved using the simplex method with the help of LINGO software package and the optimal solution was ultimately determined. The results showed that in the optimized condition, while rangelands experience no change, the area of orchards should be increased from 561 to 2115 ha (377%), irrigated farms should be reduced from 871 to 237 ha (73%) and dry farming lands should be decreased from 1050 to 129 ha (88%). Also, by existing land management, land use optimization decreases soil erosion by 3.7% and increases net income by 163%. In existing land use some land management implementation, decreases soil erosion by 37% and increases net income by 206%, while in proper land uses and management, soil erosion decreases by 53% and net income increases by 208%. Sensitivity analysis showed that the area of orchards and rangelands are the most sensitive parameters and their changes have the highest effect on the amount of net income and soil erosion.
PDF Abstract XML References Citation
How to cite this article
D. Nikkami, M. Shabani and H. Ahmadi, 2009. Land Use Scenarios and Optimization in a Watershed. Journal of Applied Sciences, 9: 287-295.
DOI: 10.3923/jas.2009.287.295
URL: https://scialert.net/abstract/?doi=jas.2009.287.295
DOI: 10.3923/jas.2009.287.295
URL: https://scialert.net/abstract/?doi=jas.2009.287.295
INTRODUCTION
The magnitude of human influence on natural ecosystems usually ends with widespread environmental problems such as soil erosion, floods and droughts threatening human being. Rangeland deterioration (and erosion) has accelerated in current decades, primarily due to a doubling or tripling of livestock numbers, extensive plowing of rangelands, firewood cutting, expansion of well drilling into formerly inaccessible areas, and better transportation facilities. The area of abandoned arable land in Iran has doubled in recent years and the number of livestock on grazing lands is estimated to be two to three times the carrying capacity. The prevention of soil erosion, which means reducing the rate of soil erosion to approximately that which would occur under natural conditions, relies on selecting appropriate strategies for soil conservation (Morgan, 1979).
Although it is impossible to stop soil erosion completely under natural conditions, there is a great need to control erosion for proper land and water use planning. This requires awareness of soil erosion and foreseeing changes such as in land use.
On a global scale the annual loss of 75 billion tons of soil costs the world about US$400 billion per year, or approximately US$70 per person per year (Eswaran et al., 2001). There is no official document on the amount of soil erosion in Iran. Based on a research on the suspended sediment data of more than 200 sampling stations around the country, average annual suspended sediment yield is reported to be 2 t ha-1 or 350 million tons (Arabkhedri, 2003). Assuming Sediment Delivery Ratio (SDR) of 17.1 to 21.6 (Ouyang and Bartholic, 1997) and the amount of bed load to be 20% of the amount of suspended load, the amount of soil erosion in Iran is some 2 billion tons (2.7% of the world’s soil loss). Perhaps one of the most costly results of soil erosion is related to damage done by the soil particles that are dislodged and moved downwind or downstream. Sedimentation raises streambeds, reducing the depth and capacity of the channels. Sedimentation of lakes and reservoirs reduces their capacity, value and life expectancy (Frederick et al., 2003). Each year, 550 Mm3 of new dam reservoirs are built in Iran from which more than 200 Mm3 is filled by sedimentation (Samadi Broujeni and Shamsaei, 2007). Erosion has become an environmental problem (Ananda and Herath, 2003) as well that must be remedied for the sake of clean air and water. Soil particles adsorb pollutants such as pesticides, fertilizers and different industrial and municipal chemicals that are best kept out of water by keeping the soil on the land (Foster, 1988; Wanielista and Yousef, 1993). It has therefore economic, political, social and environmental consequences due to both on-site and off-site damages caused by soil erosion.
The conflict between environmental protection and the economic issues are challenges facing land use planners and decision makers in many developing countries (Chang et al., 1995; Gezelius and Refsgaard, 2007). Proper environmental planning needs especial consideration on land use scenarios and optimization. The watershed optimization for each land use, especially agriculture as one of the significant contributors to the environmental degradation, is therefore necessary to achieve sustainable development (Seppelt and Voinov, 2002; Heilman et al., 2003; Wang et al., 2004).
Nikkami et al. (2002) indicated that land use optimization is one of the appropriate strategies for soil conservation. They used land use optimization for minimizing soil erosion and maximizing farm production of each land use in Damavand watershed, Iran. The expected annual soil erosion from the entire watershed was reduced by 5% and the annual net farm income was increased by 134%. Mohseni Saravi et al. (2003) used goal programming in Garmabdasht watershed in Golestan province, Iran, to determine the optimal solution for different activities in the watershed. Industrial forest, pasture, park and protected areas were optimized with the goals of maximization of benefit, production, employment opportunities, and minimization of total investment and sediment yield. Kralisch et al. (2003) and Riedel (2003) combined artificial neural network and GIS with LP to maximize benefits gained from land utilization in a watershed in Germany and mountainous area of North Thiland, respectively.
Benli and Kodal (2003) developed linear and non-linear programming models in South-east Anatolian watershed in Turkey for determination of optimum cropping pattern, water amount and farm income under two scenarios of adequate and limited water supply conditions. Wang et al. (2004) used LP and GIS for land use optimization based on existing land use, slope, distance to surface water and conversion preferences in Lake Erhai basin, China. Luo and You (2007) presented a modeling approach to investigate water quality trading in soil erosion control, based on watershed simulation and optimization models in which various uncertainties were reflected within the Swift Current Creek watershed, Canada. Sadeghi et al. (2008) used a multi-objectives linear optimization problem for minimizing soil erosion and maximizing farm production of each land use in Brimvand watershed, Iran. The results of the study revealed that the amount of soil erosion and benefit could respectively, reduce and increase to the tune of 7.9 and 18.6%, in case of implementing optimal allocation of the study land uses.
Considering scarcely documented researches in land use management and protecting watershed resources applying optimization approaches, the present study has been conducted to optimize land resources allocation to orchard, rangeland, irrigated cropland and dry farming within the Kharestan watershed in the northwest of Eghlid city, Fars province, Iran, using a multi-objective linear programming approach.
MATERIALS AND METHODS
This study was conducted in Kharestan watershed located in upstream of Doroodzan Dam in the north west of Eghlid city in Fars province, Iran, during years 2006-2007. It extends between 30°E35’ to 30°E47’ N latitude and 51°E47’ to 52°E00’ E longitude and covers an area of 14685 ha (Fig. 1).
The average yearly precipitation is 580 mm in a Mediterranean and semi-wet climate condition. Maximum, minimum and average elevations are 3040, 1900 and 2337 m above sea level and average land slope is 25.67%. The information and data required for computation of soil erosion and net income in each land use, land and water availability, soil characteristics, land slope and socio-economical conditions were extracted from the available studies of Fars province Watershed Management Office in addition to some other field studies and land surveysfor further details and information. The slope, land component, land use and erosion maps as a part of necessary maps in the study area have been shown in Fig. 2.
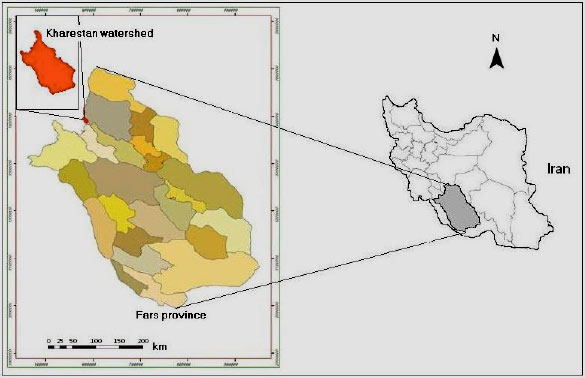 | |
| Fig. 1: | Location of the study area on the Iran map |
Kharestan contains a diversity of land uses and slope classes. The major land uses are rangeland, dry farming, irrigated farming and orchard with the areas of 10550, 1050, 871 and 561 ha, respectively. Based on linearity of objective functions, multi-objective linear programming model was applied for three different scenarios of land use combination and land management.
Scenario 1: Existing land uses plus land management, to show the effect of land use optimization with no any change on the land management practices
Scenario 2: Existing land uses with some degree of land management, to show the effect of very simple land management activities.
Scenario 3: Proper land uses plus land management, to show the effect of both land use optimization and land management on minimizing soil erosion and maximizing net income.
In the first scenario, existing land uses were mapped using 2002 Landsat imagery and checked by field work. With no change in the area of existing land use, land management practices were applied on these areas within the second scenario. In the last scenario, all scientific aspects of land suitability (Mahler, 1979; Brengle, 1982) and land use management were considered.
The amount of soil loss in each land use is estimated from the application of modified Pacific South-west Inter-Agency Committee model (Johnson and Gebhardt, 1982) in ILWIS-GIS and applying the concept of sediment delivery ratio. For proper management of agricultural lands, it is not wise to have dry farming on slopes greater than 12% and irrigated farms on slopes greater than 5%. Recommended slopes are milder than these slopes in order to avoid soil erosion and reduction of crop yield.
All benefit/cost data of the crops were collected through field studies. Major orchard crops that are included in this model were apple, walnut, egg-plum, peach and almond. Irrigated farms were planted with wheat, barley alfalfa and cucurbit. Dry farming crops were wheat, barley, and lentil. The weighted average dry-forage production, their Total Digestible Nutrients (TDN) and total animal units per hectare were also determined.
There is no research on the evaluation of economic losses due to soil erosion in the study area. Therefore, it is difficult to evaluate it directly. However, these losses can be estimated indirectly by the evaluation of fertile soil loss. For example, based on data relating topsoil loss to yield reduction, just 2.5 cm of topsoil loss is sufficient to reduce U.S. wheat yields by an average of 60 million bushels (bushel = 35.21L) per year. Another way to estimate economical losses due to soil erosion is to apply lost soil to the eroded area based on the depth of root zone in each land use.
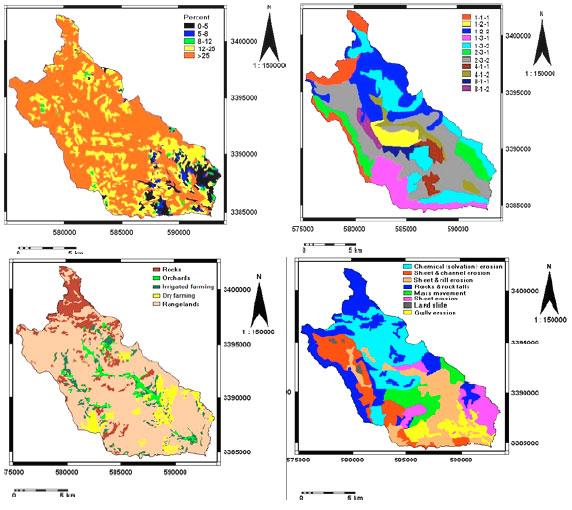 | |
| Fig. 2: | Slope (top left), land components (top right), land use (bottom left) and erosion (bottom right) maps for determination of allocable land resources within Kharestan watershed, Iran |
The depth of the lost soil in each land use is calculated by considering the amount of soil erosion in that land use, the appropriate rooting depth of vegetation (root zone) and soil bulk density. The general form of a multi-objective optimization problem in the Kharestan watershed with n decision variables, m constraints and p objectives to minimize soil erosion and maximize net income is as given in Eq. 1-4 (Nikkami et al., 2002).
(1) |
(2) |
Subject to:
(3) |
(4) |
where, Z1 and Z2 are the annual net farm income in million Iranian Rails (mIR) and the total annual soil loss (t), respectively. In each land use Xi, Ci, Ai1,Ai2 and Ai3 are surface area (ha), annual soil loss per unit area (t ha-1), amount of net farm income (mIR ha-1), production cost (mIR ha-1) and cost due to soil loss (mIR ha-1), respectively. B is the total land area (ha-1). The problem can be written in detail in the following form:
(5a) |
(5b) |
Subject to:
(5c) |
(5d) |
(5e) |
(5f) |
(5g) |
(5h) |
(5i) |
(5j) |
where, X1 through X4 are areas allocated to orchard, rangeland, irrigated farming and dry farming (ha), respectively. A11 through A41 are amounts of net farm income per unit area of orchard, rangeland, irrigated farming and dry farming (mIR ha-1). A12 through A42 are production costs per unit area of orchard, rangeland, irrigated farming and dry farming (mIR ha-1). A13 through A43 are erosion costs per unit area of orchard, irrigated farming and dry farming (mIR ha-1). C1 through C4 are annual soil loss per unit area of orchard, rangeland, irrigated farminghj and dry farming (t ha-1). B1 through B7 are maximum limits of orchard surface area, surface area of irrigated farming, surface area of dry farming, surface area of orchard plus irrigated farming, total area, lower limit of orchard surface area, and surface area of rangeland (ha), respectively. There are 25 springs with discharges from 1 to 30 L sec-1 and two rivers of Kharestan and Tizab located in the west and east of the watershed, respectively with annual discharge of 8.53 Mm3 that is sufficient for agricultural development. Therefore, no constraint was defined for water availability.
Due to not being able to make any changes in the use of urban lands, these areas were excluded from land use optimization.
RESULTS AND DISCUSSION
The solution of optimization procedure for each scenario is given below.
First scenario: The general form of the optimization problem is written as follow.
 | (6a) |
(6b) |
By simplifying the first objective function and changing the minimization to maximization form in the second objective, these equations change to the following simpler forms.
(7a) |
(7b) |
Second scenario:
| | (8a) |
| | (8b) |
By simplifying the first objective function, and changing the minimization to maximization form in the second objective, these equations change to the following simpler forms.
(9a) |
| | (9b) |
Third scenario:
 | (10a) |
(10b) |
By simplifying the first objective function, and changing the minimization to maximization form in the second objective, these equations change to the following simpler forms.
(11a) |
(11b) |
There are eight constraints of the land use optimization model. The constraints and their justifications are discussed below.
Constraint 1: X1 ≤ 2115
The first constraint indicates that the present area under orchard, which is 561 ha, could be increased up to 2115 ha. The reason for this constraint is that the areas of irrigated farms with slope classes of more than 5% are not suitable for irrigating cropland. These lands could be changed to other land uses especially orchards, by terracing, if necessary, and planting permanent vegetation.
Constraint 2: X3 ≤ 237
The second constraint is that irrigated farms, currently 871 ha in area, after subtracting high slope classes as described in constraint 1, could not be more than 237 ha.
Constraint 3:X4 ≤ 207
Slopes more than 12% are not suitable for dry farming. The third constraint indicates that the area under dry farming, which is 1050 ha, after subtracting high slope classes, could not be more than 207 ha. Other reasons for this constraint are as follows:
| • | The government owns the rangelands and people cannot make any changes. |
| • | Due to lack of sufficient rainfall in the area, dry farming is not suitable for most areas in this watershed. |
| • | People seldom use supporting practice systems in dry farming lands, which cause large amounts of soil erosion in this form of land use. |
Constraint 4: X1+X3 ≤ 2352
Assuming no limitation on irrigation water, the fourth constraint implies that the area under orchard and irrigated croplands could not be more than 2352 ha based on existing slope and soil depth.
Constraint 5: X1+X+X3+X4 =13032
The fifth constraint is simple and it is the area limitation of the Kharestan watershed after subtracting the urban lands. The sum of the areas under the four land uses should be equal to 13032 ha of the available lands.
Constraint 6: X1 ≥ 561
As explained in Constraint 1, the sixth constraint forbids reduction of the present area under orchards.
Constraint 7: X2 ≥ 10550
The seventh constraint indicates that the area under rangeland should be at least 10550 ha. The reason for this constraint is that the government owns the rangelands and people cannot change their form of land use (Iran
Forest and Rangeland Nationalization, Act of 56).
Many rangelands have been illegally converted to improper dry farming lands, which could be changed back to rangelands.
Constraint 8: X1, X2, X3, X4 ≥ 0
The last constraint is the non-negative variable declaration. Table 1 shows the area, average annual soil loss and average annual net income for each land use. Simplified objective functions and the constraints discussed above for three scenarios i.e, (scenario 1) existing land uses plus land management, (scenario 2) existing land uses with some degree of land management and (scenario 3) proper land uses plus land management are entered in Table 2 to 4, respectively as revised multi-objective linear simplex tableaus. The computer program LINGO is used to solve the problems.
After taking allocated areas into account, average annual soil loss and net income for each scenario is indicated in Table 5 to 7. The results showed that in the optimized condition, while rangelands experience no change, the area of orchards should be increased from 561 to 2115 ha (377%), irrigated farms should be reduced from 871 to 237 ha (73%) and dry farming lands should be decreased from 1050 to 129 ha (88%). In the first scenario the annual soil loss would have decreased by 4288 t (3.7%) and the annual net income increased by 26,540 mIR (163%). In the second scenario the annual soil loss would have decreased by 51320 t (37%) and the annual net income increased by 37,360 mIR (206%). In the last scenario the annual soil loss would have decreased by 71853 t (53%) and the annual net income increased by 37,780 mIR (208%).
| Table 1: | Area, soil loss, and net income in each land use of Kharestan watershed |
 | |
| Table 2: | Linear multi-objective simplex table of Kharestan watershed in scenario 1 |
 | |
| aColumns 2 through 5 present decision variables, which in rows 2 and 3 have currency and soil loss units, respectively. Numbers 1 and 0 in the remaining rows show the presence or absence of the decision variables in constraints, respectively, bRows 2 and 3 of column 6 indicate the maximization or minimization form of the objective functions while remaining rows indicate the equality or inequality form of the constraints, cThe last column gives the Right Hand Side (RHS) value of each constraint, which represents land availability in hectares | |
| Table 3: | Linear multi-objective simplex table of Kharestan watershed in scenario 2 |
 | |
| aColumns 2 through 5 present decision variables, which in rows 2 and 3 have currency and soil loss units, respectively. Numbers 1 and 0 in the remaining rows show the presence or absence of the decision variables in constraints, respectively, bRows 2 and 3 of column 6 indicate the maximization or minimization form of the objective functions while remaining rows indicate the equality or inequality form of the constraints, cThe last column gives the Right Hand Side (RHS) value of each constraint, which represents land availability in hectares | |
| Table 4: | Linear multi-objective simplex table of Kharestan watershed in scenario 3 |
 | |
| a Columns 2 through 5 present decision variables, which in rows 2 and 3 have currency and soil loss units, respectively. Numbers 1 and 0 in the remaining rows show the presence or absence of the decision variables in constraints, respectively, b Rows 2 and 3 of column 6 indicate the maximization or minimization form of the objective functions while remaining rows indicate the equality or inequality form of the constraints, c The last column gives the Right Hand Side (RHS) value of each constraint, which represents land availability in hectares | |
| Table 5: | Land use optimization output of Kharestan watershed in scenario 1 |
 | |
| Table 6: | Land use optimization output of Kharestan watershed in scenario 2 |
 | |
| Table 7: | Land use optimization output of Kharestan watershed in scenario 3 |
 | |
Sensitivity analysis of the resource Bi on soil loss and net income in scenarios 1 to 3 is presented by Fig. 3. In this figure B1 through B7 are maximum limits of orchard surface area, surface area of irrigated farming, dry farming, orchard plus irrigated farming, total area, lower limit of orchard surface area and surface area of rangeland (ha), respectively. Sensitivity analysis often begins with the investigation of the effect of changes in the Bi, the amount of resource i being made available for the activities under consideration. The reason is that there is generally more flexibility in setting and adjusting these values than there is for the other parameters of the model.
 | |
| Fig. 3: | Sensitivity analysis: the effect of resources Bi on soil loss (right) and net income (left) in scenarios 1 to 3 |
The economic interpretation of the dual variables as shadow prices is extremely useful for deciding which changes should be considered. The shadow price (yi*) for resource i measures the marginal value of this resource, that is, the rate at which Z could be increased by slightly increasing the amount of this resource being made available. In particular, if yi* > 0, then the optimal solution changes if Bi is changed, so Bi is a sensitive parameter. Then the investigation continued on Ai1 and Ci parameters. It was found that , which refers to the restriction of area under orchard was the most sensitive parameter.
The results approved the applicability of multi-objective optimization model in solving problems with different objectives which sometimes conflicting each other. It can also be concluded that the multi-objective linear programming can be used to tractably search for optimum land use scenarios with respect to different governing constraints existing within a watershed. The results also showed the successful linkage between economic aspects and environmental outcomes at a watershed scale as emphasized by others.
ACKNOWLEDGMENTS
The authors profoundly are grateful to the Soil Conservation and Watershed Management Research Institute and the Forests, Rangelands and Watershed Management Organization, both in Tehran, Iran for supplying valuable information and assistance.
REFERENCES
- Ananda, J. and G. Herath, 2003. Soil erosion in developing countries: A socio-economic appraisal. J. Environ. Manage., 68: 343-353.
CrossRef - Benli, B. and S. Kodal, 2003. A non-linear model for farm optimization with adequate and limited water supplies: Application to the South-East Anatolian Project (GAP) Region. Agric. Water Manage., 62: 187-203.
Direct Link - Chang, N.B., C.G. Wen and S.L. Wu, 1995. Optimal management of environmental and land resources in a reservoir watershed by multiobjective programming. J. Environ. Manage., 44: 144-161.
CrossRefDirect Link - Eswaran, H., R. Lal and P.F. Reich, 2001. Land Degradation: An Overview. In: Response to Land Degradation. Bridges, E.M., I.D. Hannam, L.R. Oldeman, F.W.T. Penning de Vries, S.J. Scherr and S. Sombatpanit (Eds.). Science Publishers Inc., Enfield, NH, USA., pp: 20-35.
Direct Link - Gezelius, S.S. and K. Refsgaard, 2007. Barriers to rational decision-making in environmental planning. J. Land Use Policy, 24: 338-348.
Direct Link - Heilman, P., Y. Duan, R. Miller and D.P. Guertin, 2003. Calculating the cost of reducing erosion from a small rangeland watershed. Proceedings of the 1st Interagency Conference on Research in the Watersheds, October 27-30, 2003, Benson, AZ., pp: 398-404.
Direct Link - Kralisch, S., M. Fink, W.A. Flugel and C. Beckstein, 2003. A neural network approach for the optimisation of watershed management. J. Environ. Model. Software, 18: 815-823.
CrossRefDirect Link - Luo, B. and J. You, 2007. A watershed-simulation and hybrid optimization modeling approach for water-quality trading in soil erosion control. Adv. Water Res., 30: 1902-1913.
Direct Link - Nikkami, D., M. Elektorowicz and G.R. Mehuys, 2002. Optimizing the management of soil erosion. Water Qual. Res. J. Can., 37: 577-586.
Direct Link - Sadeghi, S.H.R., K. Jalili and D. Nikkami, 2008. Land use optimization in watershed scale. J. Land Use Policy.
Direct Link - Samadi Broujeni, H. and M.R. Shamsaei, 2007. The role and position of watershed management in the future of control and utilization of water resources in Iran. Proceedings of the 2nd Iranian Water Resources Management Conference, January 23-24, 2007, Isfahan University of Technology, Isfahan, Iran, pp: 8.
- Seppelt, R. and A. Voinov, 2002. Optimization methodology for land use patterns using spatially explicit landscape models. J. Ecol. Model., 151: 125-142.
Direct Link - Wang, X., S. Yu and G.H. Huang, 2004. Land allocation based on integrated GIS-optimization modeling at a watershed level. Landscape Urban Planning, 66: 61-74.
Direct Link