
A. Shafiee
Geotechnical Engineering Research Center, International Institute of Earthquake Engineering and Seismology, Tehran, Iran
H.R. Tavakoli
Geotechnical Engineering Research Center, International Institute of Earthquake Engineering and Seismology, Tehran, Iran
M.K. Jafari
Geotechnical Engineering Research Center, International Institute of Earthquake Engineering and Seismology, Tehran, Iran
Journal of Applied Sciences
Year: 2008 | Volume: 8 | Issue: 18 | Page No.: 3108-3118


ABSTRACT
This study describes an experimental study on compacted sand-clay mixtures to investigate pre-failure and failure characteristics of such mixtures under monotonic compression and extension loading paths. Results reveal that pore pressure, secant modulus, undrained shear strength and angle of shearing resistance increase when sand content was raised in both compression and extension. It was also found that the tested materials were overconsolidated by the fact that normalized shear strength depends on initial confining stress. The compacted sand-clay mixtures exhibit anisotropy in mechanical behavior so that undrained shear strength and angle of shearing resistance were greater in compression than in extension. The extent of the anisotropy increases with sand content.
PDF Abstract XML References Citation
How to cite this article
A. Shafiee, H.R. Tavakoli and M.K. Jafari, 2008. Undrained Behavior of Compacted Sand-Clay Mixtures Under Monotonic Loading Paths. Journal of Applied Sciences, 8: 3108-3118.
DOI: 10.3923/jas.2008.3108.3118
URL: https://scialert.net/abstract/?doi=jas.2008.3108.3118
DOI: 10.3923/jas.2008.3108.3118
URL: https://scialert.net/abstract/?doi=jas.2008.3108.3118
INTRODUCTION
Compacted aggregate-clay mixtures are currently successfully used as the cores of embankment dams. These materials, called composite clays by Jafari and Shafiee (2004), are usually broadly graded and are composed of clay as the main body with sand, gravel, cobble or even boulders floating in the clay matrix. Karkheh and Gotvand dams in Iran are some recent examples of dams with cores composed of aggregate-clay mixtures.
It is also a current practice to employ a mixture of high plastic clay with aggregates as impervious blankets for waste disposal projects (Chapuis, 1990; Pandian et al., 1995; Abichou et al., 2002). It is generally assumed that the coarser fraction of such soils imparts a relatively higher shear strength and high compacted density while the permeability of the soil is governed by the proportion and index properties of the finer fraction (Shafiee, 2008).
Yin (1999) experimentally investigated the behavior of Hong Kong marine deposits with different clay contents. Test results revealed that the friction angle of deposits decreases with an increase in plasticity index. Young`s modulus also increases with an increase in effective confining pressure but decreases with an increase in clay content. Vallejo and Mawby (2000) carried out a series of direct shear tests and porosity measurements on sand-clay mixtures. It was found that the percentage of sand in the mixtures had a marked influence on their shear strength. It was determined that when the concentration by weight of the sand in the mixtures was more than 75%, the shear strength of the mixtures was governed mainly by the frictional resistance between the sand grains. When the concentration of sand varied between 75 and 40%, the shear strength of the mixture was provided in part by the shear strength of the clay and in part by the frictional resistance between the sand grains. When the sand concentration was less than 40% by weight, the shear strength of the mixture was entirely dictated by strength of clay.
Muir Wood and Kumar (2000) conducted drained and undrained triaxial compression tests on isotropically normal consolidated and overconsolidated mixtures of kaolin clay and coarse uniform sand. It was found that the deviator stress, clay volumetric strain and pore pressure were unaffected by the presence of the sand until the clay content fell below 40%. Jafari and Shafiee (2004) carried out a series of strain-controlled monotonic and cyclic triaxial tests on gravel-fat clay and sand-fat clay mixtures to investigate the effects of aggregate on the mechanical behavior of the mixtures. Compression monotonic test results revealed that the angle of shearing resistance increased with aggregate content. Also, when aggregate content was raised, pore pressure rose in both monotonic and cyclic loading. It was also found that the presence of aggregates within a cohesive matrix led to formation of a heterogeneous field of density in the clayey part of the mixture. Prakasha and Chandrasekaran (2005) conducted an experimental study on reconstituted Indian marine soils having different proportions of sand and clay. Test results revealed that sand grains in clay leads to reduction in void ratio and increase in friction and pore pressure response resulting in decrease in undrained shear strength.
A review of the published literature reveals that experimental studies on aggregate-clay mixtures have mainly focused on shear strength parameters, particularly in compression loading and shear strength either increases with aggregate content or remains constant until a limiting aggregate content, then increases as the aggregate content increases. To explore all features of mechanical behavior, there is a need to investigate pre-failure along with failure behavior of the mixtures subjected to various loading paths. The present study describes the pre-failure and failure characteristics of compacted sand-clay mixtures under monotonic compression and extension loading paths.
MATERIALS AND METHODS
Materials tested: Pure clay with two mixtures of sand-clay were used in this study. The physical properties of the materials were measured just prior to the beginning of the shear tests. The clay had a specific gravity of 2.70, liquid limit of 42% and plasticity index of 18%. The grain-size distribution curve for the clay is shown in Fig. 1. X-ray diffraction analysis revealed that the clay was mainly composed of kaolinite with some illite, montmorilonite and quartz.
The sand used in the study was retrieved from a riverbed and composed of subrounded particles with a specific gravity of 2.65. The aggregates used as sand material passed through a 4.75 mm sieve and was retained on a 3.35 mm sieve, with minimum and maximum void ratios of 0.667 and 0.803, respectively. The gap graded gradation was considered for the aggregates to minimize the effect of particle size distribution of sand on the mechanical behavior of the mixture. Figure 1 shows the grain-size distribution curve of the parent granular material from which the sand was sieved.
The clay was mixed with different amounts of sand to obtain different mixtures. Three mixtures were obtained by mixing 100, 60 and 40% of clay with sand in volumetric proportions. A minimum of 40% clay content was considered since this is a limit value for materials used as cores in embankment dams.
Specimen preparation: The specimen preparation technique was chosen to model as precisely as possible the in situ condition of the core materials of embankment dams.
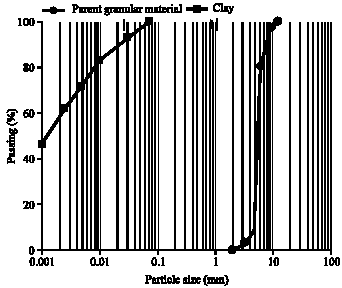 | |
| Fig. 1: | Particle size distribution of materials used in the study |
| Table 1: | Specimen properties |
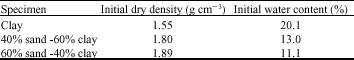 | |
All specimens, typically 38 mm in diameter and 76 mm in height, were prepared with a dry density of 95% of the maximum dry density obtained from the standard compaction test method and water content of 2% wet of optimum. Table 1 presents the initial dry density and water content of the specimens.
Appropriate amounts of clay and sand for each layer were first thoroughly mixed. Each layer was then mixed with water at least 24 h before use and sealed. The material was poured in six layers into a cylindrical mold and compacted. To achieve a greater uniformity of specimens, a procedure similar to the undercompaction technique (Ladd, 1978) was used. For each layer, the compactive effort was increased toward the top by increasing the number of blows per layer. Each layer was then scored after it was compacted for better bonding with the next layer.
To reduce the effect of cap friction during the triaxial test, two thin rubber sheets coated with silicone grease were placed between the lower and upper porous stones and the specimen. Further, the sheets in contact with the specimen were divided into four sectors. This was done to let the specimen deform more easily in the lateral direction. Five drainage holes of about 5 mm in diameter were also provided in the rubber sheets to facilitate the saturation and consolidation process. The specimen preparation technique was verified when repeated testing of similar specimens yielded consistent results.
Test procedure: The specimens were saturated with a Skempton B value in excess of 97%. To facilitate the saturation process, CO2 was first percolated through the specimens (this was more effective for saturation of the low clay content specimens), then de-aired water was flushed into the specimens. Lastly, a back pressure of 200 kPa was incrementally applied to accelerate the saturation rate. The specimens were then isotropically consolidated under effective stresses of 100, 300 and 500 kPa.
Following consolidation, undrained monotonic triaxial tests were carried out under strain-controlled conditions either in compression or extension. An advanced automated triaxial testing apparatus was used to conduct the monotonic tests. The specimens were tested at an axial rate of 0.01 mm min-1. The loading rate was chosen so that pore pressure equalization throughout the specimen was ensured. The compression and extension monotonic tests were continued until an axial strain of at least 15% was achieved.
RESULTS AND DISCUSSION
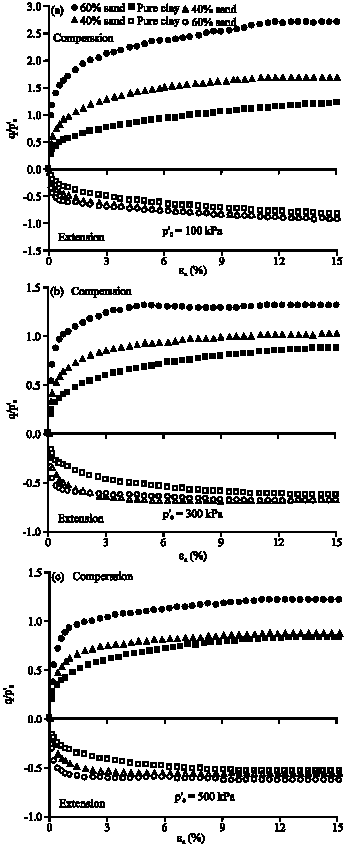
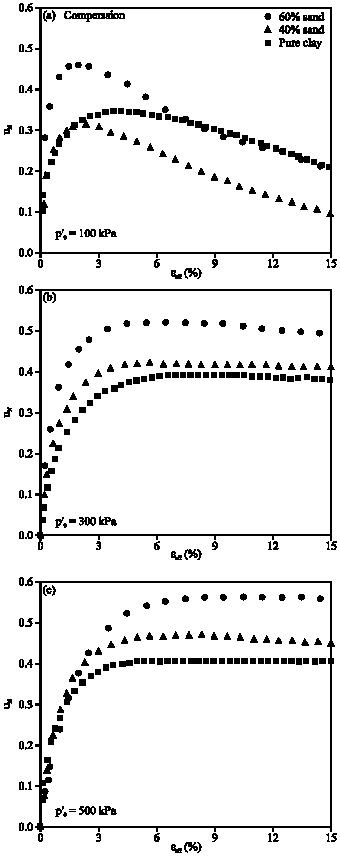
Stress-strain characteristics: Figure 2 shows the variation of stress ratio, q/p`0, versus axial strain, εa, in compression and extension tests at various initial confining stresses, q/p`0, where q is the deviator stress and defined as ![]() (
(![]() being the principal effective stresses). As can be seen, sand content has a dramatic influence on the stress-strain behavior of the mixtures in compression and stress ratio increases remarkably with sand content. For example, the addition of 60% sand into the clay leads to 280, 210 and 170% increases in stress ratio at an axial strain level of 3% (where the behavior starts to stabilize) for initial confining stresses of 100, 300 and 500 kPa, respectively.
being the principal effective stresses). As can be seen, sand content has a dramatic influence on the stress-strain behavior of the mixtures in compression and stress ratio increases remarkably with sand content. For example, the addition of 60% sand into the clay leads to 280, 210 and 170% increases in stress ratio at an axial strain level of 3% (where the behavior starts to stabilize) for initial confining stresses of 100, 300 and 500 kPa, respectively.
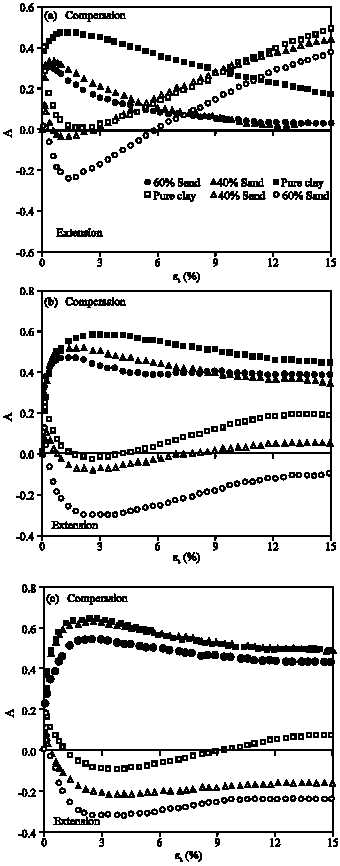
It is also found that, regardless of the sand content and strain level, the stress ratio decreases when the initial confining stress is raised. In the extension tests, stress ratio slightly decreases with sand content for strain levels of less than 3%. In high strain levels, the effect of sand content on the behavior gradually diminishes and all curves converge to the same value. It appears that in the extension test, as opposed to the compression test, the undrained shear strength is unaffected by the sand content.
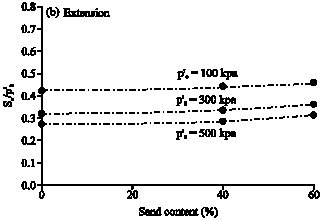
Figure 3 presents the variation of normalized undrained shear strength, Su/p`0, with sand content in compression and extension tests at various initial confining stresses, where Su refers to the undrained shear strength and is defined as half of the deviator stress at an axial strain level of 15%. Since stress-strain curves do not exhibit a clear peak, deviator stress at a high axial strain is selected as an indication of shear strength.
 | |
| Fig. 2: | Stress ratio-strain curves of sand-clay mixtures tested under different initial confining stresses |
Figure 3a clearly indicates that, in compression loading, the undrained shear strength increases with sand content.
 | |
 | |
| Fig. 3: | Undrained shear strength of sand-clay mixtures in (a) compression and (b) extension |
The increase is remarkable, when sand content reaches as high as 60% and the initial confining stress is low (i.e., 100 kPa). On the other hand, sand content does not remarkably affect the undrained shear strength in extension loading and shear strength exhibits a gradual increase with sand content for all confining stresses (Fig. 3b). It is also worth noting that, regardless of the initial confining stress, the undrained shear strength in extension tests is less than for the compression test at an identical sand content. In addition, normalized undrained shear strength decreases with confining stress in both compression and extension loading. Keeping in mind that the value of Su/p`0 (in compression) for normally consolidated clays is only related to the plasticity index (e.g., Chandler, 1988), it can be inferred that the tested materials are overconsolidated (because of the high compaction energy transferred to them during specimen preparation) with a preconsolidation pressure of between 100 to 300 kPa.
As seen in Fig. 3a, when p`0 is more than 100 kPa, the tested materials behave as a normally consolidated soil and Su/p`0 remains nearly constant, independent of initial confining stress. The rate of decrease in Su/p`0 with confining stress increases with sand content in compression; however, the rate is nearly identical for all mixtures in extension.
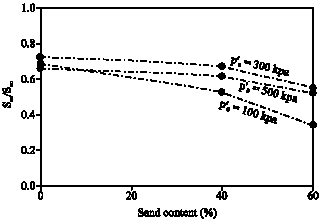 | |
| Fig. 4: | Undrained shear strength anisotropy of sand-clay mixtures |
Figure 4 also indicates the extent of the undrained shear strength anisotropy of compacted sand-clay mixtures. The anisotropy in undrained shear strength is defined as the ratio of shear strength in extension to compression loading, Sue/Suc (Duncan and Seed, 1966). It should be noted that aggregate-clay mixtures, whether used as the core of embankment dams or as the materials in soil liner systems, are inherently anisotropic owing to the method of compaction (the technique used herein for the specimen preparation). As can be seen, the strength anisotropy is manifested when sand content is raised. The undrained shear strength anisotropy ranges from 0.66 to 0.72 for pure clay, while it varies from 0.34 to 0.52 for the mixture containing 60% sand. Test results also reveal that the influence of the sand content on the strength anisotropy is more pronounced at an initial confining stress of 100 kPa.
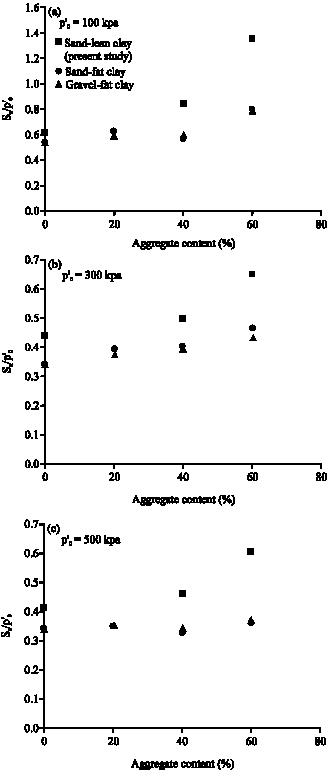
To explore the effect of plasticity of the clay on undrained shear strength, a comparison was made with the shear strength of aggregate-fat clay mixtures studied by Jafari and Shafiee (2004), where the clay had a plasticity index of 38%. As shown in Fig. 5, when the plasticity of the clay is reduced, the undrained shear strength increases. This is caused by the tendency of the mixture to show more contractive behavior (leading to an increase in pore pressure build-up), when the plasticity of the clay is increased. For example, normalized pore pressure in 60% aggregate -40% fat clay mixtures ranges from 0.65 to 0.68 at an axial strain of 15% and an initial confining stress of 500 kPa (Jafari and Shafiee, 2004), while it is 0.52 for the sand-clay mixture at an identical axial strain and initial confining stress (Fig. 6c). It is also interesting to note that the effect of clay plasticity on the undrained shear strength is more evident when the aggregate content is raised (Fig. 5).
 | |
| Fig. 5: | Effect of the plasticity of clay on the undrained shear strength of aggregate-clay mixtures |
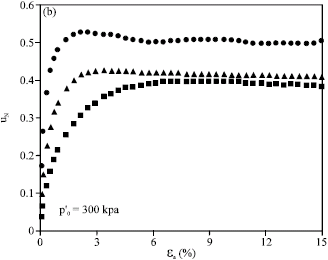
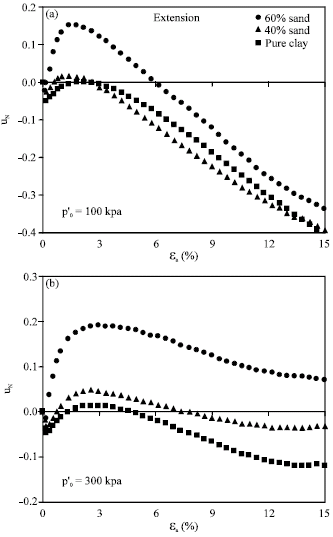
Pore pressure-strain characteristics: For a fundamental understanding of the undrained behavior of sand-clay mixtures, it is prudent to observe the pore pressure generation pattern in the mixtures. Figure 6 and 7 compare normalized pore pressure, uN (pore pressure normalized to initial confining stress), in terms of axial strain for all mixtures under compression and extension monotonic loading paths, respectively, at different confining stresses.
 | |
 | |
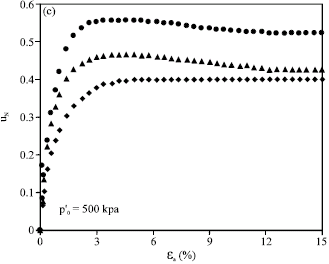 | |
| Fig. 6: | Variation of pore pressure in sand-clay mixtures under a triaxial compression loading path |
As shown, regardless of the loading path and initial confining stress, pore pressure generally increases with sand content, so that uN is highest for the mixture containing 60% sand and lowest for pure clay. The difference in uN is more pronounced at higher confining stresses (Fig. 6c, 7c). The reason behind this behavior can simply be explained: since the compressibility of the clayey matrix is greater than for individual grains, all of the specimen deformations take place in the clay. Hence, during strain-controlled loading, the clayey matrix of the specimens containing more aggregate experiences more deformation for the same strain level, directly leading to more pore pressure generation. Similar observations were made by Jafari and Shafiee (2004) from the strain-controlled compression monotonic triaxial tests on sand-fat clay and gravel-fat clay mixtures. If one assumes that all of the specimen deformations occur homogeneously in the clayey matrix of the mixtures and in-contact grains are not sufficient to form a granular skeleton that can deform, then all of the deformations take place in the clayey matrix. In this case, the strain in the clayey matrix, called effective axial strain, εeff, can be defined as (Jafari and Shafiee, 2004):
(1) |
where, c is the percent of volumetric clay. Hence, if pore pressure is compared with εeff, it is anticipated that the direct effect of sand volume will be eliminated and the uN versus εeff curves for different specimens will coincide.
Figure 8 compares pore pressure versus effective axial strain in compression tests. The figure indicates that, when pore pressure is plotted against effective axial strain, the curves tend to converge (compare with the curves in Fig. 6), particularly in low strain levels, but do not coincide. This means that the assumption of a uniform field of deformation in the clayey matrix is no longer valid and coarse particles floating in a fine matrix can induce a non-uniform field of density and consequently, deformation in the fine matrix. This was previously addressed by Fragaszy et al. (1992) for sandy gravels containing oversized particles and by Jafari and Shafiee (2004) for cohesive materials containing aggregates.
It is interesting to note that, in extension tests (Fig. 7), negative pore pressure develops at the beginning of the test. The phenomenon may be attributed to the elastic response of the compacted materials to the reduction of the deviator and mean stress. The range of axial strains, where negative pore pressure develops, decreases with sand content. In addition, regardless of the loading path and initial confining stress, all specimens more or less exhibit a peak in pore pressure that is an indication of dilative behavior (Fig. 6, 7). The dilative behavior is more evident in extension than compression tests and when sand content is raised, particularly at a low confining stress (100 kPa).
 | |
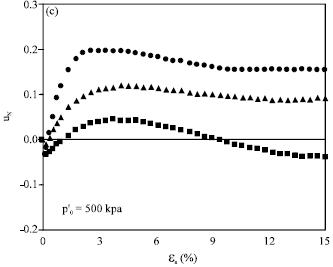 | |
| Fig. 7: | Variation of pore pressure in sand-clay mixtures under a triaxial extension loading path |
The axial strain to the peak decreases with sand content, however, the peak tends to migrate to higher strain levels with an increase in initial confining stress.
 | |
| Fig. 8: | Pore pressure in terms of effective strain in sand-clay mixtures under a triaxial compression loading path |
The test results presented in Fig. 2 and 6 reveal that both deviator stress and pore pressure increase with sand content.
 | |
| Fig. 9: | Variation of pore pressure parameter, A, in sand-clay mixtures under different initial confining stresses |
Hence, the pore pressure parameter, A, can be regarded as a suitable parameter for an appropriate description of the undrained behavior of compacted sand-clay mixtures.
 | |
 | |
| Fig. 10: | Pore pressure parameter at failure, Af, in terms of sand content under (a) compression and (b) extension |
In triaxial tests, A is expressed as follows (Skempton and Bishop, 1954):
(2) |
where, u is pore pressure. As shown in Fig. 9, regardless of initial confining stress, A decreases generally with sand content. Thus, A is lowest for the mixture containing 60% sand and highest for pure clay.
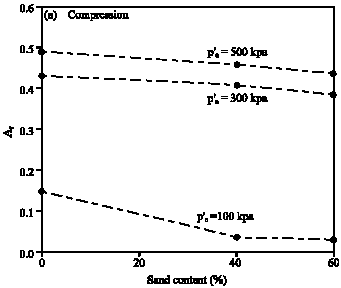
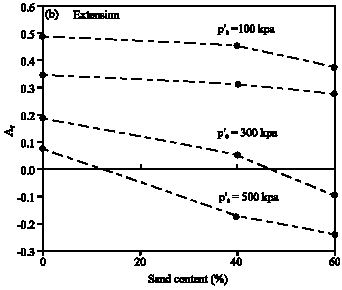
Figure 10 also displays the pore pressure parameter at failure, Af, versus sand content at different initial confining stresses. Af is calculated at an axial strain level of 15%. The Fig. 10 indicates that, for both types of loading path and regardless of initial confining stress, the value of Af decreases with sand content.
 | |
| Fig. 11: | Stress paths of sand-clay mixtures in compression tests: (a) pure clay, (b) 40% sand -60% clay and (c) 60% sand -40% clay |
In compression, the value of Af varies from 0.14 to 0.49 for pure clay and from 0.03 to 0.44 for the mixture containing 60% sand. In addition, the value of Af depends on the initial confining stress; in compression tests it increases with confining stress (Fig. 10a), while in extension tests it decreases with confining stress (Fig. 10b).
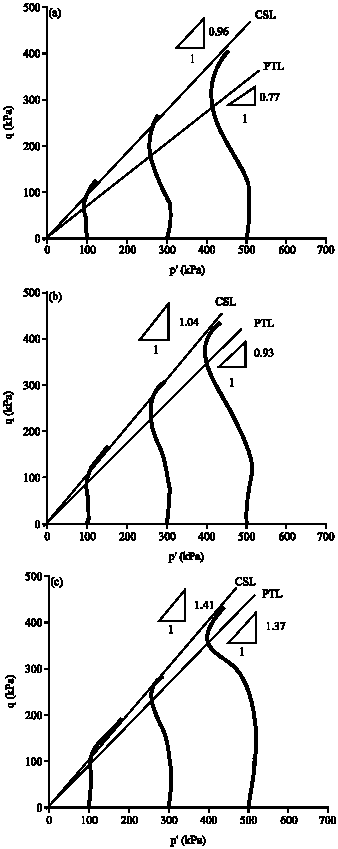
Effective stress path: The interesting features of the behavior of compacted sand-clay mixtures, shown by the stress-strain and pore pressure-strain curves, can be better represented by effective stress paths. The effective stress paths for all mixtures in compression and extension tests are presented in Fig. 11 and 12, respectively. The failure line is the locus of the deviator stress, q and mean effective stress,
at an axial strain of 15%. The phase transformation line, PTL (Ishihara et al., 1975), is where the behavior changes from contractive to dilative. These are superimposed on the figures. Since, in most cases (Fig. 2, 6, 7), a plateau in stress-strain and pore pressure-strain is reached, the failure line can be regarded as the critical state line, CSL (Roscoe et al., 1958). The CSL and PTL shown in these figures have been established by fitting the best line (passing from origin) to the q and p` data at critical state and phase transformation, respectively. As seen in Fig. 11 and 12, all specimens experience dilative behavior either on compression or extension loading paths prior to critical state. In addition, regardless of the loading path, the slopes of the CSL and PTL increase with sand content. In addition, the plots show that PTL approaches CSL when the sand content is raised.
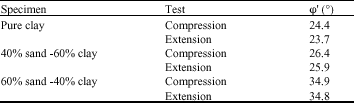
Table 2 also presents the values of the mobilized angle of shearing resistance at critical state (φ`) for sand-clay mixtures. The value of φ` is determined by the following equations (Roscoe and Burland, 1968):
(3) |
(4) |
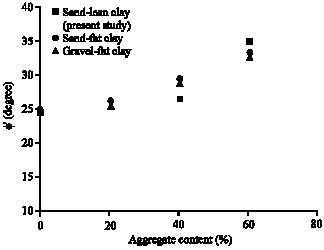
where, M is the slope of the CSL. As seen in Table 2, regardless of the loading path, φ` increases with sand content and the presence of 60% sand leads to an 11° increase in φ`. In addition, φ` in compression is slightly more than for extension for all mixtures. A comparison of the φ` of the sand-lean clay mixtures of this study with that of the aggregate-fat clay mixtures studied by Jafari and Shafiee (2008) shows that the plasticity of the clay does not affect φ` remarkably (Fig. 13).
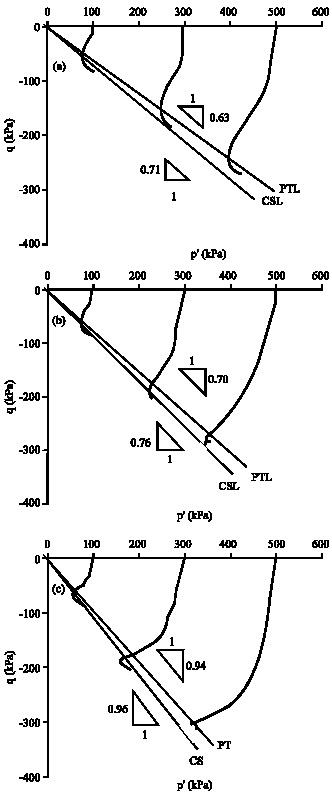 | |
| Fig. 12: | Stress paths of sand-clay mixtures in extension tests: (a) pure clay, (b) 40% sand -60% clay and (c) 60% sand -40% clay |
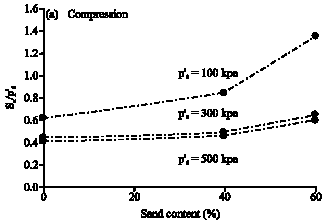
Deformational characteristics: Strain-dependent soil stiffness is an important pre-failure property that controls soil deformations. It is well known that the static deformation modulus is mainly governed by strain amplitude and initial confining stress (Yasuhara et al., 1982).
 | |
| Fig. 13: | Effect of the plasticity of clay on the angle of shearing resistance |
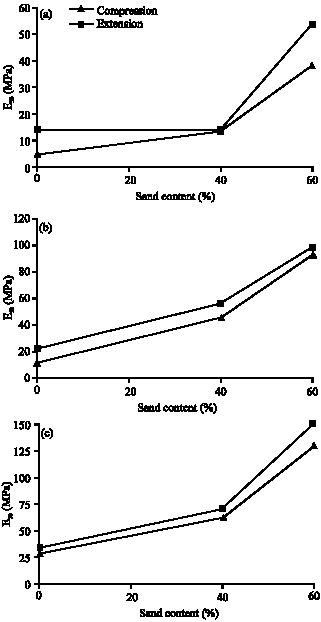 | |
| Fig. 14: | Effect of sand content on secant modulus at 50% shear strength |
| Table 2: | Angle of shearing resistance at critical state |
 | |
Herein, the secant modulus at 50% shear strength, E50, is used to compare the deformational properties of the mixtures. E50 is usually used in elastic-perfect plastic models of soil materials. It is an average stiffness corresponding to a stress state intermediate between the beginning and end of the test (Muir Wood, 2004). Variations of E50 with sand content at different initial confining stresses on both compression and extension loading paths are presented in Fig. 14. From these plots it is clear that E50 increases with sand content and initial confining stress in both compression and extension. As shown, the value of E50 in extension is more than that for compression. However, the difference does not depend on sand content.
CONCLUSION
An experimental study was performed on compacted mixtures of sand-clay at different initial confining stresses under triaxial compression and extension loading paths to thoroughly investigate the various aspects of the undrained behavior of the mixtures. The following conclusions may be drawn based on this experimental study:
| • | The undrained shear strength in compression, Suc, increases with sand content, particularly when the sand content reaches as high as 60% and the initial confining stress is low. On the other hand, undrained shear strength in extension, Su, gradually increases with sand content. This would increase the extent of the undrained shear strength anisotropy (Sue/Suc) with sand content. In addition, Su in extension is less than in compression at an identical sand content. |
| • | Plasticity of the clay and initial confining stress affect the undrained shear strength. It can be shown that Su decreases when the plasticity of the clay increases. The effect of clay plasticity on Su is more evident when the aggregate content is raised. The shear strength normalized to the initial confining stress, Su/p`0, depends on confining stress and decreases with confining stress in both compression and extension loading. The rate of decrease in Su/p`0 with confining stress increases with sand content in compression, however, the rate is nearly identical for all mixtures in extension. It is also found that the tested materials are overconsolidated, as demonstrated by the fact that Su/p`0 depends on the initial confining stress. |
| • | An increase in sand content causes more deformation of the clayey matrix at the same strain level, leading to more pore pressure generation in compression and extension. Even if pore pressure is compared with the same strain level in clay, it still increases with sand content. This shows the non-uniformity of the deformation field in the clayey matrix of the mixture. |
| • | Negative pore pressure develops in extension at the beginning of the test. The range of axial strain, where negative pore pressure develops, decreases with sand content. In addition, all the specimens more or less exhibit dilative behavior. The dilative behavior is more evident in extension than in compression and when the sand content is raised, particularly at low confining stresses. The axial strain to the peak in pore pressure response decreases with sand content, however, the peak tends to migrate to higher strain levels with an increase in initial confining stress. |
| • | The pore pressure parameter at failure, Af (pore pressure divided by deviator stress at failure) decreases with sand content in compression and extension. The value of Af depends upon the initial confining stress; in compression it increases with confining stress, while in extension it decreases. |
| • | The slopes of the CSL and PTL in the p`-q plane (where p` and q are mean and deviator stress, respectively) increase with sand content. The PTL approaches the CSL when sand content is raised. In addition, the mobilized angle of shearing resistance at critical state increases with sand content, however, its value in compression is slightly more than in extension. |
| • | The secant modulus at 50% shear strength, E50, increases with sand content and initial confining stress in both compression and extension. The value of E50 in extension is more than that for compression. |
REFERENCES
- Abichou, T., C.H. Benson and T.B. Edil, 2002. Micro-structure and hydraulic conductivity of simulated sand-bentonite mixtures. Clays Clay Minerals, 50: 537-545.
Direct Link - Chapuis, R.P., 1990. Sand-bentonite liners: Predicting permeability from laboratory tests. Canadian Geotech. J., 27: 47-57.
CrossRef - Chandler, R.J., 1988. The In-situ Measurement of the Undrained Shear Strength of Clays Using the Field Vane. In: Vane Shear Strength Testing in Soils: Field and Laboratory Studies, Richard, A.F. (Ed.). ASTM International, Philadelphia, PA., USA., ISBN-13: 9780803111882, pp: 13-44.
Direct Link - Duncan, J.M. and H.B. Seed, 1966. Strength variation along failure surface in clay. J. Soil Mech. Foundat. Division ASCE., 92: 81-104.
Direct Link - Fragaszy, R.J., J. Su, F. Siddiqi and L.H. Carlton, 1992. Modeling strength of sandy gravel. J. Geotech. Eng., 118: 920-935.
CrossRef - Ishihara, K., F. Tatsuoka and S. Yasuda, 1975. Undrained deformation and liquefaction of sand under cyclic stresses. Soils Foundations, 15: 19-44.
Direct Link - Jafari, M.K. and A. Shafiee, 2004. Mechanical behavior of compacted composite clays. Can. Geotech. J., 41: 1152-1167.
CrossRefDirect Link - Ladd, R.S., 1978. Preparing test specimens using undercompaction. Geotech. Testing J., 1: 39-49.
CrossRef - Muir Wood, D. and G. Kumar, 2000. Experimental observations of behaviour of heterogeneous soils. Mech. Cohesive-Frictional Mater., 5: 373-398.
CrossRefDirect Link - Muir Wood, D., 2004. Geotechnical modeling. 1st Edn. Spon Press, New York, ISBN: 0-419-23730-5.
Direct Link - Pandian, N.S., T.S. Nagaraj and P.S.R.N. Raju, 1995. Permeability and compressibility behavior of bentonite-sand/soil mixes. Geotech. Testing J., 18: 86-93.
CrossRef - Prakasha, K.S. and V.S. Chandrasekaran, 2005. Behavior of marine sand-clay mixtures under static and cyclic triaxial shear. J. Geotech. Geoenviron. Eng., 131: 213-222.
CrossRef - Roscoe, K.H., A.N. Schofield and C.P. Wroth, 1958. On the yielding of soils. Géotechnique, 8: 22-53.
Direct Link - Roscoe, K.H. and J.B. Burland, 1968. On the Generalized Stress-Strain Behaviour of Wet Clay. In: Engineering Plasticity, Heyman, J. and F.A. Leckie (Eds.). Cambridge University Press, Cambridge UK., pp: 535-609.
Direct Link - Skempton, A.W. and A.W. Bishop, 1954. Soils. In: Chapter X of Building Materials. Reiner, M. (Ed.). North Holland Publ. Co., Amsterdam, pp: 417-482.
Direct Link - Vallejo, L.E. and R. Mawby, 2000. Porosity influence on the shear strength of granular material-clay mixtures. Eng. Geol., 58: 125-136.
CrossRef - Yasuhara, K., T. Yamanouchi and K. Hirao, 1982. Cyclic strength and deformation of normally consolidated clay. Soils Foundations, 22: 77-91.
Direct Link - Yin, J.H., 1999. Properties and behavior of Hong Kong marine deposits with different clay contents. Can. Geotech. J., 36: 1085-1095.
CrossRefDirect Link