
S. Ameneh Sajjadi
Department of Meteorology, Islamic Azad University, Rasht Branch, Rasht, Iran
Journal of Applied Sciences
Year: 2008 | Volume: 8 | Issue: 7 | Page No.: 1299-1304


ABSTRACT
The study of Precipitable Water (PW) and determining the cloud seeding threshold are of great importance in reducing the considerable cost of unsuccessful seeding or over- seeding which well result in a decrease in rainfall potentiality. The present study was carried out within four-year period covering from 2000-2003 where the amount of rainfall in North-Western Iran (Tabriz) was recorded by precipitation stations. PW was calculated using the data obtained through radiosonde, thermodynamic charts and MODIS satellite. Using the curve and upon choosing the fittest index PW as independent variable and the rainfall average precipitation (P) as dependent variable, from among the PW, the suitable cloud seeding threshold was estimated. The thresholds obtained through MODIS and radiosonde for cloud seeding and PW were compared across 21 cases. The two methods employed showed high correlation. The thresholds obtained through MODIS in Tabriz was 7 mm, respectively, while the thresholds obtained through radiosonde on the same days for PW was 9 mm in Tabriz. In general, the amount of PW obtained through radiosonde proved to be greater than those achieved through MODIS. It is mainly due to the fact that the clouds` build up time and satellite picturing were not synchronous; moreover, the MODIS had higher sensitivity to the back scattering of the infrared waves by heavy clouds and at the same time and the low sensitivity in fogy condition on earth.
PDF Abstract XML References Citation
How to cite this article
S. Ameneh Sajjadi, 2008. The Precipitable Water and Determination of Cloud Seeding Threshold Through Thermodynamic Graphs and MODIS Satellite in Tabriz. Journal of Applied Sciences, 8: 1299-1304.
DOI: 10.3923/jas.2008.1299.1304
URL: https://scialert.net/abstract/?doi=jas.2008.1299.1304
DOI: 10.3923/jas.2008.1299.1304
URL: https://scialert.net/abstract/?doi=jas.2008.1299.1304
INTRODUCTION
The Precipitable Water (PW) is usually determined, by radar or satellite. Iran does not enjoy the technology and has to make use of other methods. The method discussed throughout the study, employed in different cloud seeding projects, was to secure the project success and to reduce the costs as regards different geographical regions. In this study, the thermodynamic indices were compared against the actual precipitation (P)obtained through field stations and satellite images to achieve a reliable cloud seeding threshold model.
In the convective cloud seeding projects (PACE), the P augmentation for crops experiments, carried out successfully by Czys and Scott (1993). The PW indices and buoyancy potential in 500 millibar were determined as suitable factors in cloud seeding and the PW for 26 mm was found to be the optimal P threshold in conducting convective cloud seeding activities. Simoenov and Georgiev (2003) computed the instability indices through studying sever wind/hail storm over Sofia, Bulgaria to obtain the cloud seeding threshold and hail suppression. In this study the CAPE was found to be 3785 J kg–1, the vertical wind velocity of 21.9 m sec–1 and PW of 12.9 J kg–1. Manzato and Morgan (2003) studies the regional thunderstorms over Venice, Italy during a 7 year period whereby they found the most suitable forecast indices of thunderstorms and their strength to be the vertical wind velocity, PW, CAPE and KI (K Index). Krauss and Santos (2004) obtained some instability indices through performing hail suppression activities over Alberta, Canada, employing the cloud seeding operations on hailstorms for 82 days in the summers of 2001 and 2002. The indices were as follows: the average PW (18.8 mm), Shulter index (-1.3°C), set of sets index (TT) (54°C), vertical index (-3) and convective available potential energy (781 J kg–1). Costa et al. (2001) calculated the instability indices for tornado, hail storm and heavy rainfall in northern Italy and introduced the suitable indices to identify the rainfalls. Platnich et al. (2003) studied the clouds’ temperature qualities, microphysical parameters and PW through the 5 min data obtained from the MODIS satellite over South American coast. Gao and Kaufman (2003) reviewing the methods used in finding the PW through MODIS satellite, came to the conclusion that the MODIS is capable of providing global coverage. MODIS is the first space device used for recovering general P. The quality control is also performed for both geographical and climatological studies, as well as statistical analysis. Gao and Goetz (1990) studied the PW through remote instrument. King and Bock (2003) while emphasizing the importance of satellite in research, introduced the band limits of 129 for studying the atmospheric characteristics like cloudage, the vertical profile of atmosphere, aerosol and the general PW and managed to find two different patterns of PW in polar clouds.
This research was performed within 4 years (2000-2003) where the PW, as registered by P stations, were determined and gauged through radio sound of aerological stations functioning over Tabriz, thermodynamic diagrams and the factors governing the P. Then, using the same data and period through MODIS satellite and selecting the fittest variables, ground P and PW, the suitable threshold for cloud seeding was estimated.
MATERIALS AND METHODS
The areas under study was Tabriz’s meteorological stations (synoptic stations of upper atmosphere information and ground P). The amount of PW was calculated by radio sound information (with Skew-T diagram) and Eq. 1 on the rainy days in 2000-2003.
The increase in convectional movements and heat transfer follows the increase in age and thickness of clouds. The upward movements of the cloud drops by the base are slower than, but they take more speed due to increase in instability produced by the release of the latent heat of drops condensation as the cloud thickness increases and so does the PW (Ragers and Yau, 1996). The upward movements and drops growth, as shown in Fig. 1 and 2, reach the maximum in 3/4 of the cloud base. The drops, around the peak and brims of cloud, then vaporize as the surrounding dry and cold air intermingle, in other words, the process causes the temperature decrease rapidly and consequently, the floating forces and upward movement speed decrease as well.
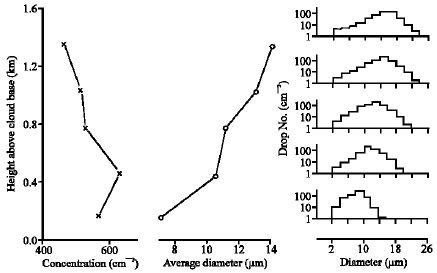 | |
| Fig. 1: | Differences in density and size of droplets by altitude and their spectrums in each altitude Ragers and Yau, 1996) |
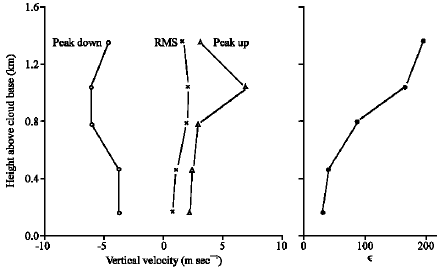 | |
| Fig. 2: | Maximum differences in upward and downward movements and the average amount of square root of vertical velocity and the turbulent energy differences based on the altitude from the cloud base (Ragers and Yau, 1996) |
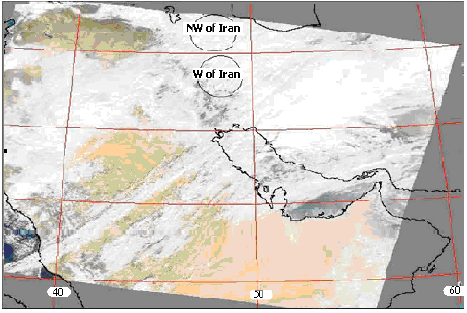 | |
| Fig. 3: | Cloud coverage of the zone under the study obtained in Jan the 11th, 2003 |
Moreover,the amount of water in clouds decreases as the drops vaporize and the air gets cold in the cloud peak when the dry and cold airs intermingle. In case it happens, the cloud temperature decreases sharply and the upward movement, too, become downward gradually. To determine the cloud seeding threshold, the Figures employed enjoys the most suitable fitness of the variables and correlation coefficients. The information in the Figures show the cloud seeding threshold of the region where the P recorded by the stations remains stable while the PW are increased, also, as shown in the Fig. 5, the clouds’ age and thickness are not suitable for seeding. At this stage, any attempt for cloud seeding would result in decrease of P potential, but if the indices exceed the threshold, the P increases, which can be claimed to be the right index for cloud seeding.
By definition, the condensed water in a humid air column is referred to as PW, as shown on centimeter or millimeter scale. Manzato (2003) has used the following simple relation to calculate the PW as an index for the prediction of conversion activity, the Eq. 1:
| (1) |
where, r is the average amount of mixing between the pressure levels of the cloud base and peak.
To calculate the PW through the Skew-T the following is done.
MODIS is one of the five instruments in TERA satellite. Water vapor (W) in atmosphere has different absorption proportion on the MODIS channels passages in the vicinity of 0.935, 0.94 and 0.905 μm consequently, these three channels have different sensitivities to the water vapor in similar atmospheric conditions. The average W is obtained by the Eq. 2.
| (2) |
Where:
| w1, w2 and w3 | = | The amounts of water vapor in channels 0.935, 0.94 and 0.915 μm |
| F1, F2 and F3 | = | Functions of weight |
The satellite pictures of MODIS evaluator in the region and the dates stated and the information related to the PW were obtained. The data of PW by the MODIS included the vertical profile of water vapor present in the atmosphere through using the infrared algorithm during the day. Its position dissociation power is one kilometer during the day which is obtained after receiving the temperature bands data and applying it to the estimation model of output PW. A model of the pictures related to the cloud coverage and PW obtained from the region under the study is presented. The required output was obtained as Fig. 3 (where the weather condition is simply indicative of the presence of cirrus clouds and a jet from the South West). In the West of the country and within the zone 2 (North Western of Iran-Tabriz) includes a cold front along with the cirrus and cumulonimbus which are dark grey in color. Then the temperature band enter the estimation model of PW. The obtained output in pictorial mode is grey in context. In case a color picture is needed in distance evaluation software the favorite color codes are defined for it.
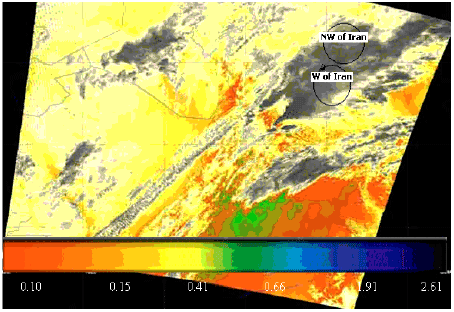 | |
| Fig. 4: | Precipitable Water (PW) obtained of the zone under the study by MODIS in Jan the 11th, 2003 |
As an example the average amount of PW in ranking (Fig. 4) based on centimeter and geographical region is clarified which the number of average PW for example was obtained in the present pixels in 2002/1/11.
The output of PW is in centimeter and in the calculations is in millimeter.
Output:
date ; 2002/1/11 code; 38.8142 47.4940 PW; 2.66
date ; 2002/1/11 code; 38.7879 47.6098 PW; 1.59
date ; 2002/1/11 code; 38.7574 47.7439 PW; 1.62
date ; 2002/1/11 code; 38.7263 47.8796 PW; 1.71
.
.
.
and finally the average of PW for all points in 2002/1/11 is 7 mm.
RESULTS AND DISCUSSION
After obtaining the amounts of PW by the radio sound information and MODIS in the rainy days (21 cases) and the amount of ground P on these days by PW fitting index on the average of P, the appropriate threshold of cloud seeding was obtained in each case. The amounts for PW and the average of P were calculated as 25.50 and 75%. Using these amounts, it can be calculated that the index amount is indicative of how much the downpour of the different regions are.
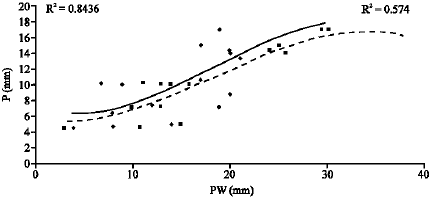
The best PW fitting obtained by radio sound and MODIS on the average of P in Tabriz (21 cases of studies) are shown in Fig. 5, where the broken line (R2 = 0.84) is the best fitting obtained by the radio sound and the curve of dark line (R2 = 0.75) are the best fitting of P and PW obtained by the MODIS.
According to Fig. 5, before the PW approximately reaches 9 mm cloud seeding is probably not useful, because in amounts under this, the P is fixed and can be indicative of lowness of the durability and thickness of the cloud. Consequently the cloud seeding may ultimately cause the potential decrease of the P. For this reason, the condensation nucleus and the number of cloud droplets increases and their diameter is reduced and finally they can not fall. With the increase in the durability, thickness and PW of the cloud as it is observed, the amount of P in the stations is increased harmoniously. As the average P of the stations is considered, it can be concluded that: when the PW is more than 9 mm and cloud seeding is done, it can cause an increase in P. This causes the condensation nucleuses and cloud droplets to increase. Also due to the enough wetness, the drops are increased and can fall and the P increases also. Therefore, it can be concluded that the appropriate threshold for cloud seeding of the index of PW in Tabriz was almost 9 mm and the fitting curve shows that when the P of the cloud is more than 31 mm, the average of rainfall is fixed and about 16 mm. As it was stated before, due to the inflow of cold and dry air into 3/4 of cloud base, the amount of P decreases. If the vertical growth of the cloud is high, the amount of P increases, too; but in this case the effect of inflow of cold and dry is higher too. This happens because the cloud has grown up to the higher levels which is dry and colder. Some physical processes, like inflow of cold and dry air, are not considered in thermodynamic calculation (Ragers and Yau, 1996).
 | |
| Fig. 5: | Precipitable Water (PW) fitting obtained by radio sound and MODIS for precipitation average (P) in Tabriz, the broken line curve (R2 = 0.84), the best fitting of PW obtained by audio sound and the dark line curve (R2 = 0.57), (R2 = 0.85) is the best fitting of PW by MODIS |
| Table 1: | The amount of precipitable water (PW, mm) by Skew-T diagram and the average precipitation (P, mm) in Tabriz of specific percentages |
 | |
| Table 2: | The relationship between the precipitable water (PW, mm) by Skew-T diagram and probability of different precipitations (P, mm) in Tabriz |
 | |
| Table 3: | The amount of precipitable water (PW,mm) by MODIS and the average precipitation (P, mm) in Tabriz for specific percentages |
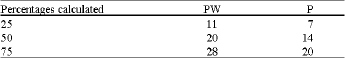 | |
| Table 4: | The relationship between the precipitable water (PW, mm) by MODIS and probability of different precipitations (P, mm) in Tabriz |
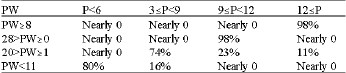 | |
It is probably due to the same reason that the curve shows an increase in PW, but the amount of P has remained fixed. Because of the inflow, the amount of cloud P is lower than the amount calculated and this has led to a stop in the increase of curve and the P remains fixed. To study the probability of different P the amounts of 25.50 and 75% of the P and average P are shown in the Fig. 3. The first quarter of PW and the average of P are obtained as 9 and 6 mm, respectively. It means that in an ideal situation, when the PW is lower than 9 mm, the average of P should be lower than 5 mm. It is very unlikely to have such an ideal situation. In order to estimate the amount of P through the amount of PW, Table 1 and 2 is given and as it is clear when the amount of P is over 17 mm, a downpour of 12 mm is expected. As it is expected, a reduction in PW the probability of lower P increases and the probability of higher P reduces. These studies which are in concordance with the work of Manzato (2003) clearly show that PW is a good one for the estimation of downpour.
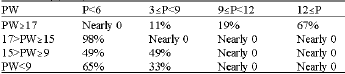
As it is shown in Fig. 5, Table 3 and 4, the appropriate threshold for cloud seeding of the index of PW measured by the MODIS in (NW of Iran) Tabriz based on the curve, the best fitting in Fig. 5 is almost 7 mm. Based on Table 3, the amount of first quarter of PW and average P are 11 and 7 mm, respectively. As it is clear from Table 4 when the PW is 28 mm, the amount of expected P is 20 mm. In Fig. 5, the output information related to the measuring of PW by radio sound and MODIS are compared. The broken line curve where R2 = 0.84 is related to the best fitting of PW by the radio sound and the dark line curve where R2 = 0.57 is related to the best fitting of PW by MODIS diagrams.
CONCLUSION
Generally speaking, there are some reasons for the differences between the two methods. The information from the PW by the MODIS are obtained in passing by the region and in limited dates when complete P may not be the same. In foggy weather when the surface reflection is higher, the probability of error is also higher. Data by MODIS is related to the water vapor absorption in thick clouds and its photography has some chronological delay in comparison to the data by radio sound, on the other hand, MODIS itself shows a 5 to 15% of error which is higher than the data by the radio sound. The greatest source of error is due to the uncertainty of the spectrum of reflections on the surface targets and the unclear amount of fog (Fraster and Kaufman, 2004).
The amounts of PW in Tabriz was obtained by MODIS 7 mm and in the same period the data by the radio sounds was 9 mm in Tabriz, respectively. The proportion of P obtained from the PW in the same period in Tabriz were 16 by Skew-t and 14 by MODIS. The difference in the amounts obtained is due to some reasons: information by the PW in MODIS were obtained while passing the region and in limited dates when the cloud may not have enough thickness for the droplets to grow or have passed that stage, also in foggy weather there may be more errors. The information on water vapor absorption by MODIS in thick clouds is valid. Its photography has some time delay in comparison to radio sound information, on the other hand, there are unreliable estimations in MODIS output regarding the unclear reflection from target surfaces and the amount of fog.
REFERENCES
- Costa, S., P. Mezzasalma, V. Levizzani, P.P. Alberoni and S. Nanni, 2001. Deep convection over Northern Italy: Synoptic and thermodynamic analysis. J. Atmospheric Res., 56: 73-88.
CrossRefDirect Link - Czys, R.R. and R.W. Scott, 1993. A simple objective method used to forecast convective activity during the 1989 PACE cloud seeding experiment. J. Applied Meteor., 32: 996-1005.
Direct Link - Fraser, R.S. and Y.J. Kaufman, 1985. The relative importance of aerosol scattering and absorption in remote sensing. IEEE J. Geosci. Remote Sens., 23: 625-633.
CrossRefDirect Link - Gao, B.C. and H. Goetz, 1990. Column atmospheric water vapor and vegetation liquid water. J. Geophys. Res. Atmospheric, 959: 3549-3564.
Direct Link - Krauss, T.W. and J.R. Santos, 2004. Exploratory analysis of the effect of hail suppression operations on precipitation in Alberta. J. Atmospheric Res., 71: 35-50.
Direct Link - Manzato, A. and G. Morgan, 2003. Evaluating the sounding instability with the Lifted Parcel Theory. J. Atmospheric Res., 67-68: 455-473.
CrossRefDirect Link - Manzato, A., 2003. A climatology of instability indices derived from Friuli Venezia Giula soundings, using three different methods. J. Atmospheric Res., 68-67: 417-454.
CrossRefDirect Link - Platnich, S., M.D. King, S.A. Ackerman, W.P. Menzel, B.A. Baum, J.C. Riedi and R.A. Frey, 2003. The MODIS cloud products. Algorithms and examples from Terra. J. Geosci. Remote Sens., 41: 459-473.
Direct Link - Simoenov, P. and C.G. Georgiev, 2003. Severe wind/hail storms over Bulgaria in 1999-2001 period, synoptic and mesoscale factors for generation. J. Atmospheric Res., 67-68: 629-643.
Direct Link