
I. Aigbedion
Department of Physics/Geophysics, Ambrose Alli University, Ekpoma, Edo State, Nigeria
Journal of Applied Sciences
Year: 2007 | Volume: 7 | Issue: 5 | Page No.: 772-776


ABSTRACT
This study accounts for how permeability was modeled in a reservoir without core data in the Niger Delta, Nigeria by using five empirical approaches namely, Timur, Coates/Dumanoir, Tixier, Aigbedion and also a correlation generated from core data of a near by field. The five permeability results from the five approaches were used in building five different 3Dgeological models. Flow simulations was carried out for all the models to analyze their flow performance. The permeability distribution from the correlation generated from the near by field core data yielded a higher oil recovery.
PDF Abstract XML References Citation
How to cite this article
I. Aigbedion, 2007. A Case Study of Permeability Modeling and Reservoir Performance
in the Absence of Core Data in the Niger Delta, Nigeria. Journal of Applied Sciences, 7: 772-776.
DOI: 10.3923/jas.2007.772.776
URL: https://scialert.net/abstract/?doi=jas.2007.772.776
DOI: 10.3923/jas.2007.772.776
URL: https://scialert.net/abstract/?doi=jas.2007.772.776
INTRODUCTION
The permeability of a rock is one of the most important parameters necessary for effective reservoir characterization and management (Onyekonwu and Ekpoudom, 2004; Bloch, 1991). Therefore accurate knowledge of its distribution in the reservoir is critical to accurate production performance prediction. During primary depletion, areal variation of permeability influences oil recovery. Permeability measurements from cores are direct measurement of these properties. But a reservoir without core data is often associated with uncertainties as these properties have to be log derived.
Permeability of a formation is affected by factors such as porosity and pore space characteristics, types, amount and distribution of clay minerals, rock matrix composition and size of matrix grains (Balan and Mohaghegh, 1995).
Several researchers Osborne (2004), Timur (1968), Coates and Dumanoir (1981), Yao (2003) and Tixier (1949) have proposed models for permeability determination in an uncored reservoir using well logs. These models are based on correlation between permeability, porosity and irreducible water saturation. Irreducible water saturation being a function of the rock characteristics.
The work flow consists of petrophysical evaluation, permeability estimation, 3D geocelluar modeling, up scaling of fine grid models for flow simulation and dynamic modeling.
Case study: The case study presented here is from a field located onshore in the Niger Delta, Nigeria as shown in Fig. 1. The field was discovered in 1975 and has three hydrocarbon bearing reservoirs. Only one of these reservoirs is considered in this study.
 | |
| Fig. 1: | Map of Niger delta showing area of study |
The reservoir is drained by three wells all located at the eastern flank of the field. Deviation, Well surface locations, lithologic, porosity, saturation and property logs are available. Regular production test is performed on the wells, so a satisfactory historical production data, fluid data and pressure data is available.
The reservoir is the down thrown block of a compartmentalized reservoir characterized by unconsolidated sand of tertiary age with minor shale intercalations. The reservoir is capped by field wide correlatable shales and underlain by field wide correlatable shales. Based on paleobathymetric data the reservoir is deposited within the outer to inner neritic depositional system. The log reveal that it consists mainly of distributary channels.
The reservoir has a total net pay thickness of 69ft and an average porosity of 25%. The reservoir production performance indicates a strong aquifer support and a pressure drop of 9.98% (7.78% of initial pressure).
MATERIALS AND METHODS
The case study presented here is from a field located onshore in the Niger Delta, Nigeria. Several steps were taken before the permeability determination since it is dependent on other properties like porosity and water saturation, these properties are determined before it.
Wireline logs data are corrected for environmental effects due to bore hole size, temperature and salinity before use for this analysis.
Formation water resistivity (Rw) is calculated using two methods namely, the Rwa method and the Pickett crossplot method. The two methods were investigation since there was no measured connate water resistivity available for this study. After comparing the results obtained, the Pickett crossplot method is adopted for its consistency and ability to estimated the cementation factor, m.
Porosity estimated from the density log and compared with a quick look conductivity derived porosity curve. The effective porosity was further deduced by introducing the shale volume percentage into the density equation.
Water saturation (Sw) in the reservoir was calculated using the indonesisn equation. The model is chosen due to the heterolithic nature of the sand in some units. The model is then validated using Archies and Simandoux model to ensure consistency of results. The log analysis result in Fig. 2 shows that the reservoir consists dominantly of sand and minor shale.
Permeability estimation: A sensitivity study on the permeability was carried out to reduce uncertainties in log derived permeabilities. Five permeability correlation are used in the estimates.
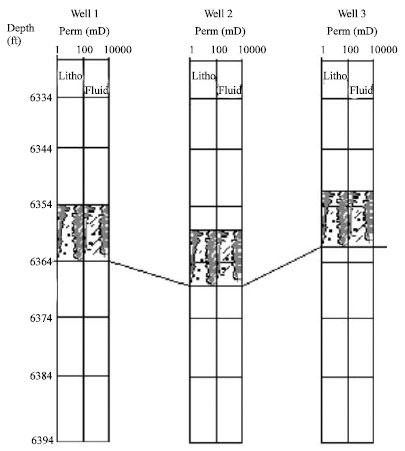 | |
| Fig. 2: | A log analysis result of the reservoir |
 | |
| Fig. 3: | Plot of permeability vs porosity generated from core data from a nearby field |
Model 1: Timur: Timur, 1968 proposed an equation for permeability in the form,
And for residue water saturation:
Model 2: Coates and Dumanoir: Coates and Dumanoir, 1981 proposed the following formular for permeability,
Model 3: Tixier; Tixier, 1949 a simple model for permeability given by,
Model 4: Aigbedion: Aigbedion, 2004 proposed the correlation,
For permeability determination based on studies of core samples from certain oil fields in the Niger Delta, Nigeria.
Model 5: Near by field core data: Porosity and permeability observed on available core samples from a nearby field were plotted. Based on the highest correlation coefficient as shown in Fig. 3, a relationship between porosity and permeability is represented by the equation:
RESULTS AND DISCUSSION
These five empirical correlations are used in estimating permeability in the reservoir. The results in Fig. 4 and 5 shows Tixier, Timur and Coates/Dumanoir model to have higher permeability estimates compared to Aigbedion and the near by field models. The permeability wells for the three wells shows Timur, Tixier, Coates/Dumanoir and Aigbedion model to be erratic. However the nearby field model is consistent in all the well as a against the result of Osborne (2004). Five geologic model that honour the log data well surface location, deviation as well as seismic data (surface and fault polygon) were built. The fine grid model contains 117x57x5 cells in the X, Y and Z directions, respectively. The same grid was used for all the models.
Petrophysical properties such as porosity, net gross, water saturation and permeability are assigned and are conditioned to the facies using sequential Gaussian simulation techniques. To incorporate the five permeability estimate five geological models were built, each of the models had the same porosity, net gross and water saturation but a different permeability which confirmed the result of Yao (2003).
The fine grid with associated properties were upscaled to 53x33x5 orthogonal grid blocks for dynamic modeling. The total number of active grid cell general is 8745 for each of the models. The same grid dimensions were used for the five models. Volume average upscaling is used on volume related properties like porosity and net-gross. permeability is upscaled as a flow based tensor. The upscaled grid was found to be optimum in terms of complexity and functionality as it captured most of the geologic features. The five models were exported for flow simulation.
Reservoir simulation was performed using a black oil simulator. Simulation runs for the five models were made with the same data set. Data checking and initialization was done checking hydrocarbon volumes for comparison with static model estimates. Initial volumes were modeled within initial 2% of the actual. There is no oil water contact in the reservoir as all the wells saw an oil-down- to (ODT). Relying on the pre simulation classical material balance reports the acquifer was modeled as an edge acquifer.
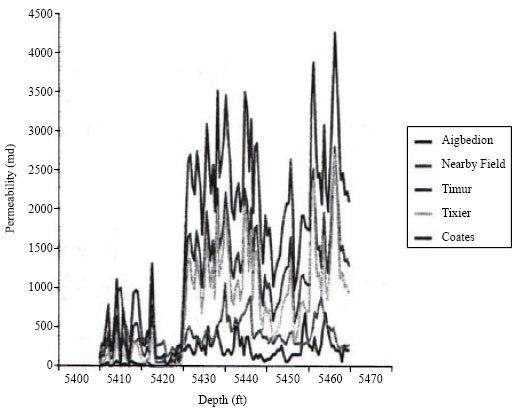 | |
| Fig. 4: | Plot of Permeability Models Vs Depth for Well 1 |
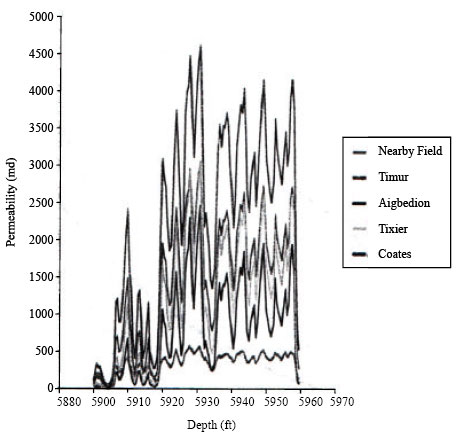 | |
| Fig. 5: | Plot of Permeability Models Vs Depth for Well 2 |
The simulation results show the same initial recoveries for the five permeability models. Later the curves separate from each other with the nearby field permeability model having the highest recovery. From this research we find higher calculated transmitivities and high permeability distribution within the model. Tixier, Coates/Dumanoir and Aigbedion models have similar recoveries while the Timur (1968) permeability model has the least recovery. The results show the benefits of integrating different models in the absence of core data from the field of study to a nearby field core data in developing a robust conceptual reservoir geological model.
REFERENCES
- Bloch, S., 1991. Empirical prediction of porosity and permeability in sandstones. AAPG Bull., 75: 1145-1160.
Direct Link
ADEBAYO VICTORIA O. Reply
Innovating work, good job done.