
Awni T. Batayneh
Department of Research and Studies, Faculty of Graduate Studies and Scientific Research, Al-Baqa Applied university, Jordan
Journal of Applied Sciences
Year: 2005 | Volume: 5 | Issue: 1 | Page No.: 52-59


ABSTRACT
The detection of organic contaminants such as light non-aqueous phase liquid (LNAPL) in the subsurface using geophysical methods, particularly electrical resistivity methods has been the subject of considerable interest in recent years. Their detection is based principally upon the electrical properties of the hydrocarbons. During 2002, direct current resistivity data were collected with the Iris Syscal R2 resistivity instrument at the location of Al Amiriyya fuel station site, Jordan. The objective of this study was to evaluate the resolution of resistivity techniques in detecting and locating anomalies of organic contamination. Resistivity measurements were carried out utilizing the Wenner and dipole-dipole array configurations in order to achieve good vertical and lateral resistivity distributions for the investigated site. The interpretations obtained from 2D-modelling of the field data show a highly conductive region in areas with LNAPL contamination. This explanation was supported by the presence of hydrocarbon sheens floated on the surface of water filling the subsidence feature and by excavation works. Correlation between field results obtained shows that the dipole-dipole array is the most reliable since it showed details over the fuel station site that were poorly indicated by the Wenner array.
PDF Abstract XML References Citation
How to cite this article
Awni T. Batayneh, 2005. 2D Electrical Imaging of an LNAPL Contamination, Al Amiriyya Fuel Station, Jordan. Journal of Applied Sciences, 5: 52-59.
DOI: 10.3923/jas.2005.52.59
URL: https://scialert.net/abstract/?doi=jas.2005.52.59
DOI: 10.3923/jas.2005.52.59
URL: https://scialert.net/abstract/?doi=jas.2005.52.59
INTRODUCTION
Geophysical investigations used to characterize hydrocarbon spill sites have been based principally on electrical properties of the hydrocarbons. Short-term laboratory and controlled spill experiments using fresh hydrocarbon product support the model that organic contaminants generally have a high electrical resistivity on the order of 106 ohm-m and low relative electrical permittivity, between 2-3. However, many geophysical field investigations of light non-aqueous phase liquid (LNAPL) at numerous sites with aged contamination show, contrary to the controlled spill or laboratory results, that the LNAPL smear zone has a lower resistivity (higher conductivity) than the bulk formation. This is attributed to the changes of biochemical properties from electrically resistive to conductive behavior with time due to biodegradation[1-6].
Typical products of LNAPL biodegradation are acids and biosurfactants. Carbonic and organic acids are produced during LNAPL biodegradation[7-10]. These products increase conductivity directly by increasing the dissolved solids concentration and indirectly by promoting mineral dissolution[10].
Biosurfactants are produced by many genera of soil microorganisms during growth on non-aqueous phase liquid (NAPL). When present at concentrations above the critical micelle concentration, surfactants produce microemulsions of NAPL in water. Biosurfactants are produced by aerobic and anaerobic microorganisms[11,12]. Biosurfactants increase dissolved solids concentrations. Perhaps more importantly, emulsion of LNAPL resulting from biosurfactants could promote a change in conditions from LNAPL-wetted to water-wetted. This can increase the contact area between water and solids, providing more nutrients and promoting further biogeochemical changes.
In the present study, 2D electrical imaging surveys utilizing Wenner and dipole-dipole resistivity profiling techniques were performed at the Al Amiriyya fuel station site in which heavy weight tanker that was used to supply the station with fuel caused a major subsidence that is about 16 m long, 2 m wide and 40 cm deep (Fig. 1) at the eastern edges of five buried fuel tanks containing gasoline and kerosene. Low pressure at two gasoline pumps was reported by the owner of the fuel station. The underground pipes that link fuel tanks were probably damaged and resulted in fuel losses and leakages, yielding a subsurface NAPL contamination zone.
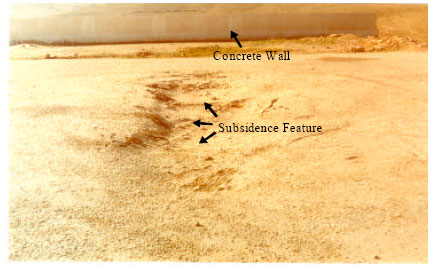 | |
| Fig. 1: | Photograph of the field site looking south showing the north-south subsidence feature |
Hence, it is important to locate and remediate such NAPL impacted sites. The direct current studies aimed to delineate the location of the buried cylindrical fuel tanks. The second goal of the study was to map the extent of possible contamination by hydrocarbon from the underground fuel tanks and to evaluate the use of geophysics as an environmental aid in studying the status of fuel station site in Jordan.
MATERIALS AND METHODS
Site description: The Al Amiriyya fuel station (Fig. 2a) is 48 km south of the capital Amman on the main highway that links north and central Jordan with the southern region. This station occupies an area approximately 65 by 65 m. The fuel tanks are made of iron and have cylindrical shape. Each cylindrical tank is 2.8 m in diameter, 9.5 m long, approximately 1.8 m deep and holds approximately 58 m3. The underground storage tanks have east-west alignment and are buried in a north-south trench 5 m deep and about 18 m length. For safety of the buried storage tanks against any surrounding conditions, the trenchs were filled during construction by fine sand. The fuel station is bounded on the east, west and south by 1 m high concrete wall.
The geology of the site is known to consist of 30 cm of asphalt at the surface. The underlying rock formation that outcrops around the investigated site is the Al-Hisa Phosphorite formation (Mastrichtain-Campanian in age) which is part of the Balqa Group[13]. Locally, the upper few meters of the formation are exposed and consists of mostly marl, marly limestone and phosphatic chert interbedded with chalk and chalky marl units at shallow depths. The formation is gently dipping (5-10°) toward the north. The prevailing weather conditions in the study area are arid to semi-arid. The average temperature exceeds 25°C during more than 250 days in the year, while the average annual amount of rainfall is about 100 mm.
Electrical prospecting: In March 2002, 2154 electrical measurements were made along six profiles (L1-6, Fig. 2b) across the area with a 2 m offset between adjacent profiles. Given the fact that there is no change in topography along the electrical survey lines, each line comprised of 32 stainless electrodes 2 m apart. The lines had north-south orientation as shown in Fig. 2b. Iris Syscal R2 resistivity equipment was used to cover a sum of 192 electrode positions applying both Wenner and dipole-dipole array configurations.
Wenner array: The Wenner array profiling method (Fig. 3a) incorporates two current electrodes A and B and two potential electrodes M and N arranged on a straight line with a constant distance (a) between the electrodes. In this case, a = 2 m and measurements were taken up to ten unit (a) spacings. The center point of the profile between electrodes M and N was defined as the point of measurement. Griffiths and Turnbull[14], Griffiths et al.[15] showed that the sensitivity plot for the Wenner array has almost horizontal contours beneath the center of the array. So, the Wenner array is relatively more sensitive to vertical changes than to horizontal changes in subsurface resistivity. Furthermore, they showed that the Wenner array has a moderate depth of investigation compared to the other arrays. The medium depth of investigation is approximately 0.5 times the (a) spacing used.
Dipole-dipole array: Dipole-dipole array configuration (Fig. 3b) incorporates two current electrodes A and B and two potential electrodes M and N arranged on a straight line. The spacing between both electrode pairs is (a). The first sequence of measurements is made with a value of 1 for the (n) between the A and M electrodes and the dipole separation (a) with a value of 2 m.
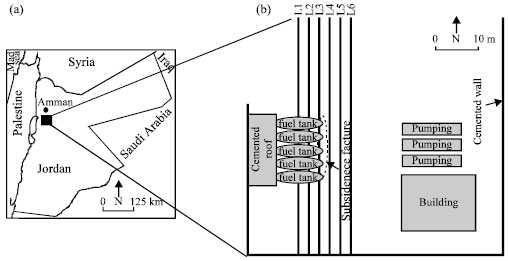 | |
| Fig. 2: | (a) Site map. (b) Plan showing underground storage fuel tanks and electrical survey design |
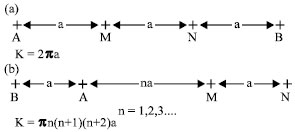 | |
| Fig. 3: | (a) Wenner resistivity array with its geometric factor. (b) Dipole-dipole resistivity array with its geometric factor |
The (a) spacing is kept fixed and the (n) factor is increased from 1 to 2 to 3 to 4 to … to 8 in order to increase the depth of penetration. In our case, a = 2 m and (n) separations were taken from 1 to 8. Edwards[16] shows that the highest sensitivity for the dipole-dipole array are located between the B-A dipole pair, as well as between the M-N pair. This means that this array is most sensitive to resistivity changes between the electrodes in each dipole pair. Thus the dipole-dipole array is very sensitive to horizontal changes than to vertical changes in subsurface resistivity. Furthermore, he shows that the dipole-dipole array has a shallower depth of investigation compared to the Wenner array. However, for 2D surveys, this array has a better horizontal data coverage and has slightly higher noise levels than the Wenner array. Figure 4 illustrates the pseudo-depth distribution of data points for the Wenner and dipole-dipole configurations used in this study, for a 32-electrode array.
RESULTS AND DISCUSSION
Analysis of the Wenner and dipole-dipole resistivity dataset along the measured profiles resulted in two-dimensional (2D) models. For convenient comparison between the 2D models for both Wenner and dipole-dipole arrays, models for the survey lines L1-3 (over underground storage fuel tanks) and models for the survey lines L4-6 (across the north-south extending subsidence feature) are presented in separate illustrations. Figure 5 and 6 show pseudo-section maps superimposed on posted resistivity values for the Wenner and dipole-dipole arrays, respectively. The resistivity values for the two different arrays were posted every other point (frequency of 2). The resistivity sections (Fig. 5 and 6) are constructed by examining the resistivity values of each profile and drawing inferences about the two-dimensional distribution of resistivities.
Wenner array results: The resistivity sections of the Wenner array along survey lines L1-3 obtained over the underground storage fuel tanks are shown in Fig. 5a. The resistivity profiles are affected by the chalk and chalky marl units at shallow depths and by the fine sediments filling the north-south trench. It shows apparent resistivity values in the range of 2 to 69 Ωm and the model sections extend to a depth of 10 m. An increase of apparent resistivity in the south is seen. In the model sections (Fig. 5a), the buried fuel tanks are shown as cylindrical conductive features with low resistivity of 2 to 5 Ωm between locations 20-34 m. The top of this conductive feature is about 1.7 m deep and extends 14 m in the north-south direction.
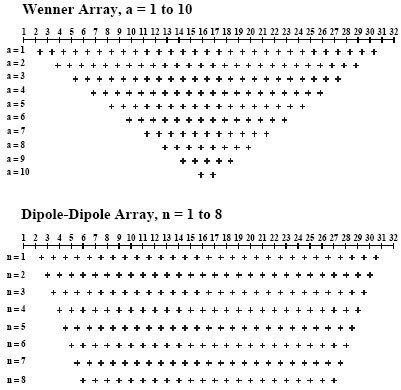 | |
| Fig. 4: | Pseudo-depth distribution of data points for Wenner and dipole-dipole array configurations |
The results obtained with the Wenner array suggest that this configuration is not useful for locating the edges of the fuel tanks structure. No hydrocarbon leakage was noticed along these survey lines.
Figure 5b shows the model sections applying Wenner array along survey lines L4-6 across the north-south extending subsidence feature. The anomalies obtained show an increase of apparent resistivity in the south as was the case for the Wenner array lines L1-3 (Fig. 5a). The prominent feature along survey lines L4-6 model sections (Fig. 5b) is the presence of a region of low resistivities (less than 15 Ωm) near the center of the pseudosections close to the surface and extending to depth. This conductive feature extends to the north direction following the slope of the subsurface formation. Given the fact that there is no change in topography along these survey lines, the conductive body at depth is most likely due to LNAPL contaminations. Survey lines L4 that were made over the north-south extending subsidence feature (Fig. 2b) shows zone of high resistivities (20 to 45 Ωm) near the center of the pseudosection (Fig. 5b) and extending to 1 m deep. This is attributed to fracture zone of subsidence feature.
Dipole-dipole array results: Figure 6a shows the model sections of the dipole-dipole electrical profiles L1-3 obtained over the underground fuel tanks with a penetration depth of about 5 m. Again, the resistivity of the model sections are affected by the chalk and chalky marl units at shallow depths and by the low sediments filling the north-south trench. It shows apparent resistivity values in the range of 2 to 65 Ωm, which are similar values, obtained along model sections of the Wenner array survey lines L1-3 (Fig. 5a). The dipole-dipole array shows consistently minimum resistivities over the trench structure near the center of the pseudosection and shows almost similar resistivities outside the trench. The gradient of the anomaly on the north side of the trench is more prominent than that on the south side. This may be due to more homogeneous rock formations in the north at greater depths. The fuel tanks structure causes a prominent low resistivity anomaly of 2 to 5 Ωm between locations 20-34 m, where the edges of the tanks structure are indicated best. The top of this conductive feature is shown to be at 1.7 m deep and extends 14 m long. No spill or leakage of hydrocarbon evidences was noticed along these survey lines.
Survey lines L4-6 model sections applying dipole-dipole array across the north-south extending subsidence feature are shown in Fig. 6b. The anomalies obtained show consistent low background resistivities of less than 15 Ωm near the center of the pseudosections close to the surface and extending to depth. This conductive feature extends to the north direction following the slope of the subsurface rocks and most likely due to LNAPL contaminations.
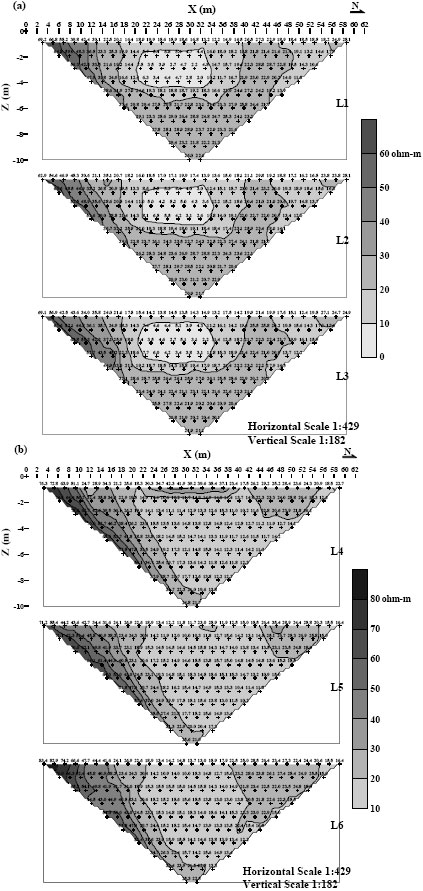 | |
| Fig. 5: | Pseudo-section maps for Wenner array superimposed on posted resistivity values for profiles L1-3 (a) and profiles L4-6 (b) |
 | |
| Fig. 6: | Pseudo-section maps for dipole-dipole array superimposed on posted resistivity values for profiles L1-3 (a) and profiles L4-6 (b) |
Model section of the electrical survey line L4 (Fig. 6b) that was made over the north-south extending subsidence feature (Fig. 2b) shows a high resistivity anomaly (20 to 45 Ωm) near the center of the model section extends to shallow depths. This is may be due to the fracture zone of subsidence feature.
Correlation of results: Comparison of the results obtained with the Wenner and dipole-dipole arrays (Fig. 5 and 6) reveal the resistivity variations in the region over the target. While the Wenner array measurements shows low resistivities near the center of the pseudosections, the edges of buried fuel tanks are poorly indicated and the anomalies are less obvious in the Wenner models. The results obtained with the dipole-dipole array suggest that this configuration proved helpful in mapping subsurface geology at shallow depths and most accurately reflects the known geometry of the subsurface structures. The edges and locations of the subsurface features can be reliably mapped at a field site where subsurface geology is not too complex and where changes in subsurface resistivity are associated with lithology[17,18]. The relatively poor resolution of the Wenner array models is attributed to the much reduced data density achieved when using the Wenner configuration, as compared to the dipole-dipole array (Fig. 4).
Direct current resistivity results were verified by simple experiment representing of pumping water at the subsidence feature area. Three cubic meter of water were pumped. This simple experiment revealed the presence of hydrocarbon sheens floated on the surface of water[19,20]. These findings have urged the requirement of excavation at the fuel tanks area. Excavation revealed damaged pipes linking the three underground gasoline fuel tanks. This was located under the subsidence feature area.
CONCLUSION
Electrical surveys, utilizing surface electrode arrays, were carried out over a fuel station site with the aim of evaluating the resolving capabilities of 2D electrical techniques in detecting and mapping the extent of LNAPL contamination induced by possibly damaged buried pipes linking gasoline and kerosene fuel tanks. Good vertical and lateral resistivity distribution over the investigated site was achieved in the 2D Wenner and dipole-dipole resistivity models. The direct current resistivity surveys allowed the determination of the specific resistivities down to a depth of about 10 m. The results show a contaminated zone corresponds to low resistivity (high conductivity) near the center of the pseudosections with apparent resistivities less than 15 Ωm close to the surface and extending to depth. Hydrocarbon sheens on the surface of water injected into the subsidence area followed by excavation works have confirmed results.
The resistivity, geometry and depth of burial of the underground fuel tanks were determined in good accuracy based on contrasting electrical properties of the fuel tanks that is iron metal in nature to that of surrounding materials. The underground fuel tanks correspond to low resistivities of 2 to 5 Ωm between locations 20-34 m. The top of the conductive feature is at 1.7 m depth and it is 14 m long.
By comparing field results obtained from the two different arrays, the dipole-dipole array proved to be the most reliable in our study. This technique is rapid and economical for mapping shallow subsurface sediments and most accurately reflects the geometry of the subsurface structures. The Wenner array yields ambiguous results. The Wenner array, particularly, does not appear to be suitable for locating the edges of the fuel tanks and may lead to erroneous results.
ACKNOWLEDGMENTS
The author wish to acknowledge the support received from the Natural Resources Authority of Jordan for contribution of Iris Syscal R2 resistivity equipment. The following employees of the Natural Resources Authority of Jordan are thanked for their aid in collection of field data: O. Jaradat, M. Abu Qa’ud, Y. Ainbossi, Kh. Mana’seh, S. Al Khateib and A. Al-Mazaiedeh. Facilities provided by the Department of Research and Studies, Faculty of Graduate Studies and Scientific Research, Al-Balqa’ Applied University are acknowledged.
REFERENCES
- Grumman, D. and J. Daniels, 1995. Experiments on the detection of organic contaminants in the vadose zone. J. Environ. Eng. Geophys., 1: 31-38.
Direct Link - Atekwana, E.A., W.A. Sauck and D.D. Werkema Jr., 2000. Investigations of geoelectrical signatures at a hydrocarbon contaminated site. J. Applied Geophys., 44: 167-180.
CrossRefDirect Link - Sauck, W.A., 2000. A model for the resistivity structure of LNAPL plumes and their environs in sandy sediments. J. Applied Geophys., 44: 151-165.
CrossRefDirect Link - Cozzarelli, I., R. Eganhouse and M. Baedecker, 1990. Transformation of monoaromatic hydrocarbons to organic acids in anoxic groundwater environment. Environ. Geol., 16: 135-141.
CrossRefDirect Link - Baedecker, M., I. Cozzarelli, R. Eganhouse, D. Siegel and P. Bennett, 1993. Crude oil in a shallow sand and gravel aquifer-III biogeochemical reactions and mass balance modeling in anoxic groundwater. Applied Geochem., 8: 569-586.
Direct Link - McInerney, M.J., M. Javaheri and D.P. Nagle Jr., 1990. Properties of the biosurfactant produced by Bacillus licheniformis strain JF-2. J. Ind. Microbiol. Biotechnol., 5: 95-101.
CrossRefDirect Link - Desai, J.D. and I.M. Banat, 1997. Microbial production of surfactants and their commercial potential. Microbiol. Mol. Biol. Rev., 61: 47-64.
PubMedDirect Link - Ramirez, A., W. Daily, A. Binley, D. La Brecque and D. Roelant, 1996. Detection of leaks in underground storage tanks using electrical resistance methods. J. Environ. Eng. Geophys., 1: 189-203.
Direct Link