
Shiqiang Zhang
Department of Electro-Mechanical Engineering, Tangshan College, China
Information Technology Journal
Year: 2013 | Volume: 12 | Issue: 13 | Page No.: 2473-2480


ABSTRACT
In order to acquire the best filling time, Mold trial is made by setting different injection time, or Mold flow software is used to analyze data recorded by computer. Whether doing successive trials or being simulated point by point, is very tedious. A new method is put forward-seeking the minimum of curve being simulated by Lagrange interpolation. The minimum of the curve is the best filling time. This method can improve the efficiency of the simulation analysis. The software Mold flow provides the possibility to simulate the flow processes of plastic air intake manifold with different gate location and number of injection mold and to predict the position of air traps and weld lines. The location and number of the gate in injection mold are determined by comparing analysis results and avoid mold adjustment and mold repairing. Finished injection mold of plastic air intake manifold on basis of simulation is perfect.
PDF Abstract XML References Citation
Received: May 20, 2013;
Accepted: August 13, 2013;
Published: September 21, 2013
How to cite this article
Shiqiang Zhang, 2013. Optimizing the Filling Time and Gate of the Injection Mold on Plastic Air Intake Manifold of Engines. Information Technology Journal, 12: 2473-2480.
DOI: 10.3923/itj.2013.2473.2480
URL: https://scialert.net/abstract/?doi=itj.2013.2473.2480
DOI: 10.3923/itj.2013.2473.2480
URL: https://scialert.net/abstract/?doi=itj.2013.2473.2480
INTRODUCTION
Mould system optimization is one of the hot research topic, many scholars have done a lot of work (Zhang and Quan, 2012; Liu et al., 2012; Yongmei, 2012; Muller and Dorn, 2010). Using CAE technology can test the feasibility of design. Compare to the traditional repairing mold, changing mold, testing mold, the CAE technology has obvious advantages (Sendler, 1991; Scheuermann, 1989). CAE system can simulate the melt flow, pressure distribution and the cooling processes before the mold is designed (Shen et al., 2001; Chen and Shen, 1999) and it can help technologists to determine the best packing pressure and time to get the best plastic production (Shen and Chen, 2000). Normally, the filling time corresponding to the minimal injection pressure is the reasonable filling time. The filling time is too short which means that flow rate (shear rate) is too high and very high injection pressure is required to fill the mold. If the filling time is too long, the cooling effect will raise the melt viscosity which needs high injection pressure. Mold trial by hand and using moldflow software simulation by computer are very tedious, hence, the Lagrange simulation curve based on the moldflow analysis is present and it can improve the efficiency of the moldflow analysis. The type of gate influences the surface mass, inner bug of product very greatly. When fussed mass flow together again, it would form melted mark (Tham and Christa, 1998), affects the overall strength of the product (Zhou and Li, 2002). If the pressure and the time is not enough, the rate of plastic shrinkage will be increased and it will lead to warp in product (Ozcelik and Erzurumlu, 2006). An incorrect gate location will lead to high pressure and shear rates, poor warpage of weld lines and a series of defects. The number of gate has great effect on the inside and the outward appearance of the product. The more number of the gates need the better run and the more firm of the fused mass, it is beneficial to the temperature and the distributing of the fused mass, makes the product better. But it increases the cost of the mould. Sometimes, it is unsuitable for more gates considering the structure of the product. Few gates isn't good, because few gates lead to loner distance of the fused mass and influence the fastness of contact marks and the unequal distribution of the inner pressure may lead to bend and deformation of the product and even lead to discontent. Gate position influences the flow of fused mass in mould directly and has effect on polymer molecular orientation and warp of product. At present, plastic air intake manifold is used widely in an engine but warp is difficult to solve. To decrease warp, selecting suitable gate is important. The CAE technology provides scientific basis on modification for designer (Shen, 2002) and determines the number and position optimization of gates and acquires more experience to the design of the intake manifold mold.
BEST FILLING TIME
If the injection time to fill the cavity is little, it must have high injection speed, therefore, must have very high pressure. When the injection time is very long, the melt temperature decreases, viscosity increases, thus it increases the difficulty to fill and requires high injection pressure. There is a lowest point in the middle of the curve and this point is the best filling time which is corresponding to the lowest injection pressure.
Figure 1 shows the relationship of the injection pressure and filling time. In order to draw this curve, different injection time must be tried repeated in actual production. Using analysis software, analyzing data recorded by computer, this curve can be found in advance. However, it is very tedious work to obtain simulation analysis point by point.
The curve is approximate to a quadratic curve in Fig. 1. Best time to fill is the lowest point of injection pressure in curve. It can be strictly proved on maths: Lagrange quadratic interpolation, three different points known, can uniquely determine a quadratic curve namely parabola. On this basis, you can find the extreme points of this parabola which is applied to find the best time to fill. Providing three filling time t1, t2, t3, Moldflow analysis software is used for analysis, the respective injection pressure is obtained, so that getting three initial point A (t1, p1), B (t2, p2), C (t3, p3), these three points and Lagrange quadratic interpolation are used for the prediction:
Rewritten as:
There into:
| (1) |
| (2) |
 | |
| Fig. 1: | Relationship of the injection pressure and filling time |
The minimum value of this parabola:
Correspond:
| (3) |
Substituting Eq. 1 and 2 into 3 and simplification was:
| (4) |
Equation 4 is best prediction for filling time. With this method the optimal filling time can be calculated by doing analysis three times only, improving the efficiency of analysis.
In flow analysis of the engine plastic intake manifold, the injection time is set to automatic while the others use the system defaults for analysis. Get a maximum injection pressure as p1 which corresponds to fill time as t1. Two appropriate values are selected as t2 and t3 on both sides of t1. The injection time is set to t2, t3 and other parameters are set the same value with the first set for analysis, the maximum injection pressures are obtained which are corresponding to the injection time t2, t3. Thus you can get three points: (t1, p1), (t2, p2), (t3, p3). According to the Eq. 4, you can calculate the optimal filling time.
Figure 2a shows that the maximum injection pressure is the 21.6651 Mpa when the filling time is 1.007 sec. Figure 2b shows that the maximum injection pressure is 26.6292 Mpa when the filling time is 0.300 sec. Figure 2c shows that the maximum injection pressure is 26.4646 Mpa when the filling time is 2.848 sec.
 | |
| Fig. 2: | Maximum injection pressure of different filling time |
So, the coordinates of three points is got as (1.007, 21.6651), (0.300, 26.6292), (2.848, 26.4646). According to Eq. 4, the best value 1.6 sec is got.
The injection time is set to 1.6 sec for analysis and the maximum injection pressure is 20.6991 Mpa in Fig. 2d. Take any two points as 1.5, 2 on both sides of the 1.6 for analysis. The maximum injection pressure, respectively are 22.3050 Mpa as shown in Fig. 2e and 24.1639 Mpa as shown in Fig. 2f which are greater than 20.6991 Mpa. So, 1.6 sec is indeed the filling time which the maximum injection pressure is little. But the best filling time is relative and it is in a certain range which can be seen from Fig. 1. Some moment close to it can also be used as the best filling time. In addition the quadratic curve is a simulation about the relationship between them, the filling time corresponding to the abscissa of minimum is not necessarily the absolute best filling time but the best filling time from this method can basically meet the need of the actual injection.
OPTIMIZING THE GATE
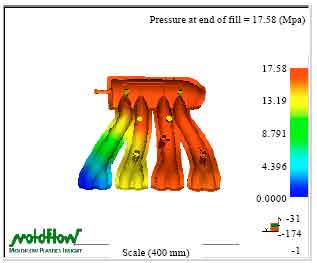
Moldflow software can be used to find a preliminary optimum of gate location. May be it is not the ultimate result of the design of gate location but it has very beneficial reference value. Figure 3 shows that the central position in the product is the best position to set the gate, followed by rounds, the edge is the worst.
Figure 4 shows that the warp has trend to increase with the increasing of the gate number and the warp of four gates is least. Figure 5 shows the synthetically warpage of the four gates is not less than 1.562 mm. Figure 6 shows four gates have less welds and Fig. 7 shows four gates have less bubbles.
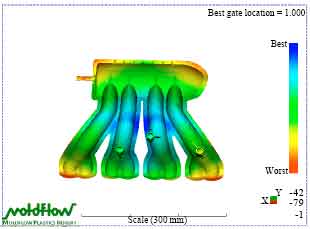 | |
| Fig. 3: | Best gate location distribution |
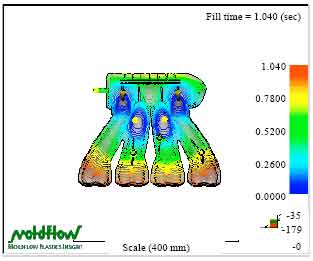
Figure 8a displays that the filling time is not almost change when the number of gate increases but the overall trend is decreasing. Figure 8b shows that the maximum inject pressure is downward trend with the increasing of gate number. Figure 8c shows change of weight is not big. Integrate deformation and weld, bubbles, weight and other aspects and compares each other, mainly considering deformation, the four gates is the best. Figure 9 shows that four gates model for simulation of pressure distribution conditions are relatively good. Figure 10 shows that four gates model for simulation of time distribution conditions are relatively good.
Figure 11a shows that the factor of cooling caused the deformation of 2.4304E-05 mm in plastics intake manifold, this values is small, it shows that the cool factor is not the main factors. Figure 11b shows that warp caused by the shrinking factor is 1.925 mm, Fig. 11c shows that warp caused by the molecular organization is 1.519 mm, indicating that shrinkage is not the mainly factor. By adjust inject process, decreases the warpage of products. To develop the molecular orientation, the further analysis by changing gate position.
Figure 12a shows the biggest deformation of the scheme 2 is 2.245 mm, the biggest deformation is 2.332 mm in Fig. 12b and the biggest deformation is 3.592 mm in Fig. 12c. Failure to achieve the desired results by changing the gate location and the later scheme has bigger deformation than initial scheme. Figure 5 shows the biggest deformation as the scheme 1 is 1.562 mm, it is the smallest compared to Fig. 12. Hence, gate location of scheme 1 is the best. Figure 13 (photo) shows injection mold made on basis of simulation is perfect, Fig. 13a is core dies and Fig. 13b is cavity die.
 | |
| Fig. 4: | Trend of the maximum strain with the increasing of the gate number |
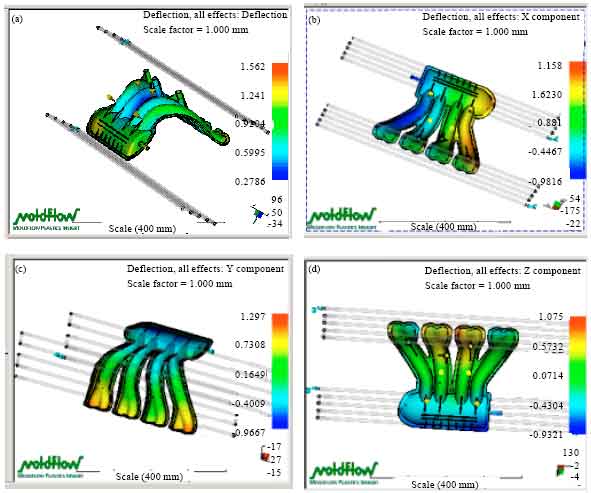 | |
| Fig. 5(a-d): | Deformation distribution of four gates, (a) Synthetically strain (b) Strain in X direction (c) Strain in Y direction and (d) Strain in Z direction |
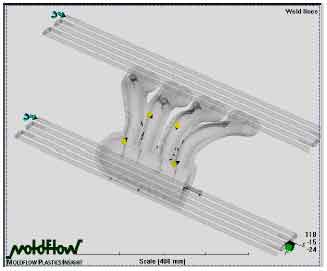 | |
| Fig. 6: | Weld distribution of four gates |
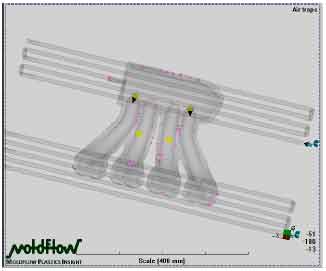 | |
| Fig. 7: | Bubble distribution of four gates |
 | |
| Fig. 8(a-c): | Trend of time, pressure and weight with the increasing of the gate number, (a) Time trend, (b) Pressure trend and (c) Weight trend |
 | |
| Fig. 9: | Pressure distribution of four gates |
 | |
| Fig. 10: | Time distribution of four gates |
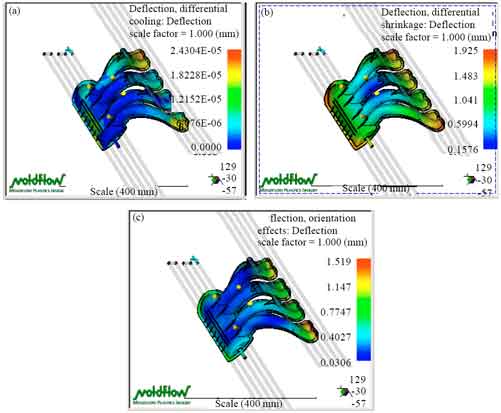 | |
| Fig. 11(a-c): | Warp caused by cooling, shrinking and molecular organization, (a) Warp caused by the cooling factor (b) Warp due to the shrinking factor and (c) Warp caused by the molecular organization |
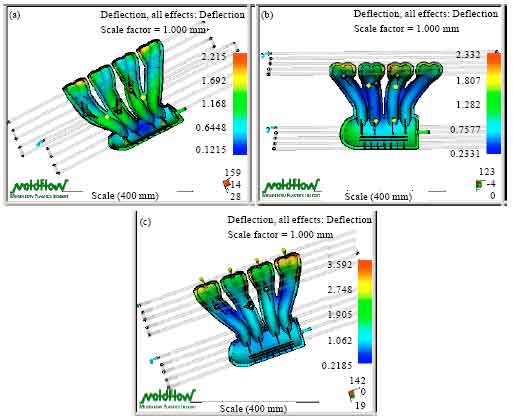 | |
| Fig. 12(a-c): | Warp by changing gate location, (a) Scheme 2 (b) Scheme 3 and (c) Scheme 4 |
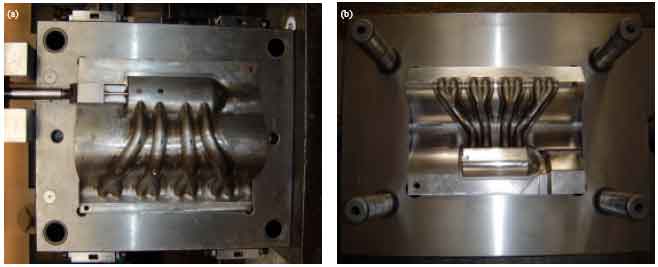 | |
| Fig. 13(a-b): | Injection mold of plastic air intake manifold, (a) Core dies and (b) Cavity die |
CONCLUSION
| • | Seeking the minimum of curve being simulated by Lagrange interpolation overcomes the defects of tedious analysis point by point and improves the efficiency of flow analysis. But the best filling time is not unique, may be influenced by product materials, structures, gate type, performance of injection molding machine and so on. And this method relies on curve simulation, so the value derived from formula may be some deviation from the actual value, needing constant validation. But it does great help for finding the best filling time |
| • | The injection mold of plastics intake manifold adapts to point gate, the best gate number is 4; the best gate location has been showed in Fig. 5. The manifold is not suitable for using a gate. But the number of the point gate should not be too much |
| • | The practical best position of the gate is not necessary consistent with the analysis results but there is something with the best gate location: The gate’s position distributes as some geometry (such as they are symmetrical about optimal region). If not it is easy to cause the melt shrinkage which would cause the uneven of inner parts and the warping deformation etc. Of course, they are not absolute, plastic intake manifold has abnormity which make each gate of plastic contribution roughly equal still need repeated adjustment |
ACKNOWLEDGMENT
This study is supported by the Special Funds of the National Natural Science Foundation of China (51246010).
REFERENCES
- Ozcelik, B. and T. Erzurumlu, 2006. Comparison of the warpage optimization in the plastic injection molding using ANOVA, neural network model and genetic algorithm. J. Mater. Process. Technol., 171: 437-445.
CrossRef