
Boulmakoul Azedine
Department of Computer Sciences Faculty of Sciences and Technology of Mohammedia, Morocco
Falih Noureddine
Department of Computer Sciences Faculty of Sciences and Technology of Mohammedia, Morocco
Marghoubi Rabia
INPT, 2 av ALLal EL Fasse-Madinat AL Irfane, Rabat, Morocco
Information Technology Journal
Year: 2012 | Volume: 11 | Issue: 8 | Page No.: 946-958


ABSTRACT
Strategic information system alignment is considered as one of the main pillars of the information systems governance in the company. In this study, we propose an original holistic approach centred on the extended enterprise meta-model (ISO/DIS ISO 19440 2007). This meta-modeling incorporates specific structures borrowed from best practices for driving the IT process of COBIT. Such a structure can bring systemic tools from the structural paradigm for a better assessment of the Strategic Information System Alignment. In this work we deploy this approach through a case study in a leading Moroccan telecommunications operator. We use particular, the Galois lattice and Guttman scales for the process reengineering.
PDF Abstract XML References Citation
Received: November 03, 2011;
Accepted: March 05, 2012;
Published: June 05, 2012
How to cite this article
Boulmakoul Azedine, Falih Noureddine and Marghoubi Rabia, 2012. Deploying Holistic Meta-modeling for Strategic Information System Alignment. Information Technology Journal, 11: 946-958.
DOI: 10.3923/itj.2012.946.958
URL: https://scialert.net/abstract/?doi=itj.2012.946.958
DOI: 10.3923/itj.2012.946.958
URL: https://scialert.net/abstract/?doi=itj.2012.946.958
INTRODUCTION
Corporate managers and professionals in information systems are constantly confronted to the subject of strategic Information System alignment. Solving this problematic is essential and indispensable for planning and organizing IS/Business synergies in accordance with the strategic directions and innovative intelligences integrated into the overall governance of the company. This concept is widely discussed in theory but rarely on the conceptual and operational levels.
Since the study of Henderson and Venkatraman (1993) the organizational performance based on information system is considered in many researches as the result of a set of factors that interact coherently. The theoretical global consensus emerging is to consider strategic alignment (Fig. 1) as a prerequisite to achieving organizational performance o f the company (Luftman and Maclean, 2004). Although there is no standard method for deploying and executing the strategic IS alignment, we propose in this work a practical approach based mainly on the extension of the Enterprise Meta-model ISO/DIS (ISO 19440, 2007). This extension integrates the necessary structures for developing systemic tools, based on the structural paradigm to better lead the evolutions of the strategic IS alignment (Boulmakoul et al., 2007, 2009).
In this study, we deploy this approach in a real context of a leading Moroccan telecommunication operator. We apply structural matrix for a particular area of the company in order to integrate them into a specific platform for viewing the lattice generated. The conclusion of this work defines the strengths that can be drawn from this technique and future prospects to develop.
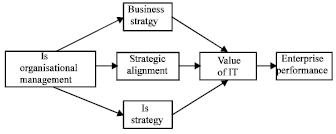 | |
| Fig. 1: | Strategic alignment context |
STATE OF THE ART
Strategic is alignment: The term "strategic alignment" expresses the idea to establish and follow a course. This is to coordinate the strategy of the information system with the company's business strategy. Lederer and Sethi (1992) define strategic alignment of information systems as the process of deciding the objectives of organizational computing and identifying potential computer applications which the organization should implement. Other approaches define strategic alignment according to the following quotation: The alignment process refers to an organizational process where the mission, goals, objectives, and activities of the IS change over time in parallel with changes in the organization (Henderson and Venkatraman, 1993).
Business process management (BPM): The Business Process Management (http://www.bpmi.org) is all about transferring the results of business process re-engineering discussed above into production. BPM technology provides not only the tools and infrastructure to define, simulate, and analyze business process models, but also the tools to implement business processes in such a way that the execution of the resulting software artefacts can be managed from a business process perspective.
According to Mathias (2007), BPM includes concepts, methods and techniques to support the design, administration configuration and analysis of business processes.
BPM is a key concept for placing business processes at the center of an overall integration (process-centric) and offers a new understanding of the role of technology in favor of management and performance. A BPM solution generally includes a tool for modeling business processes of the company, the tools for implementation and execution motor responsible for instantiating the process and store the context and status in a database.
Process mapping: The process mapping of a company or organization is a representation that allows synthetic reading of all processes the company uses to achieve its objectives. The mapping process is based primarily on the identification and categorization of key business processes. In this context, it should:
| • | Highlight the existing processes in the company |
| • | Prioritize process and select key business processes in terms of contribution to turnover, impact on customer satisfaction, etc. |
| • | Categorize the process as three types: management, business and support |
Enterprise meta-modelling: Modeling of the enterprise as complex socio-technical dynamic system stands as an indispensable means of organizations research to extract useful knowledge to the different steps of the strategic Information System alignment. It produces a rational thought on specific meta-knowledge needed for any formal or informal representation of the system studied, in order to increase the overall performance of the company. Many languages and methods have been developed such BPDM, Standards: ISO 14258, ISO/15704, ISO/TR/10314, ENV/12204, ENV/40003. Currently, many studies contribute to the definition of a unified language for enterprise modelling (Unified Enterprise Modeling Language) (OMG, 2005).
ISO 19440 meta-model: The research efforts of the 1990s in terms of enterprise modelling lead to a standardized framework to meet the needs of a systemic approach of the enterprise, it’s the ISO 19440 2007 meta-model oriented process models. It offers four views on these models: the organizational view, the informational view, the functional view and the view of resources (ISO 19440, 2007) (Fig. 2).
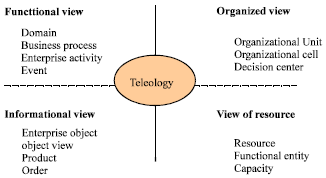 | |
| Fig. 2: | ISO 19440 (2007) views with teleological anchoring |
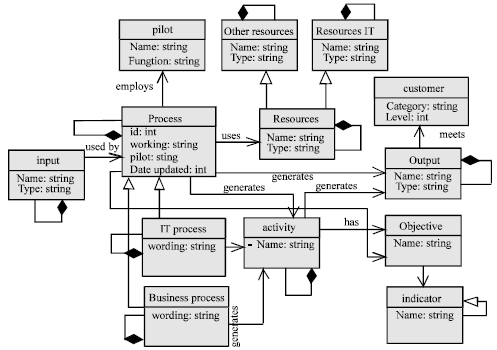
The ISO 19440 (2007) Meta-model is given in Fig. 3, according the four points of view mentioned above. The informational view is the representation of the information System data. The organizational view focuses on strategy of the enterprise. The functional view focuses on the processes. The view of resources is related to the resources used by business processes of the enterprise.
The Meta-model contains constructs identified by a common structure:
| • | A header identifying the construct |
| • | A body composed of formalized descriptions |
One area represents the border and the contents of an enterprise business or part of an enterprise. A business process represents a certain part of corporate behaviour. A business process is an aggregation of business processes and/or business activities and information described by the rules of management. The enterprise activity is to achieve a transformation of inputs to outputs by specific resources. The enterprise activity and business process collectively are called Enterprise Function. Management rules are used to define the behaviour of a business process. They define the constraints on scheduling, and dependencies between business processes and/or enterprise activity. An event starts the execution of a business process or activity. A special type of class event is an order. An order is an instruction for the execution of an activity.
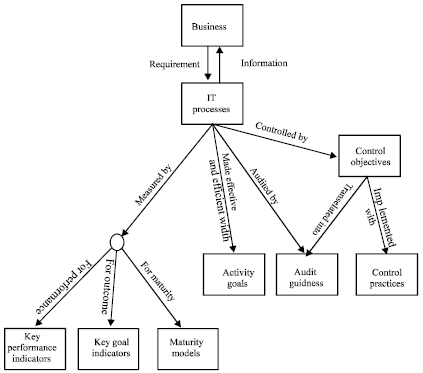
The COBIT framework: The COBIT referential (Control Objectives for Information and Technology) (ISACA, 2008) was created in 1996 by ISACA (Information Systems Audit and Control Association). This referential provides a reference framework and a set of tools for controlling and monitoring the governance of the information system. COBIT is based on a set of good practices, which proposes to establish a process oriented steering of the IS in order to contribute effectively to the alignment of technology on business strategy. The COBIT framework meets the needs of the enterprise by four major features: It focuses on the trades of the enterprise, is organized by the process, is based on checks and systematically uses measurements.
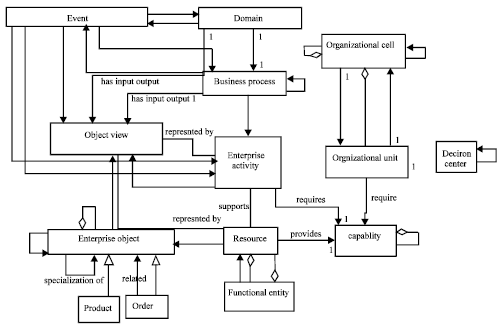 | |
| Fig. 3: | The ISO 19440 2007 meta-model |
 | |
| Fig. 4: | Interconnection of COBIT components |
COBIT components are all interconnected and aimed at meeting the needs of governance, management, control and assurance of different actors, as shown in Fig. 4.
[ISO19440-COBIT] synergy: Due to its focus in terms of monitoring and measurement of IT processes, we have borrowed specific elements from COBIT in order to incorporate them in the ISO 19440 meta-model. So, a specialization of "Functional Entity" has been proposed to model IT processes using resources in a connotation IT resource. This entity is modelled as a specialization of the entity "Resource".
We added also the abstract concept "objective" which was proposed in ISO 19440 as its functional aspect and remains the checkpoint of operation area of the enterprise, business processes and activities (Fig. 5).
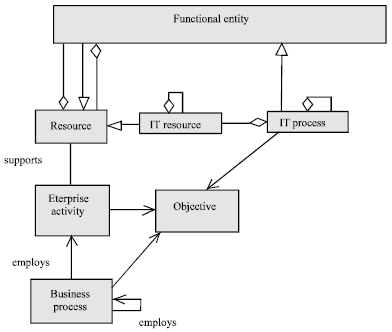 | |
| Fig. 5: | Integration of the “objective” entity and COBIT specifics elements |
| Table 1: | Matrix describing the relation R of the context C |
 | |
In the following we briefly recall the necessary elements on the Galois lattice and the Meta-model extended.
Galois lattices: The concept lattice (or Galois lattice) is a mathematical structure to represent non-disjoint classes underlying a set of described objects using a set of attributes (Wille, 1982). Lattices are algebraic structures used in various fields, and were used in data mining (Sharma et al., 2007).
The value of concept (Galois) lattices can be summarized as follows:
| • | Each concept corresponds to a grouping of objects solely based on their descriptions and taking into account the full description of each object: a file system analogy between concept and Directory |
| • | Groupings based on these concepts are dynamic: they change whenever objects are added/deleted or that the descriptions of objects change |
| • | Direct correspondence between description of concepts and interrogation request |
| • | Can be used for navigation |
| • | Every object is accessible from the root of the lattice |
| • | Unlike a hierarchical organization in general each object can be reached in several ways |
Example: Consider the context C represented by the triplet (O, A, R) where O, A are sets and R a relation. The binary matrix describing the relation R of the context C is given by Table 1, where O = (R1, R2, R3, R4, R5, R6) and A = (P1, P2, P3, P4, P5).
This context reflects that a resource X is used or not by the process Y.
In best practices of systemic, the functional structure is described by the processes, main pillars of business and candidates to interact with all components of the system. These interactions can be captured by appropriate structural matrix capable of providing a detailed view on the process tree and their arrangement with the other basic components of the meta-model.
Various types of structural matrices from various possible interactions can be defined: process/process coupling through resource; activity/resource link; process dependency by entropy measures, information/resource link; process/goal association, objective/indicator coupling through metrics, etc.
In this semantics, for the various problems of alignment of IS: (organization, activity, process) x (resource) (activity, process, resource) x (information) (activity, process, organization) x (information), we propose the construction of structural matrices and through appropriate structures initiate consistent analysis of such structures to assess the strategic information system alignment.
Structures that we suggest in this work are divided into two categories: structures that allow a single reading of the matrix structural analysis, namely the Galois lattice (order structure with closure concept) and the method Q-analysis (structure from algebraic topology).
 | |
| Fig. 6: | Integration of structural analysis |
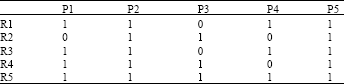
In this work, we limit ourselves to the structural analysis by the Galois lattice. Other tools will be considered in other future work (Boulmakoul et al., 2009).
Extended view of the ISO/DSI 19440 meta-model: We recall that the ISO 19440 extended Meta-model is based primarily on specific entities borrowed from COBIT as well as systemic tools that could translate explicitly the problem of IS alignment in different aspects. Figure 6 shows ISO/19440 Meta-model with constructs proposed.
In the following section, we treat one of these matrices to highlight the contribution of this alternative for the assessment of the strategic IS alignment on a concrete area.
CASE STUDY
Here, we propose the deployment of this approach to provide better visibility to the evaluation of strategic IS alignment in a leader Moroccan company in the field of telecommunications.
The use of specific built from COBIT for the extension of ISO 19440 meta-model joins synergistically to the use of systemic tools. Other structural matrix resulting from combinatorial interactions between different classes of meta-model can be studied. The parallelism of these two determinants can test the evaluation of strategic IS alignment and its contribution to organizational performance of the company.
Global mapping processes: The processes identified in the operator management system are classified into three categories, including process compounds themselves, by other processes, interacting or not according to the context or the area covered:
Management process:
| • | Strategic planning |
| • | Financial management |
| • | Quality management |
| • | Customer satisfaction |
Business process:
| • | Offers management |
| • | Sales management |
| • | National and international operators relationship |
Support processes:
| • | IS management |
| • | Network management |
| • | Human resources management |
| • | External communication |
| • | Expertise |
Each process is identified by his identity card which has the objective of the process, inputs and outputs, customers of the process, the actors, the resources deployed, the associated documents, the main processes in interaction, the indicators for measuring process performance, etc.
 | |
| Fig. 7: | General mapping process of studied operator |
 | |
| Fig. 8: | Class diagram of the operator mapping process (functional view of the meta-model) |
Figure 7 illustrates the various processes related at the operator studied.
Figure 8 provides a projection of the company meta-model according to the functional point of view. It houses various classes annotated corresponding relations.
One process is driven by one or more drivers and contains other processes. A process uses one or more resources: IT resources, human resources, material etc. The goal of a process is focused on objectives that can be influenced by the customer. Achieving these objectives is broken down into activities through a performance measured by indicators.
DEPLOYMENT
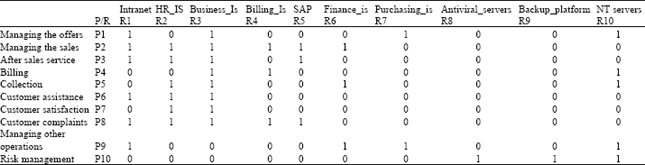
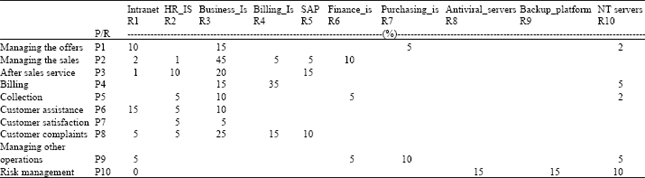
Matrix studied: In this section, we only consider the particular structural matrix (Process/IT Resource): The elements of this matrix consist primarily of a set of processes using, or not using, IT resources, and generating intersection points which may provide formal analysis for the evaluation of strategic IS alignment (Table 3).
| Table 2: | (Business process/IT resource) in a specific context |
 | |
| Table 3: | (Process- IT Resource) matrix of the operator studied |
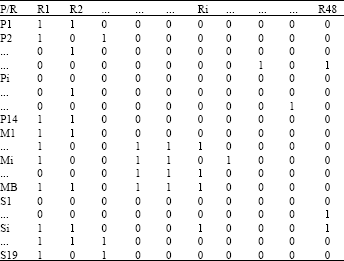 | |
The elements of our matrix are:
| • | Process | |
| • | Management process : encoded from P1 to P14s | |
| • | Business process : encoded from M1 to M8 | |
| • | Support process : encoded from S1 to S19 | |
| • | IT Ressource | |
| • | Encoded from R1 to R48. Here are some labels: Intranet, HR-IS, Business-IS, After sales service, SAP, Billing-IS, SGSI, Technical-IS, Finance-IS, Business Object, etc. | |
Deployment: To visualize the lattice of this context, we used the Galicia solution. This is an open platform built to create, view and save the concept (Galois) lattice through a multitude of algorithms to calculate and display data and extract the association rules of given context.
Given the large volume of data of qour larger context we consider a sample of several elements including some business processes and IT resources for a simple and effective visualization of the lattices generated (Table 2).
All binary annotations are purely illustrative and not a projection of the reality, according to the information security policy adopted by the company.
A concept combines a maximum set of objects with the set of attributes that these objects share. For example:
The resource "Business-IS" is used by all processes except "Managing other operators" and "Risk management"
IT resources "Antiviral-Servers" and "Backup-Platforms" are used only by the process "Risk management"
The process "Managing the offers", "Managing the sales", "Customer-Service", "After sales service" and "Customer Complaints", uses simultaneously the IT resource "intranet" where are found all useful information and IT resource "Business-IS" divided into applications and tools to run these processes.
RESULTS AND DISCUSSION
A first observation of our matrix allows us to conclude that an array of response (yes/no) to a questionnaire dichotomous "does process Pi uses the resource Rj , "As well as any table, some boxes are filled with" 1 "are the representation of a well-specified mathematical object, a binary relation R between two sets {Pi} and {R}. Now, from the first edition of his classic book on the lattice "Lattice Theory" Garrett Birkhoff has shown that to any relationship is associated a Galois correspondence (Birkhoff, 1940). Suffice it to say here that to any correspondence corresponds a lattice. In the case of the Galois correspondence associated with a binary relation, this lattice is called Galois lattices.
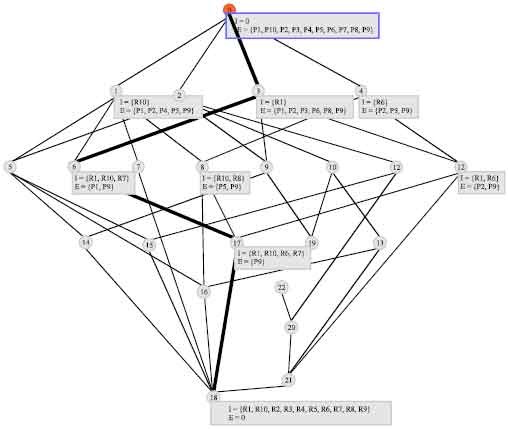
In order to view and visualize the concept lattice, we integrate our matrix in Galicia solution. This integration has a hierarchical visual representation highlighting specific concepts in a given context (Fig. 9).
An overall understanding (holistic) of the company business model is a more rational approach. On the example of the structural matrix binding processes to resources, the lattice has a canonical reading of this type of coupling. In a maximal di-click or closed (A, B), B is the set of all resources used simultaneously by all processes of A (no other process using it all).
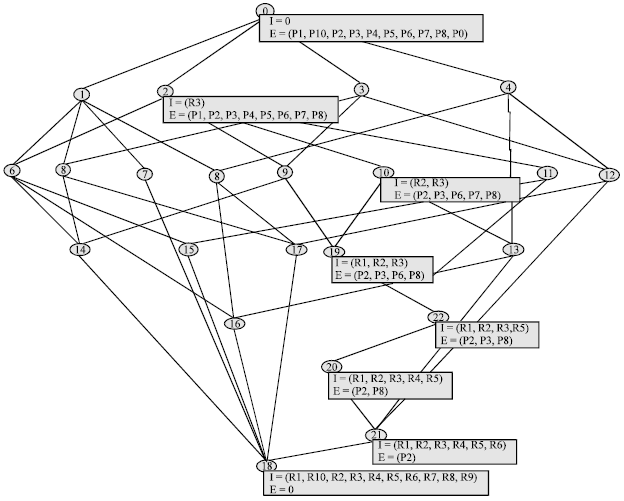 | |
| Fig. 9: | Lattice of the (Process/IT Resources) matrix |
The lattice contains all maximal di-cliques to find what processes are at the same time using the same resources R0, the minimum set of resources containing R0 must be determined. The Galois lattices arcs represent the possible shifts of a maximum di-click to another when the resource set R0 is reduced or increased. On a lattice, it is possible to rearrange the elements (resources and processes) in the order given by a lattice chain.
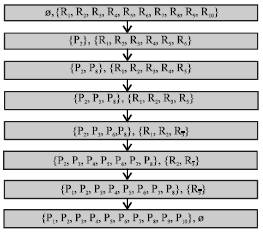
Guttman scales: During World War II Louis Guttman, a professor of sociology at Cornell University in the United States develops what he calls the analysis of scalogram or Guttman scales (Guttman, 1944). The existence of a Guttman scale indicates the degree of importance of the processes in business and resources used. A maximal chain of Galois lattice is an ordered sequence of concepts going from the smallest to the largest concept. In our case, we consider the criterion of cost of deployment of resources useful to run processes in a given context of the company. On the way up the chain contains the closed most consumers in terms of cost (Fig. 10).
The ability to locate on a same oriented continuum all the processes by increasing deployment costs, and all the resources by decreasing global utilisation costs, constitutes what is called a Guttman scale or a Guttman scalogram (Guttman, 1944) (Fig. 11).
Process reengineering: In this section we describe a method contributing to the reengineering of the process. This approach consists of identifying non-value added processes to streamline the process model. We take the binary matrix (Process-Resource), but this time annotated with percentages assigned to each resource with respect to the overall cost of deployment (Table 4).
∏ : Set of processes, Θ : Set of resources, λ application embodying the impact force of a process on a target Table 1, λ : ∏xΘ → R+, ![]() aggregate function, ω : R+x R+ x … xR+→ R+.
aggregate function, ω : R+x R+ x … xR+→ R+.
For each process Pi we associate the δ aggregate measure, impact on the overall objectives.
δ(Pi) = (![]() ((λ(Pi,O1), …, λ(Pi,Oj), …, (λ(Pi,ON)). The standard measure μ is given by: μ(Pi) = δ(Pi) / Σ(δ(Pi)).
((λ(Pi,O1), …, λ(Pi,Oj), …, (λ(Pi,ON)). The standard measure μ is given by: μ(Pi) = δ(Pi) / Σ(δ(Pi)).
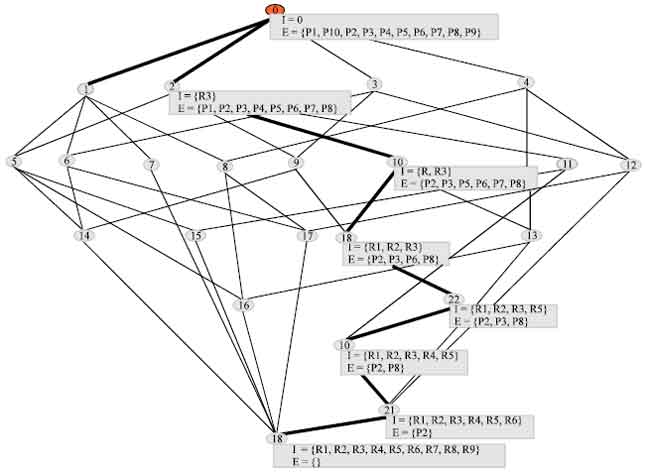 | |
| Fig. 10: | Maximal chain of our Galois lattice |
 | |
| Fig. 11: | Guttman scales obtained for a |
Analysis methodology: Calculate μ(Pi) ∀ Pi ∈ ∏:
We believe that the aggregate function ω relates to the maximum value of λ(Pi), then:
Similarly, we calculate δ(P2), δ(P3),……,δ(P10) . Moreover, we know that μ(Pi) = δ(Pi) / Σ(δ(Pi)) ∀ i then: μ(P1) = δ(P1)/Σ(δ(Pi)) = 15/195 = 0,08.
The following Table 5 summarizes all the results.
| Table 4: | Matrix studied Annotated rate budgets for resources |
 | |
| Values are in percentage | |
| Table 5: | Summary of results |
Scheduling process according to the measure (μ): The measure μ allows a descending sort of the process giving the following order:
Reminder: the basis of the Pareto law comes from the Italian economist Vilfredo Pareto who estimated that 80% of the wealth of this world was held by only 20% of the population. In our case, the Pareto principle expresses the fact that 80% of the studied processes are performed at a cost of 20% of the overall budget of resources.
Δ is the list of processes of which the costs of resources deployed are classified according to the 80/20 rule of Pareto:
| • | Σ μ(Pi) = 1,01 ≈ 1 |
| • | P2: 0,23 |
| • | P4: 0,23+0,18 = 0,41 |
| • | P8: 0,23+0,18+0,13 = 0,54 |
| • | P3: 0,23+0,18+0,13+0,10 = 0,64 |
| • | P1 ≈ P6 ≈ P10 : 0,23+0,18+0,13+0,10+0,08 = 0,72 |
| • | P5 ≈ P9 : 0,23 + 0,18 + 0,13 + 0,10 + 0,08 + 0,05 = 0,77 |
| • | P7 : 0,23+0,18+0,13+0,10+0,08+0,05+0,03 = 0,80 |
Δ = {P2, P4, P8, P3, P1, P6, P10}: all processes with a high impact on the company using resources with more or less reduced costs.
Let Λ = ∏-Δ : all processes with a low impact on the company, but using high-cost resources.
Λ = {P5, P7, P9}
Guttman chain up: In this phase, we try to trace, for each process Pi of Λ, the path of the closed container Pi according to a Guttman scale. We are interested in particular, in the closed which are the greatest consumers of the global budget allocated to the resources. Thus, we have for P5 and P9 following maximal chains (Fig. 12, 13):
Φ0 is called the minimum element of the lattice or Bottom. Φ18 is called the maximum element of the lattice or top. Thus, the concepts found in the process P5 according to the criteria adopted are: Φ0, Φ2, Φ10, Φ13, Φ16, Φ18..
Cost analysis: The process P5 and P9 with little impact in the Customer Service Department of the company use respectively 22 and 25%, of the overall cost of the resources deployed. The use of resources such as Business-IS or Sales-IS with such a cost, for example, appears to be inconsistent. Also, the allocation of expenses allocated to these resources should be reviewed and revisions of the processes should be planned for a more streamlined and coherent structure.
An information system project is a combination of interrelated activities that must be performed in certain prioritization (Suri and Soni, 2007). Aspects related to risks and budgets impact strongly strategic goals. Analysis of organizational units for process reengineering is crucial (Alfantookh et al., 2008; Kaur and Singh, 2010; Rungruang, 2012; Samson et al., 2012).
Proposal: The analysis of the closed leads us to the conquest of the organizational units deploying business processes P5 and P9. In this case, we have the divisions Billing/Collections, Customer Satisfaction and management of internal/external operators, all which are attached to the Customer Service Direction. For this it is proposed to ask the highest levels of the organization:
| • | List the main headings of the operational and investment budgets of this direction |
| • | Define the procedure followed for the establishment of the budget of each of the resources which run the Business Processes of this Direction |
| • | Identify, as a percentage of the overall budget, the annual budget allocated to the resources running processes P5 and P9 |
| • | Revise the costs |
| • | Review the organizational structures |
| • | Reorganize process (merger, cancellation of redundancy) |
| • | Rationalize expenditures |
| • | Optimize resources |
| • | etc. |
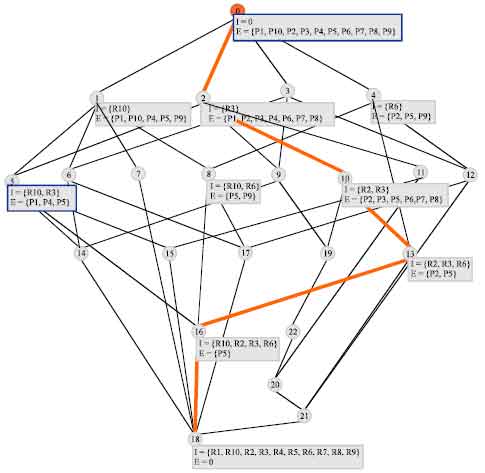 | |
| Fig. 12: | Guttman chain of the process P5 |
 | |
| Fig. 13: | Guttman chain relative to the process P9 |
This approach is likely to bring a new vision of business process reengineering in the context of IS engineering. Structural analysis of the closed will aim to review the meta-model of the company in its functional form to revise the structure of entities that may harm the overall performance of the business by a greedy consumption in terms of budget. The proposed methodology was implemented on an impact Grid (resource, process). The approach is established and has yet to be validated by stakeholders in leadership and in the control panel of the organization of our case study. Further studies will be performed on other organizations to measure its validity and to test its approval by the directors of information systems. Other structural matrices could be studied in future works to enhance the library of meta-knowledge useful to organizations seeking better alignment of their IS to maintain their relevance and their status in a context of increasing competitivity.
CONCLUSIONS
This study is part of the process and IS reengineering. It is based on an original holistic meta-modelling that meets the needs of strategists and IT managers. It could assist in the evaluation of strategic Information System alignment. The approach is well founded and is yet to be validated by the leaders and managers of the organization studied. We have already started the implementation of an application to illustrate the added value of this approach. Study of other structural matrices will soon be proposed to other organizations in order to evaluate the contribution of this approach to the subject of strategic information systems alignment.
Other alternatives may be considered for this research. Galois lattices have advantage of being canonical structures. For example we can use classification techniques and multi-criteria evaluation for given matrices handled in this study (Khiyal et al., 2003; Zheng-Quan et al., 2003; Farshadnia, 2002).
ACKNOWLEDGMENT
This approach was first developed by Pr Azedine Boulmakoul. We implemented on a real site in a leading Moroccan telecommunication operator.
REFERENCES
- Alfantookh, A.A., K.M. Al-Hazmi and S.H. Bakry, 2008. Assessment indicators for information technology in higher education institutions: A STOPE approach. Asian J. Inform. Manage., 2: 1-13.
CrossRefDirect Link - Samson, A.A.J. Mary, B.F. Yemisi and I.O. Erekpitan, 2012. The impact of working capital management on the profitability of small and medium scale enterprises in Nigeria. Res. J. Bus. Manage., 6: 61-69.
CrossRef - Boulmakoul, A., N. Falih and R. Marghoubi, 2009. Meta-modelling and structural paradigm for strategic alignment of information systems. Proceedings of the 4th Mediterranean Conference on Information Systems-MCIS Information Society Research, Education, Policy and Practice in the Mediterranean Region, September 25-27, 2009, Athens University of Economics and Business (AUEB). Greece, pp: 1070-1081.
- Henderson, J.C. and N. Venkatraman, 1993. Strategic alignment: Leveraging information technology for transforming organization. IBM Syst. J., 32: 472 -484.
Direct Link - Kaur, K. and H. Singh, 2010. Candidate process models for component based software development. J. Software Eng., 4: 16-29.
CrossRefDirect Link - Lederer, A.L. and V. Sethi, 1992. Root Causes of strategic information systems planning implementation problems. J. Manage. Inform. Syst., 9: 25-45.
Direct Link - Luftman, J. and E.R. Maclean, 2004. Key issues for IT executives. MIS Q. Executive, 3: 89-104.
Direct Link - Khiyal, M.S.H., M.A. Zia, K. Riaz and N. Khalid, 2003. An algorithm to find equivalence classes. Inform. Technol. J., 2: 240-249.
CrossRefDirect Link - Suri, P.K. and R. Soni, 2007. Simulating the potential effect of risk management on project scheduling. Inform. Technol. J., 6: 8-13.
CrossRefDirect Link - Rungruang, P., 2012. Antecedents of organizational commitment of academics in thailand: Qualitative analysis. Res. J. Bus. Manage., 6: 40-51.
CrossRef - Sharma, S., A. Tiwari, S. Sharma and K.R. Pardasani, 2007. Design of algorithm for frequent pattern discovery using lattice approach. Asian J. Inform. Manage., 1: 11-18.
CrossRefDirect Link - Zheng-Quan, X., H.H. Najapuka and Y. Xu, 2003. Super cube as a model for component classification. Inform. Technol. J., 2: 1-4.
CrossRefDirect Link