
Ruoyu Yan
College of Computer and Information Engineering, Henan University of Economics and Law Zhengzhou, Henan Province, 450002, China
Chao Shao
College of Computer and Information Engineering, Henan University of Economics and Law Zhengzhou, Henan Province, 450002, China
Information Technology Journal
Year: 2012 | Volume: 11 | Issue: 9 | Page No.: 1243-1250


ABSTRACT
Traffic anomaly detection and attack identification are research focus in the network security community. In the paper, a hierarchical system framework is proposed to detect and identify traffic anomaly in high-speed network. At first, multiple basic detectors developed under authors’ previous research work are represented roughly. Then an alerts fusion method combining these basic detectors is used to improve on the anomaly detection ability. Experiments in real high-speed network demonstrate that the method has higher detection performance than basic detectors and majority voting method. To further identify attack type accurately, seven traffic features are used to characterize three types of attack (port scan, network scan and DoS attack) and traffic distribution change for each traffic feature is measured by cross entropy. Then Exponentially Weighted Moving Average (EWMA) control chart method based on cross entropy is proposed to classify attacks. The experimental results on traffic in backbone router have shown that the method has strong ability to detect and identify attacks.
PDF Abstract XML References Citation
Received: February 20, 2012;
Accepted: March 29, 2012;
Published: June 04, 2012
How to cite this article
Ruoyu Yan and Chao Shao, 2012. Hierarchical Method for Anomaly Detection and Attack Identification in High-speed
Network. Information Technology Journal, 11: 1243-1250.
DOI: 10.3923/itj.2012.1243.1250
URL: https://scialert.net/abstract/?doi=itj.2012.1243.1250
DOI: 10.3923/itj.2012.1243.1250
URL: https://scialert.net/abstract/?doi=itj.2012.1243.1250
INTRODUCTION
With the increasing losses to Internet caused by malicious network traffic (CCRC, 2005), analysis and study of traffic in Internet is an important research work in current network security community. Anomaly detection and identification for high-speed network traffic is one of the core research directions (Deri, 2003; Guang et al., 2009; Salem et al., 2009).
Intrusion Detection System (IDS) has been widely used to detection network traffic anomaly. Because IDS systems need to analyze every raw packet so they are not suitable for high speed network. In order to solve this problem, by Deri (2003), author has designed and developed an IDS system which can analyze NetFlow flows. As NetFlow flows can not provide some IP and TCP packet fields, the detection performance is not very satisfactory. In Guang et al. (2009) authors design and implement a Trace Measurement and Analysis System for the Multi-links China Education and Research Network Backbone (TMASM). TMASM is related to the measurement and behavior analysis of the massive traffic data. Although, there some analysis experiments on traffic detection, analysis detection is time consuming and there is no comprehensive performance test given. Salem et al. (2009) authors propose a new approach based on sketch and MNP-CUSUM to detect denial of service (DoS) and Distributed Denial of Service (DDoS) attacks over high speed link. They claim that the detection tool which implements the proposed architecture has ability to detect low intensity attacks. But false alarms are accordingly high because of the difficulty in controlling the sensibility of MNP-CUSUM. On the other hand, the method only can detect DoS/DDoS attacks and is helpless to detect scanning attacks. Although these systems (Deri, 2003; Guang et al., 2009; Salem et al., 2009) have a certain detection performance but are far from perfect. Two open problems remain: one is traffic anomaly detection methods widely have lower True Positive Rate (TPR) and higher False Positive Rate (FPR) ; the other is detection systems lack the ability to identify and evaluate specific network attack behavior, such as port scan, network scan and DoS/DDoS attacks.
To increase TPR and decrease FPR, three detection methods proposed by authors before are used to detect anomaly respectively and then consensus combination method (Gao et al., 2011) is applied to combine these results to further improve detection performance. Consensus combination is a kind of alert fusion, which has emerged as a powerful method for improving robustness and accuracy of anomaly detectors. Consensus combination combines multiple basic detectors into a committee to reduce uncorrelated errors. Different from existing alert fusion approaches (Gu et al., 2008; Corona et al., 2008; Seni and Elder, 2010) which require labeled data for training, consensus combination fuses the decisions of multiple anomaly detectors without the guidance of any labels. Although majority voting also is a method to achieve this, it is far from being good.
To improve the accuracy of identification of specific network attack behavior, in the study attack behavior is dynamically measured by traffic feature distribution change. Anomaly detection methods based on traffic feature selection (Kumar et al., 2007; Lakhina et al., 2005; Nychis et al., 2008) have widely used in existing detection system. This type of method needs to select a feature subset from a group of traffic features to represent attack behavior accurately. The identification accuracy depends on how to select actual features to describe different types of attack behavior appropriately. Traffic feature distribution, such as IP address, port number, is a common and existing metrics to capture network behavior. Furthermore, an empirical evaluation of entropy-based anomaly detection method (Nychis et al., 2008) shows that the combination of traffic flow header features and traffic behavior features can improve detection performance significantly. This helps to select a suitable feature subset. In addition, the previous work (Yan and Zheng, 2009) indicates that cross entropy can measure traffic changes very well and has strong anomaly detection ability. Based on these analysis, traffic behavior features and traffic flow header features are used to characterize three types of attacks (DoS attacks, port scans and network scans) and for each traffic feature, corresponding traffic distribution change is measured by cross entropy. Then multiple cross entropy indicators are processed by EWMA control chart method for anomaly detection. Finally, Euclidean distance measurement judges attack type. In the study, aimed to the two problems, a hierarchical framework focusing on high-speed network is proposed to detect and identify traffic anomaly in this study and a prototype system is implemented.
THE FRAMEWORK OF HIERARCHICAL ANOMALY DETECTION AND IDENTIFICATION SYSTEM
The anomaly detection and identification system developed as a prototype monitors the security of high speed network. The system detects all kinds of attacks in real time and the detection results are displayed on web page timely.
According to business logic the framework of the system is divided into five layers shown in Fig. 1: Traffic collection and analysis layer, anomaly detection layer, EWMA-based attack identification layer, DDoS attack evaluation layer and results display layer. Brief description of every layer is as follows.
Traffic collection and analysis layer
Traffic collection: In high speed network, the original traffic is very huge and hardly to be processed on time. In order to reduce traffic collection burden, NetFlow records created by router are only collected in the system. NetFlow is a kind of flow concept proposed by Cisco Company. Flow is defined as a unidirectional stream of packets with five same tuples: destination IP, source IP6 destination port, source port and layer 3 protocol type. After a router is configured to open NetFlow cache NetFlow records are generated at every time bin, which are then encapsulated in UDP packets and mirrored to traffic collection server.
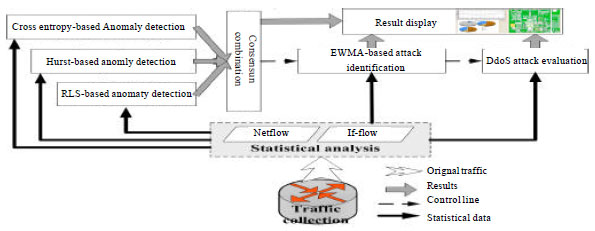 | |
| Fig. 1: | The framework of hierarchical anomaly detection and identification system |
Statistical analysis: UDP packets received from router are unpacked and NetFlow records are extracted, then network traffic are aggregated respectively by 8 traffic features, namely destination IP6 source IP6 destination port, source port, InDegree, OutDegree, Flow Size Distribution (FSD) and layer 3 protocol type (only consider TCP, UDP and ICMP protocol) per unit time. As each NetFlow record includes input and output fields, it is easy to calculate flow count of Internal Flow (IF) flows (Yan et al., 2010) at every time bin. IF stands for internal flow in a router, which is defined as a group of packets traveling from one port to another different port in a router per unit time. All these statistical data obtained by traffic aggregation are stored in a database server.
Anomaly detection layer: In this layer, three kinds of basic methods are used to detect traffic anomaly and consensus combination method is used to combine detection results of 15 basic detectors to get the final results. These anomaly detection methods proposed in authors’ previous research study (Yan et al., 2010; Yan and Wang, 2012; Yan and Zheng, 2009) have high efficiency, accuracy and timeliness.
RLS-based anomaly detection: The method is first introduced in authors’ previous work and the detailed procedure can be found by Yan et al. (2010). In the module, Recursive Least Square (RLS) is used to predict 4 traffic metrics, such as TCP, UDP, ICMP and ALL traffic metric. Then statistics based on prediction error of each metric are used to detect anomaly respectively. For each metric there is one basic detector to predict traffic anomaly, so 4 basic detectors based on RLS method are used in this layer.
Hurst-based anomaly detection: The method is first introduced in authors’ previous work and the detailed procedure can be found by Yan and Wang (2012). Self-similarity is one of the important features of network traffic. If an attack such as DoS attack exists in network, self-similarity index, namely Hurst parameter can change obviously. Hence Hurst parameter is a good indicator to detect traffic anomaly. Here iterative estimation method is used to estimate Hurst parameters of 4 traffic metrics, for example TCP, UDP, ICMP, ALL traffic metric and etc., Then for each metric the Hurst values are compared to confidence intervals of normal values to detect anomaly. Thus 4 basic detectors based on Hurst method are used in this layer.
Cross entropy-based anomaly detection: The method is first introduced in authors’ previous work and the detailed procedure can be found by Yan and Zheng (2009). Cross entropy has stronger ability to display traffic distribution change than Shannon’s entropy. In the module, 7 traffic features, which are destination IP6source IP6destination port, source port6InDegree6OutDegree and FSD6 are used to aggregate network traffic respectively. For each traffic aggregation, traffic distribution is measured by cross entropy for anomaly detection. Hence, 7 basic detectors based on cross entropy method are used in this layer.
Consensus combination: There have been many methods developed to conduct anomaly detection over network traffic. However, each of them can not detect all anomalies because of limited descriptions of the traffic behaviors and thus suffers from high false negative rates or false positive rates. Therefore the combination of many basic detectors is a feasible way to improve on the detection ability. Although, there already have some solutions such as majority voting among detectors but it is far from being good enough. In this study, a consensus combination method (Gao et al., 2011) is used to combine 15 basic anomaly detectors mentioned before to reach more accurate detection in an unsupervised and on-line manner. The algorithm combines the basic detectors applied to different traffic metrics by maximizing the probabilistic consensus iteratively among the output of the basic detectors.
EWMA-based attack identification layer: Anomaly detection layer can detect traffic anomaly but can not tell what kind of attack causes it. So traffic attack identification is a second step the system to give more detailed information about attacks. The two layers complement each other in function. When anomaly is found by detection layer, the attack identification layer immediately works to identify the attack type.
This layer focuses on three types of typical attack behaviors, such as DoS attack, port scan attack and network scan attack (or worms). This identification method is based on cross entropy and EWMA control chart. At first, traffic behavior features and traffic flow header features are used to characterize the three types of typical attacks. For each traffic feature, traffic distribution is measured by cross entropy and for each type of attack behavior, behavior character vector is built according to different attack characteristic. Then for each cross entropy indicator, EWMA (Exponentially weighted moving average) control chart method is applied to detect anomaly and detection result vector is built by these detection results at every time bin. At last similarity between each behavior character vectors and detection result vector is computed to classify attacks.
DDoS attack evaluation layer: If attack identification layer has detected DoS attack in high speed network, DDoS attack evaluation layer is the third step the system to confirm whether the attack is a DDoS attack. The evaluation method processes if flow traffic matrix in a router and judges how seriously each router port is under DDoS attack. The method has fully utilized the traffic aggregation feature of DDoS attack. Two factors affecting the evaluation index are considered. One of the factors is how many IF flows going to one port are detected as anomaly at one time. The more number anomalous IF flows go to a port, the more seriously the port is under DDoS attack. The other factor is how large the anomalous traffic volume in IF flow is. The more large value of the ratio of anomalous IF flow’s traffic volume to the port’s out traffic volume, the more seriously the port is under DDoS attack. The detailed evaluation procedure can be found in authors’ previous work (Yan et al., 2010).
Results display layer: Results display layer is responsible to present the anomaly detection results, the attack identification results and DDoS attack evaluation results to network administrators through Web pages. Administrators can check graphical and tabular results to monitor network attack behaviors on line.
TRAFFIC ATTACK IDENTIFICATION BASED ON EWMA AND FEATURE DISTANCE
Definition of two kinds of vectors: In order to define network abnormal behavior precisely, in the study, seven types of traffic features are used. Among these traffic features, five traffic flow header features include: destination IP address (DestIP)6 source IP address (SrcIP)6 destination port (DestPort)6 source port (SrcPort) and Flow Size Distribution (FSD); two traffic flow behavior features include: In degree (InDegree) and out degree (OutDegree). Flow size is defined as packets number in a network flow per unit time; InDegree of one host is defined as the number of all hosts which initiate connections to the host; OutDegree of one host is defined as the number of hosts that the host initiates connection to. Seven cross entropy metrics based on seven types of traffic features is defined as E = {EDestIP6 ESrcIP6 EDestPort6 ESrcPort6 EFSD6 EInDegree6 EOutDegree}. Before these metrics are used to detect and identify attack behavior, it is necessary to define two kinds of vectors.
Detection result vector A: Detection result vector is defined as A = {AdestIP6 A SrcIP6 AdestPort6 ASrcPort6 AFSD6 AInDegree6 AOutDegree}. Each element value in A is a binary variable between {0, 1} and determined by applying detection method to one cross entropy metric per unit time. If anomaly is detected, the value is 1, otherwise 0.
Behavior character vector S: Different attack behavior or normal network behavior have their own behavior model expressed by their own traffic features. Based on this, for each network behavior, behavior character vector is defined as S = {SDestIP6 SSrcIP6 SDestPort6 SSrcPort6 SFSD6 SInDegree6 SOutDegree}6 Siε{0, 0.5, 1}. Where 1 presents abnormal, namely traffic distribution changes significantly and corresponding cross entropy increases significantly; 0 presents normal, namely traffic distribution basically has no change and corresponding cross entropy is almost the same; 0.5 presents traffic distribution is uncertain and corresponding cross entropy is random. Next after qualitative analysis of three types of typical attacks, each element in their behavior character vector can be determined.
Behavior character vector of three types of attacks
DoS attack: A large number of hosts launch an attack to one victim host and each attacker host establishes a connection to the victim host with fixed destination port. Therefore the traffic distribution based on destination IP address or destination port is highly concentrated and there are lots of hosts with one out degree. For each of the three traffic features, traffic distribution changes significantly and corresponding cross entropy also increases significantly. However, for source port, source IP address and in degree, the attack effect on traffic distribution is very small, so their corresponding cross entropies change little. Furthermore, traffic distribution based on FSD is uncertain. Thus behavior character vector of DoS attack is S = {1, 0, 1, 0, 0.5, 0, 1}.
Network scan: One host or multiple hosts launch scan to a large number of victim hosts and each scan host establishes a connection to one victim host with fixed destination port. Besides, each connection often sends only one packet to probe the fixed port open or not. Therefore the traffic distribution based on source IP address or destination port is highly concentrated; the number of flow with one packet is very large in FSD; the destination host with fixed in degree increases gradually. For each of the four traffic features, traffic distribution changes significantly and corresponding cross entropy also increases significantly. However for destination IP address and out degree, the attack effect on traffic distribution is very small, so their corresponding cross entropies change little. Furthermore, traffic distribution based on source port is uncertain. Thus behavior character vector of network scan is S = {0, 1, 1, 0.5, 1, 1, 0}.
Port scan: One host launches scan to multiple victim hosts. The scan host establishes many connections to one victim host with sequential destination port number. Besides, each connection often sends only one packet to probe a destination port open or not. Therefore the traffic distribution based on source IP address or destination IP address is highly concentrated; the number of flow with one packet is very large in FSD. For each of the three traffic features, traffic distribution changes significantly and corresponding cross entropy also increases significantly. However for source port, destination port, in degree and out degree, the attack effect on traffic distribution is very small, so their corresponding cross entropies change little. Thus behavior character vector of port scan is S = {1, 1, 0, 0, 1, 0, 0}.
Because normal traffic behavior is normal in all dimensions of character vector, each element value is set to 0. Character vectors of DoS, network scan, port scan and normal traffic behavior are summarized in Table 1.
EWMA based anomaly detection: Let X(i) (i = 1,2,3) be an observed time series. The Geometric Moving Averages value of X(i) is:
| (1) |
where, Z(i) is prediction of next time observations at time i. X(i) is observations at time i. λ1(0≤λ1≤1) is forgetting factor which determines responding speed of prediction model to input changes. The bigger λ1 is, the more dependence on the latest input data the model prediction value has and the faster responding speed to input changes prediction model has.
The Upper Control Line (UCL) and Lower Control Line (LCL) of EWMA at time i is expressed as:
| (2) |
In Eq. 2 L is a parameter to control confidence interval of prediction value. L often is set to 2.33, namely confidence level is 99%. σe(i-1) is prediction value of prediction error of the next time at time i-1 and the computation equation is
| (3) |
where, e(i) is prediction error at time i. e(i) can be computed from e(i) = X(i)-Z(i-1). λ2 is forgetting factor of prediction error.
| Table 1: | Behavior character vector |
 | |
When beginning anomaly detection, firstly current value is predicted according to historical observations. Then two control lines (UCL and LCL) are computed. If current observations are above UCL or below LCL, anomaly is thought to be found at that time. Different from Shannon entropy, when traffic distribution changes (concentration or dispersion) cross entropy always decreases. Therefore only the LCL is used to detect anomaly, which can decrease detection process.
Using feature distance to distinguish attacks: Most of the time operation network is thought to be under normal state. In order to decrease computation, before starting attack identification, it is necessary to preprocess traffic data to filter most of them. Given that network attack always leads to changes of multiple traffic detection indicators, if two or more detection indicators are anomalous, the attack possibility is thought to be very high; if only one or none detection indicator is anomalous, the attack possibility is thought to be very low. Based on this, the distance between detection result vector A and normal behavior character vector S, namely d(A, S), is computed for preliminary judgment on whether network behavior is abnormal or not. If d(A, S)>1, attack behavior possibly exists and it is necessary for further attack behavior comparison, otherwise ignoring.
There are many distance measurement methods, such as Euclidean distance, Cosine distance and Jaccard distance. Each method has its own feature. Considering that the computation of Cosine distance or Jaccard distance is very big and that during computation denominator may be zero, which affects efficiency, Euclidean method may be an ideal option. Euclidean distance between A and S in n-dimensional space is expressed as:
| (4) |
When identifying attacks, the Euclidean distance between detection result vector A and each behavior character vector S is computed and four distance values are obtained. Then four distance values are compared and the type of attack which leads to the most large distance value is selected as attack type.
EXPERIMENTS DATA
System deployment environment: Based on the hierarchical anomaly detection and identification framework, a prototype of network detection and monitoring system is developed and deployed in North Center of China Education and Research Network (CERNET).
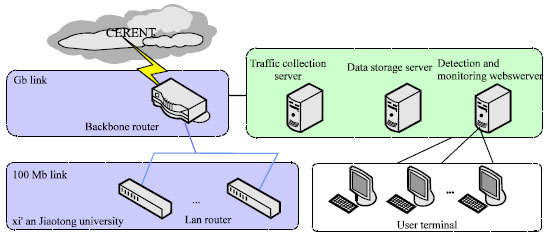 | |
| Fig. 2: | The system deployment topology |
The system deployment topology is shown in Fig. 2. In order not to affect normal use of the network, the system collects traffic data by passive mode, which includes traffic collection server, data storage server, traffic detection and monitoring WEB server and access terminals. Traffic collection server collects traffic coming from Xi’an Jiaotong University aggregated by intervals spanning 1 min; traffic metrics extracted from traffic data are stored in data storage server; the detection and identification methods introduced in the study are deployed in traffic detection and monitoring WEB server to analyze, detect, identify and evaluate anomaly.
Measurement data used: In order to test performance of the developed system, a series of experiments are done in real high speed network shown in Fig. 2. In theses experiments attack tools such as Hack. Huigezi, Trinoo and SuperScan are used to simulate real attack in the monitored network. These attacks are classified as three types as follows:
| • | DoS attack: When DoS attack is launched, the attacked host receives a large number of traffic flows with only one packet, which exhausts network bandwidth and occupies CPU most of the time. Thus the victim is unable to meet normal user requests. In the simulation, 10 hosts in monitored network launch DoS attack against one victim host. To generate diversified attack traffic data, each time the victim and attacked port number are randomly selected and each attacking host sends 57-byte packets at a speed of 10~100 kB min-1 randomly for only one minute. Thirty times of DoS attack simulation are repeated |
| • | Network scan: Two types of scanning activity are considered. One is single scan activity that a host scans the entire university addresses; the other is multiple scan activity that scanners are a set of random source addresses. To simulate the properties of two types of real scanning activity, the destination port is fixed and set as 445 and scanning flow size is between 1 to 3 packets. In single host scanning, a host scans 50 hosts in the university network. In multiple hosts scanning, each participating host scans at a rate of 30 hosts per second and the number of scanning hosts varies. 30 times of network attack simulation are repeated |
| • | Port Scan: One host scans multiple victim hosts, which connects each victim host with sequential destination port number. In the simulation, scanning host and victims are fixed and the scan rate is 100~1000 times per second. 30 times of port scan attack simulation are repeated |
| Table 2: | Description parameters of three types of attack |
 | |
Table 2 presents description parameters of the three types of simulation attacks. All these experimental data are created under the description parameters, based on which the performance of the prototype system is evaluated.
RESULTS AND DISCUSSION
Consensus combination detection accuracy: In the experiment, eighteen basic detectors are applied on corresponding traffic metrics to detect anomaly. Then the results of eighteen detectors are combined by majority voting method and consensus combination method, respectively. Their performances are compared and shown in Table 3. From Table 3, it can be observed that the basic detectors have larger FPR and lower TPR in their detection abilities. Majority voting is better than individual detectors because it leverages the decisions of the basic detectors. But the consensus combination among all the basic detectors can achieve more improvement. Unlike majority voting, which considers each basic detector has equal detection capability, the consensus combination method combines basic detectors’ decisions by way of weighting. That means, the more often a detector agrees with the other detectors, the higher weight it has. Take a close look, the average TPR of basic detectors is only 0.7850, while the consensus combination method improves it to 0.8641; the average FPR of basic detectors is 0.2132, while the consensus combination method decreases it to 0.1673. Clearly consensus combination method has improved the anomaly detection performance remarkably.
Attack identification accuracy: In the experiment, like cross entropy metric, EWMA method is also applied to Shannon entropy metric to judge attack type. The different is that concentration or dispersion of traffic distribution will make Shannon entropy decrease or increase. So the UCL and LCL must be used in EWMA method, which increases computation and false alarms. The identification results of two metrics are shown in Table 4 which indicates:
| • | As for TPR and FPR, cross entropy metric has higher performance than Shannon entropy metric. TPR of cross entropy metric is 11.1% higher than that of Shannon entropy metric in average, especially 20% higher when detecting network scan attack. At the same time, FPR of cross entropy metric is only half of Shannon entropy metric in average. The reason is that only unilateral detection is done when EWMA method is applied to cross entropy metric. However, bilateral detection must be done to Shannon entropy metric |
| • | Two types of metric have good identification performance of DoS attack. This means behavior character vector of DoS attack has depicted the attack feature accurately but for port scan and network scan, identification performance is not very good. Specifically for network scan, Shannon entropy metric has very pool identification performance and the TPR is only 63.3%. There may be two reasons: one is that behavior character vector of network scan is not appropriately described here; the other is that network scan is difficult to be detected when attack intensity is very weak |
| Table 3: | TPR and FPR of three methods |
 | |
| Table 4: | Attack identification results of two metrics by EWMA-based method |
 | |
Others: In the backbone network, about 70 M NetFlow traffic data is created every five minutes in average, which includes about 800000 NetFlow records. Although the NetFlow data is very large, modular design and efficient algorithm make the prototype system has very fast data process speed. The maximum processing delay is less than 5 sec in the real test environment. It is well known that monitoring system running in real-time should not affect the normal use of network. This demands the system running with a lower system resource in monitoring servers and routers. In the test, even the prototype system is responsible for data collection, analysis and processing, it takes up less than 20% of the system resources. In the process of network traffic collection, only NetFlow records are collected, the occupation of network bandwidth is very low, which affects the normal transmission of traffic data little. At the same time, the opened NetFlow function occupies part of resource in router but this does not affect normal users to use the network (Zhi-Xin et al., 2007). It can be seen that the designed prototype system can meet real-time traffic monitoring in high-speed network without affecting the normal use of network.
CONCLUSIONS
This study proposes a hierarchical system framework to detect traffic anomaly and identify three type of typical traffic attack. In the system framework, consensus combination method is used to fuse results of 18 basic detectors for the purpose of improving on the ability to find anomaly in traffic. And these basic detectors are based on RLS prediction algorithm, Hurst parameter and cross entropy metric. Experiments in real high-speed network demonstrate that the method has higher detection performance than basic detectors and majority voting method. Based on anomaly detection, EWMA control chart method is proposed to identify port scan, network scan and DoS attack. The experimental results on traffic in backbone router have shown that the method has strong ability to detect and classify real traffic.
For the purpose of improving on anomaly detection performance, in the future some experiments should be done to select more suitable detectors among those basic detectors proposed in the study to get higher detection performance.
ACKNOWLEDGMENTS
This study is supported mainly by National Natural Science Foundation of China (61101211),Henan Science and Technology Research Projects of China (112102210393), Henan Fundamental and Advanced Technology Research Projects of China (112300410201) and Henan provincial natural science research program (12A520005).
REFERENCES
- Gao J., W. Fan, D. Turaga, O. Verscheure, X. Meng, L. Su and J. Han, 2011. Consensus extraction from heterogeneous detectors to improve performance over network traffic anomaly detection. Proceedings of the 31st Annual IEEE International Conference on Computer Communications, April 10-15, 2011, Shanghai, China, pp: 181-185.
- Kumar, K., R.C. Joshil and K. Singh, 2007. A distributed approach using entropy to detect DDoS attacks in ISP domain. Proceedings of the IEEE International Conference on Signal Processing, Communications and Networking, February 22-24, 2007, Chennai, India, pp: 331-337.
CrossRef - Lakhina, A., M. Crovella and C. Diot, 2005. Mining anomalies using traffic feature distributions. ACM Sigcomm Comput. Commun. Rev., 35: 217-228.
CrossRefDirect Link - Yan, R. and Q. Zheng, 2009. Using renyi cross entropy to analyze traffic matrix and detect DDoS attacks. Inform. Technol. J., 8: 1180-1188.
CrossRefDirect Link - Yan, R. and Y. Wang, 2012. Hurst parameter for security evaluation of LAN traffic. Inform. Technol. J., 11: 269-275.
CrossRefDirect Link