
R.R. Ali
National Research Centre (NRC), Egypt
A. Shalaby
National Authority for Remote Sensing and Space Sciences (NARSS), Egypt
International Journal of Soil Science
Year: 2012 | Volume: 7 | Issue: 2 | Page No.: 39-50


ABSTRACT
Thermal IR data possess valuable information; especially in the expression of the Land Surface Temperature (LST). The present research aims to study the response of the topsoil features to the seasonal changes of land surface temperature in arid environment by using thermal IR data. Wadi El Natrun depression occupy a small area to the west of the Nile Delta, it includes different types of landforms and soils, so it was chosen for this study. Digital Elevation Model (DEM) and satellite image were used in a Geographic Information System (GIS) to delineate the main landforms. Field work has been done in order to check the accuracy of the landform units, describe the land surface features, measuring the LST and collect soil samples. It is found that the main features of the topsoil in the study area are cultivation, carbonate deposits, aeolian deposits, alluvial deposits, water bodies, wetland, gypsic deposits and sabkhas. The thermal bands of Landsat ETM+ were used to elaborate the land surface temperature at 3 dates during the year 2009. The correlation between top-soil features and LST was implemented. Accordingly the response of these features to the seasonal changes of LST was discussed in detail. The analyses of seasonal changes of LST provide valuable information about topsoil features before land surveying work.
PDF Abstract XML References Citation
Received: November 12, 2011;
Accepted: January 17, 2012;
Published: February 11, 2012
How to cite this article
R.R. Ali and A. Shalaby, 2012. Response of Topsoil Features to the Seasonal Changes of Land Surface Temperature in the Arid Environment. International Journal of Soil Science, 7: 39-50.
DOI: 10.3923/ijss.2012.39.50
URL: https://scialert.net/abstract/?doi=ijss.2012.39.50
DOI: 10.3923/ijss.2012.39.50
URL: https://scialert.net/abstract/?doi=ijss.2012.39.50
INTRODUCTION
Land Surface Temperature (LST) is defined as the thermal emission from the land, including vegetated and bare soil surfaces. It is a significant factor that reflects relations between the land and the troposphere (Wan and Snyder, 1996). The LST can provide significant information about the land surface properties (Dousset and Gourmelon, 2003; Weng et al., 2004). Each of land surface materials has specific thermal properties and their response to the changes in atmospheric temperature varies widely (Jensen, 2000). However, understanding of the pattern of thermal wavelength regions on materials could increase the efficiency of the land cover classification (Prakash, 2000). The soil surface temperature is influenced mainly by thermal conductivity which depends on soil physical properties, i.e., soil particles, air, moisture and porosity. The increment of quartz and or hematite in topsoil leads to high surface temperature (Panah et al., 2008). Water, sulphate and carbonate deposits could be detected in the near infrared bands, while quartz, gypsum and hematite are detected in the thermal infrared reflectance (Simon et al., 1999). Gypsiferous and salt affected soils could be significantly detected by using thermal band with TM imagery (Goossenes and van Ranst, 1996; Metternicht and Zinck, 2003; Bonyad, 2005, Reddy et al., 2008). The near infrared reflectance is mostly affected by type of salts, moisture content and the presence of hygroscopic water (Everitt et al., 1988; Mougenot et al., 1993). Silicate, carbonates, sulphates and oxides minerals induce spectral features in the thermal infrared providing a very useful property for remote identification (Sinha, 1986). Soils in arid regions are mixtures of silicates, carbonates, sulphates and oxides minerals and their spectra are composites of the separate spectrum of the basic minerals (Panah et al., 2008; Al-Dakheel et al., 2009). The current research aims to achieve benefits from multi-temporal ETM+ thermal band for detecting the response of topsoil features to the changes of land surface temperature in arid environment.
MATERIALS AND METHODS
Study area: Wadi El-Natrun is a narrow depression located in the west of the Nile Delta, approximately 110 km northwest of Cairo between longitudes, 30°02’ and 30°29’ E and latitudes, 30°16’ and 30°32’ N (Fig. 1). The total area of Wadi El Natrun is about 281.7 km2, extended in a NW-SE direction and 23 m below sea level. The Wadi el Natrun region is covered by Quaternary lakebeds and old alluvial deposits of sand and gravel. These deposits were laid down when the sea encroached north of the depression and the river Nile flowed through the area. The lake deposits and alluvium are underlain by sedimentary rocks of Pleistocene and Pliocene age that consists of sand and gravel inter-bedded with thin layers of clay (Said, 1993). Wadi El Natrun area considered as an extremely arid region where the mean annual rainfall, evaporation and temperature are 41.4, 114.3 mm and 21°C, respectively (Egyptian Meteorological Authority, 1996).
Satellite data: Three available Landsat ETM+ image (path, 177-row, 39) acquired on 30 April (spring), 12 August (summer) and 02 December (winter) of the year 2009 has been used in his study. The ETM+ image contain 7 bands of spectral data represents the visible, infrared and thermal spectrum. The Scan Line Corrector (SLC) of the Landsat 7 was failed in May 31, 2003, creating a scanning pattern of wedge-shaped gaps. The Landsat still to gain data with the SLC-off, generating images of about 22% missed data (Storey et al., 2005). To recover the capability of the images produced after May 2003, the SLC-off data could exchange with calculated values from the histogram-matched scenes using ENVI 4.7 software. The thermal bands of Landsat ETM+ (band 6) displays the amount of infrared radiant emitted from different surfaces.
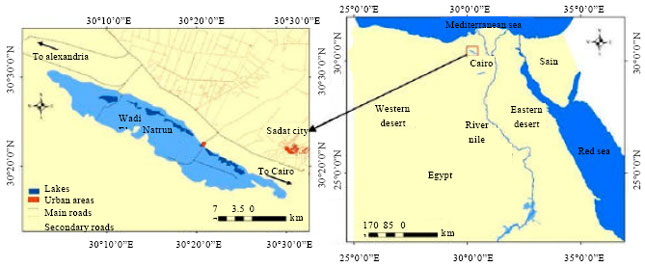 | |
| Fig. 1: | Location of the study area |
The long infrared waves are radiations that are detected as heat energy; therefore, the thermal IR band well correlate with the temperature of the surfaces it scans (EOSC, 1994). The image was enhanced by using ENVI 4.7 software. To improve the contrast and enhancing the edges, the image was stretched using linear 2%, smoothly filtered and their histograms were matched according to Lillesand and Kiefer (2007). The atmospheric correction was done to reduce the noise effect using FLAASH module. Image was radiometrically and geometrically corrected to accurate the irregular sensor response over the image and to correct the geometric distortion due to Earth’s rotation (ITT, 2009). Digital Elevation Model (DEM) is a 3D electronic model of the land’s surface (Brough, 1986). It can be employed to offer varieties of data that can assist in mapping of landforms and soil types. Information derived from a DEM, i.e., surface elevation, slope% and slope direction, could be used with the ETM+ images to increase their capabilities for landscape and soil mapping (Lee et al., 1988; Dinesh, 2008; Soleimani and Modallaldoust, 2008). The Digital Elevation Model (DEM) of the study area (Fig. 2) was extracted from the Shuttle Radar Topography Mission (SRTM). The SRTM is a respected space data of land surface obtained by accurate positioned radar scanning earth at 1-arc seconds intervals. This data could be combined with multispectral images to realize better view of the landscape (Al-Mashreki et al., 2010; Ghaffari, 2011; Ruzinoor et al., 2011).
Estimating land surface temperature (LST): Satellite detectors acquire thermal data and store it as Digital Numbers (DN) with a range of 0-255. The DN values were transformed to temperature (in Celsius) using band 6.1 of all available ETM+ images as follows:
| (1) |
where, CVR is the cell value as radiance, CVDN is the cell digital number, G and B are the gain and the bias obtained from the image header file (NASA, 2002).
Mapping landform units: The delineation of the landform units from the satellite data needs a high spatial resolution images; therefore the spatial resolution of the used Landsat ETM+ was enhanced through the data merge process.
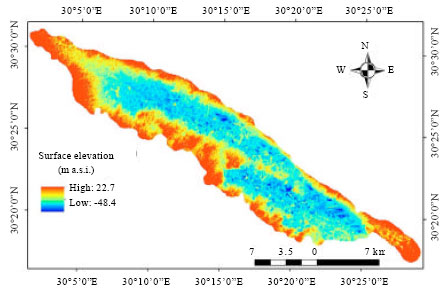 | |
| Fig. 2: | Surface elevation of the study area as extracted from SRTM image of 30 m resolution |
This process is usually used to enhance the spatial resolution of multi-spectral datasets using higher spatial resolution panchromatic data or single band (band 8 of ETM+). In this study merged data were performed using multi-spectral bands (28.50 m) as a low spatial resolution with panchromatic band 8 of ETM+ satellite image as a high spatial resolution (14.25 m) resulting in multi-spectral data with high spatial resolution (14.25 m). The landforms map has been generated from the DEM and enhanced Landsat ETM+ images using the ENVI 4.7 software (Dobos et al., 2002; Kurucu et al., 2004; Tagil and Jenness, 2008; Mumipour and Nejad, 2011). The landform units were defined and classified in orders and then the map legend was established according to Zinck and Valenzuela (1990). The map legend is hierarchical as it considers the landscape level as the main unit containing the relief, lithology and landforms. The boundaries of the produced map were adapted during the field work. A thermal transect cross the different landforms was designed using ENVI 4.7 software to extract the LST values in each map unit with an accuracy of 87.21%.
Field work and laboratory analyses: The interpretation of satellite images and digital elevation model generates a preliminary landform map. A semi detailed survey was done throughout the investigated area in order to gain an appreciation on the soil patterns, landforms and landscape characteristic (Yaro et al., 2006). Forty observation points were studied in the field to check the accuracy of the map units; the morphological description was carried out according to the guidelines edited by FAO (2006). Twenty disturbed surface soil samples (along the thermal transect) have been collected and analyzed using the soil survey laboratory methods manual (Burt, 2004). Three field trips (on 14 April, 12 August and 02 December/2010) were carried out in order to measure the land surface temperature in the field for the 20 investigated sites to validate the satellite based estimation. Figure 3 represents the Landsat ETM+ image of Wadi El-Natrun overlaid by the preliminary landform units, locations of top-soil samples, observation points and the thermal transect.
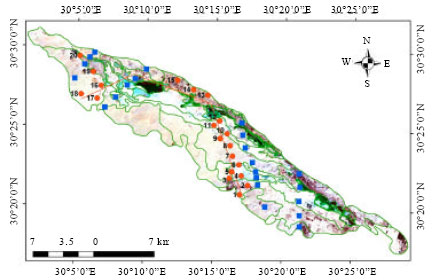 | |
| Fig. 3: | Landast ETM+ image of Wadi El-Naturn, overlaid by the preliminary landfrom units (green lines), locations of top-soil samples (red circles), observation points (blue squares) and the thermal transect (red line) |
RESULTS AND DISCUSSION
Landforms and top-soil properties: Analyses of Landsat ETM+ and SRTM images made it possible to define three main landscapes in the study area (i.e., playa plain, wadi plain and wadi bottom). Moreover it is possible to recognize the different landforms (Fig. 4) within these landscapes as the following.
Playa plain: This landscape represents 13.29% of the study area (i.e., 43.40 km2); it includes the landforms of low elevated alluvial deposits (19.27 km2) and high elevated alluvial deposits (24.13 km2). The morphological description and laboratory analyses indicate that the soils of low elevated alluvial deposits are brown (10 YR 5/3), dry, it changes to light yellowish brown, (10YR6/4), dry, in the highly elevated alluvial deposits. The soil texture is sandy, surface gravel is few to common, soil structure is single grained, these types of soil texture and structure indicate the initial stage of soil development which may be related mainly to the aridity conditions. The land surface is characterized by few stones and few shrubs. The percent of organic matter (OM) is very low in these landforms as it not exceeds 0.63%. Calcium carbonate changes from 7.12% in the soils of highly elevated alluvial deposits to 23.21% in the low elevated alluvial deposits. The electrical conductivity (EC) values are rather high as it ranged from 12.63 to 36.80 dS m-1; the high values characterized the soils of low elevated alluvial.
Wadi plain: The total area of this landscape is 119.24 km2 representing 36.71% of the total area. The main landforms in this landscape are almost flat alluvial deposits (52.45 km2) and undulating alluvial deposits (67.49 km2). The soils of almost flat alluvial deposits are pale yellow, (2.5Y 8/4), when dry, while the undulating alluvial deposits have a brownish yellow, (10YR 6/6), dry, color. The soil texture is sandy loam in the almost flat aeolian; it changes to loamy sand or sandy in the undulating alluvial. The surface gravel is few, soil structure is weak sub-angular blocky. The land surface is characterized by few stones, common gravel and few shrubs. The percent of OM is very from 2.60 to 5.68 dS m-1 and 7.25 to 13.69 dS m-1 in the almost flat and undulating alluvial, respectively.
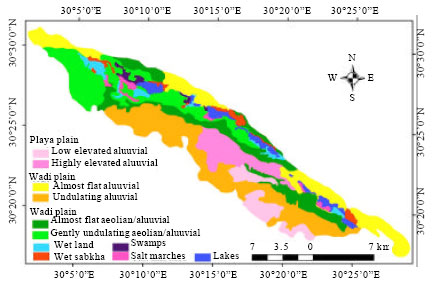 | |
| Fig. 4: | The main landforms of Wadi El Natrun |
Wadi bottom: This landscape incorporates an area of 163.35 km2 (i.e., 50% of the total area), it includes the land forms of almost flat aeolian/alluvial deposits (45.27 km2) and gently undulating aeolian/alluvial deposits (73.05 km2). Lakes, salt marshes, swamps, Wetland and wet sabkha (sabkha is a flat surface of thick salt crust) are found within this landscape representing 13.78% of the study area. The soils of almost flat aeolian/alluvial deposits are brownish yellow, (10YR 6/6), dry, it changes to pale brown, (10 YR 6/3), dry, in the gently undulating aeolian/alluvial deposits. The colors of wetland and wet sabkha are yellowish brown, (10YR 5/6), wet and dark brown, (10YR 3/3), wet, respectively. Soil texture is sandy to loamy sand; the fine fractions characterize the wetland and wet sabkha landforms. Surface gravel is few; soil structure is single grained in the eaolian/alluvial and weak blocky in the wetland and wet sabkha landforms. The land surface is characterized by few stones and common shrubs. The percent of OM is low as it ranges between 0.22 and 1.23% the highest one characterized the wet sabkha landform. Calcium carbonate changes from 5.32% in the soils of eaolian/alluvial to 18.25% in the wetland. The EC values ranged from 9.82 to 38.31 dS m-1 in the eaolian/alluvial and from 123.4 to 162.7 dS m-1 in the wetland and sabkha.
Topsoil features and LST changes: Land Surface Temperature (LST) over the study area was obtained from the available Landsat thermal bands and field measurements in three dates i.e., 14 April, 12 August and 02 December /2009 as shown in Fig. 5-7. The soil surfaces in the study area, as an arid environment include: (1) Cultivation, (2) Carbonate deposits, (3) Aeolian deposits, (4) Alluvial deposits, (5) Water bodies, (6) Wet land, (7) Gypsic deposits and (8) sabkhas. To detect the LST over these surfaces a thermal transect cross the different landforms was designed. The LST values along this transect at the above mentioned dates were extracted (Fig. 8) and matched with topsoil properties (Table 1). The differences of LST in specific date are mainly related to the topsoil features i.e., variation of moisture content, hygroscopic water in salts and mineralogy of topsoil (Friedl and Davis, 1994; Owen et al., 1998; Moran et al., 2004; Ekberli, 2006; Weng et al., 2007). A cultivated area located in the undulating alluvial of Wadi plain was selected to detect the changes of LST. During December/2009 the field was cultivated by winter wheat (planted in 15 November), the crop density still low and the soil moisture was high.
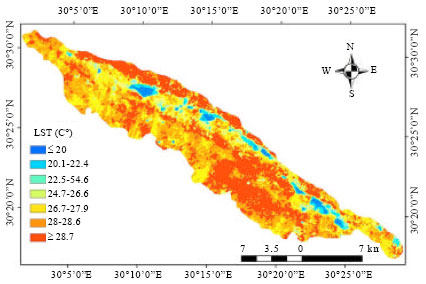 | |
| Fig. 5: | Estimated land surface temperature over Wadi El Natrun in 30 April 2009 |
| Table 1: | Topsoil properties and LST of the investigated sites |
 | |
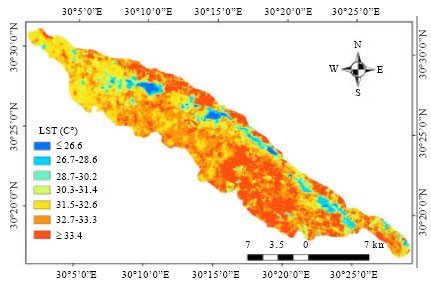 | |
| Fig. 6: | Estimated land surface temperature over Wadi El Natrun in 12 August 2009 |
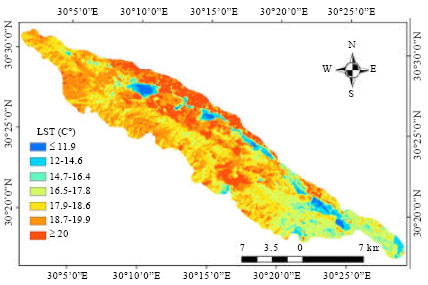 | |
| Fig. 7: | Estimated land surface temperature over Wadi El Natrun in 02 December 2009 |
In April wheat corps reaches to the maturity stage, while in August/2009 the field was fallow. Surface temperature of the observed cultivated area was increased from 16.4°C in 02 December to 28.1°C in 30 April and to 31.3°C in 12 August, while the atmospheric temperature was 21.2, 29.5 and 34.2°C, respectively. This indicates that the surface temperature of cultivated area is governed by moisture content, crop density and maturity stage (Norman et al., 1995; Moran et al., 2002). Non-silicate molecular of arid environment (e.g., carbonates) gives a high reflectance in the thermal infrared (Ruff et al., 1997). The site selected for LST detection in the carbonates-rich surfaces is located in the low elevated alluvial of playa plain. Calcium carbonate represents 22.5% on the volume bases in the top-soil sample. The LST of the observed site was increased from 22.3°C in December, to 30°C in April and to 35°C in August. It is noticed that the LST of the carbonate deposits is usually closed to the atmospheric temperature. Due to the high reflectance of sand (Sinha, 1986), the calculated LST of Aeolian deposits was generally more than the atmospheric temperature and any other surfaces, where it reached to 24.9, 31 and 35°C in December, April and August, respectively.
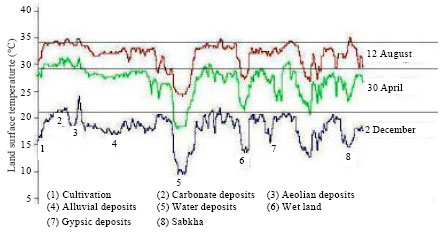 | |
| Fig. 8: | Changes of land surface temperature along thermal transect in 30 April, 12 August and 02 December 2008, the solid horizontal lines represent the atmospheric temperature |
The difference between the LST of Aeolian sand and other surfaces in the cold month is high while it decreased in the hot month. This can be explained by the relatively low moisture content of sand even in the cold months compared with the other surfaces. The top-soil of the alluvial deposits of the Wadi bottom landform is characterized by a sandy loam texture and more ability to retain moisture is expected. The LST of the alluvial deposits is in general less than the atmospheric temperature, as it record 17.5, 25.6 and 32.5°C in December, April and August, respectively. Compared with the other surface features water bodies and wetlands give the lowest reflectance, accordingly a very low LST is originate. The recorded LST of water bodies is usually less than the air temperature, as it reaches to 9.9, 19.8 and 24.5°C, while for wetlands it reaches 14.6, 21.1 and 28.8°C in December, April and August, respectively. It is seen that the difference between LST of water bodies and air temperature reach its maximum value in cold month while decreased in hot one. Salts with high moisture content like gypsum have low reflectance therefore low LST was expected (Mougenot et al., 1993; Weidong et al., 2002; Howari, 2003). Gypsic deposits were represented by an observation point located in the almost flat Aeolian/alluvial of wadi bottom landform. In temperate and hot weather (April, August) the gypsic deposits give the same reflectance of carbonates deposits. We can easily differentiate between gypic and carbonates deposits in the cold weather. Due to the high liquefaction of gypsic deposits, the LST of gypsic surfaces was usually found less than the carbonates-rich surfaces in cold weather (December). Sabkhas contain a high percentage of soluble salts, in the study area the surfaces of sabkhas still wet during December and April, while it becomes dried in August. The LST of sabkhas is the same of wetlands in December and April, but in August the LST is highly increased to be the same of Aeolian sand (35°C) due to salt accumulation on the surfaces when the sabkhas become dry.
CONCLUSION
This study focused on studying the response of the topsoil features to the multi-temporal changes of Land Surface Temperature (LST) in the arid environment by using ETM+ thermal data.
The study area is characterized by the diversity of surface features i.e., cultivation, carbonate deposits, aeolian deposits, alluvial deposits, water bodies, wetland, gypsic deposits and sabkhas. Detection of temporal LST changes indicates that some of these features have the same surface temperature on a specific date, while they differ significantly in another. For example the LST of gypsic and carbonates deposits are the same during hot season while they differ widely in cold one. Also wet sabkhas and wetland have the same LST in cold season but we can easily classify them in hot season as a result of the high increasing of sabkhas LST. These results underline the importance of using multi-temporal thermal data when investigate the surface features. Valuable information about the topsoil features can be extracted from the analyses of multi-temporal thermal data which can facilitate the land surveying work as well as supervised classification of the multi-spectral images.
REFERENCES
- Al-Dakheel, Y.Y., A.H.A. Hussein, A.S. El-Mahmoudi and M.A. Massoud, 2009. Soil, water chemistry and sedimentological studies of Al Asfar evaporation Lake and its Inland Sabkha, Al Hassa Area, Saudi Arabia. Asian J. Earth Sci., 2: 1-21.
CrossRefDirect Link - Al-Mashreki, M.H., J.B.M. Akhir, S. Abd Rahim, K.M. Desa and Z.A. Rahman, 2010. Remote sensing and GIS application for assessment of land suitability potential for agriculture in the IBB governorate, the Republic of Yemen. Pak. J. Biol. Sci., 132: 1116-1128.
CrossRefDirect Link - Bonyad, A., 2005. Multitemporal satellite image database classification for land cover inventory and mapping. J. Applied Sci., 5: 834-837.
CrossRefDirect Link - Dinesh, S., 2008. Extraction of hydrological features from digital elevation models using morphological thinning. Asian J. Scientific Res., 1: 310-323.
CrossRefDirect Link - Dousset, B. and F. Gourmelon, 2003. Satellite multi-sensor data analysis of urban surface temperatures and land cover. ISPRS J. Photo Remote Sens., 58: 43-54.
CrossRef - Ekberli, I., 2006. Determination of initial unconditional solution of heat conductivity equation for evaluation of temperature variance in finite soil layer. J. Applied Sci., 6: 1520-1526.
CrossRefDirect Link - Everitt, J.H., D.E. Escobar, A.H. Gerbermann and M.A. Alaniz, 1988. Detecting saline soils with video imagery. Photogramm. Eng. Remote Sens., 54: 1283-1287.
Direct Link - FAO., 2006. Guidelines for Soil Description. 4th Edn., Food and Agriculture Organization of the United Nations (FAO), Rome, Italy, ISBN-13: 9789251055212, Pages: 97.
Direct Link - Friedl, M.A. and F.W. Davis, 1994. Sources of variation in radiometric surface temperature over a tallgrass prairie. Remote Sens. Environ., 48: 1-17.
CrossRefDirect Link - Howari, F.M., 2003. The use of remote sensing data to extract information from agricultural land with emphasis on soil salinity. Aust. J. Soil Res., 41: 1243-1253.
CrossRefDirect Link - Kurucu, Y., M. Bolca, U. Altinbas and M.T. Esetlili, 2004. A study on the determination of the land use, elevation and slope of the land to the west of soke by forming a digital elevation model and satellite image. J. Applied Sci., 4: 542-546.
CrossRefDirect Link - Metternicht, G.I. and J.A. Zinck, 2003. Remote sensing of soil salinity: Potentials and constraints. Remote Sens. Environ., 85: 1-20.
CrossRefDirect Link - Moran, M.S., C.D. Peters-Lidard, J.M. Watts and S. McElroy, 2004. Estimating soil moisture at the watershed scale with satellite-based radar and land surface models. Can. J. Remote Sens., 30: 805-826.
CrossRefDirect Link - Moran, M.S., C.H. Daniel, Q. Jiaguo and Y. Kerr, 2002. Comparison of ERS-2 SAR and Landsat TM imagery for monitoring agricultural crop and soil conditions. Remote Sensing Envir., 79: 243-252.
Direct Link - Mumipour, M. and H.T. Nejad, 2011. Tectonics geomorphology setting of Khayiz anticline derived from GIS processing, Zagros Mountains, Iran. Asian J. Earth Sci., 4: 171-182.
CrossRefDirect Link - Norman, J.M., M. Divakarla and N.S. Goel, 1995. Algorithms for extracting information from remote thermal-IR observations of the Earth's surface. Remote Sens. Environ., 51: 157-168.
CrossRef - Owen, T.W., T.N. Carlson and R.R. Gillies, 1998. An assessment of satellite remotely-sensed land cover parameters in quantitatively describing the climatic effect of urbanization. Int. J. Remote Sensing, 19: 1663-1681.
CrossRef - Panah, S.K.A., R. Goossens, H.R. Matinfar, H. Mohamadi, M. Ghadiri, H. Irannegad and M.A. Asl, 2008. The efficiency of landsat TM and ETM+ thermal data for extracting soil information in arid regions. J. Agric. Sci. Technol., 10: 439-460.
Direct Link - Prakash, A., 2000. Thermal remote sensing: Concepts issues and applications. Int. Arch. Photogramm. Remote Sens., 33: 239-243.
Direct Link - Reddy, C.S., M. Rangaswamy and C.S. Jha, 2008. Monitoring of spatio-temporal changes in part of Kosi River Basin, Bihar, India using remote sensing and geographical information system. Res. J. Environ. Sci., 2: 58-62.
CrossRefDirect Link - Ruzinoor, C.M., A.R.M. Shariff, A.R. Mahmud and B. Pradhan, 2011. Online 3D terrain visualization: Implementation and testing. J. Applied Sci., 11: 3247-3257.
Direct Link - Ruff, S.W., P.R. Christensen, P.W. Barbera and D.L. Anderson, 1997. Quantitative thermal emission spectroscopy of minerals: A laboratory technique for measurement and calibration. J. Geophys. Res., 102: 14,899-14,913.
CrossRef - Sinha, A.K., 1986. Spectral reflectance characteristics of soil and its correlation with soil properties and surface conditions. J. Ind. Soc. Remote Sensing, 14: 1-9.
CrossRef - Soleimani, K. and S. Modallaldoust, 2008. Production of optimized DEM using IDW interpolation method. J. Applied Sci., 8: 104-111.
CrossRefDirect Link - Tagil, S. and J. Jenness, 2008. GIS-based automated landform classification and topographic, landcover and geologic attributes of landforms around the Yazoren Polje, Turkey. J. Applied Sci., 8: 910-921.
CrossRefDirect Link - Weidong, L., F. Baret, G. Xingfa, T. Qingxi, Z. Lanfen and Z. Bing, 2002. Relating soil surface moisture to reflectance. Remote Sens. Environ., 81: 238-246.
CrossRefDirect Link - Weng, Q., D. Lu and J. Schubring, 2004. Estimation of land surface temperature-vegetation abundance relationship for urban heat island studies. Remote Sens. Environ., 89: 467-483.
CrossRefDirect Link - Weng, Q., H. Liu and D. Lu, 2007. Assessing the effect of land use and land cover patterns on thermal conditions using landscape metrics in city of Indianapolis, United State. Urban Ecosyst., 10: 203-219.
Direct Link - Yaro, D.T., T. Kparmwang, B.A. Raji and V.O. Chude, 2006. The extent and properties of plinthite in a landscape at zaria, Nigeria. Int. J. Soil Sci., 1: 171-183.
CrossRefDirect Link