
Orhan Dengiz
Not Available
International Journal of Soil Science
Year: 2007 | Volume: 2 | Issue: 1 | Page No.: 15-28


ABSTRACT
The soil productivity model estimates crop productivity taking into consideration of soil characteristics which affect root development. Another important application of this model is to predict erosion effects on soil productivity. On the other hand, many models include only quantitative estimates on the relationship between soil erosion and soil productivity at the plot scale and do not allow at the regional or catchment scale. Therefore, the main purpose of this study was to determine relationships between soil productivity and erosion risk status at catchment scale using GIS program. The results show that while about half of the study area (43.4%) has high and very high PI levels, 16.4% has moderate and 40.2% has low PI level. In addition, while 40.1% of the study area has under moderate erosion, 37.4% of the area has high and very high and only 22.5% has low potential soil erosion risk. Moreover, this model can be used by producing useful information for evaluation and planning of a sustainable land use.
PDF Abstract XML References Citation
How to cite this article
Orhan Dengiz, 2007. Assessment of Soil Productivity and Erosion Status for the Ankara-Sogulca Catchment Using GIS. International Journal of Soil Science, 2: 15-28.
DOI: 10.3923/ijss.2007.15.28
URL: https://scialert.net/abstract/?doi=ijss.2007.15.28
DOI: 10.3923/ijss.2007.15.28
URL: https://scialert.net/abstract/?doi=ijss.2007.15.28
INTRODUCTION
The effects of soil erosion on crop productivity are not only local or regional concern but also global problem owing to finite soil resources. Therefore, accurate estimates of soil productivity and soil erosion are significantly important for sustainable land resources planning. The productive capacity and erosion risk of soils can be evaluated directly or indirectly. Direct evaluations are carried out in the field, greenhouses or laboratory by means of some experiments under given climatic and management conditions. Indirect evaluations consist basically in developing and applying models of varying complexity, thereby attempting to estimate productivity and soil erosion based on soil and crop condition under defined environmental and management situations (Delgado and Lopez, 1998). Although losses of topsoil by erosion are widely considered to reduce crop productivity, this has not been well quantified over a wide range of soils (Wilson et al., 1991). Another way to view this concept is quantitative estimates on the relationship between soil erosion and crop productivity, however, are made only at the plot scale and do not allow for general conclusions due to the large variability in outcomes in other words; at the regional or catchment scale no quantitative estimates have been made on the relationship between soil erosion and productivity.
One of the most dangerous characteristics of the erosion-productivity problem is its difficulty of detection (Langdale et al., 1985) since erosion is generally a gradual process and because of the long time spans involved. Therefore, productivity reducing may not be recognized until land is no longer economically suitable for growing crops. Moreover, erosion effects on productivity are often obscured of masked by technological innovation such as new crop varieties, fertilier technology, more efficient agronomic practices etc. (Stone et al., 1985; Schumacher et al., 1994). Therefore, modelling techniques have been very important role to predict erosion and productivity status of the soils in future.
A number of models and approaches have been developed such as lumped parameter model proposed by Craft (1984), NTRM (Nitrogen Tillage Residue Management) model proposed by Shaffer et al. (1982) and EPIC (Erosion Productivity Impact Calculator) proposed by Williams et al. (1984), which attempt to numerically relate a soil’s properties, its productivity and erosion (Laflen et al., 1985; Gantzer and Mclarty, 1987; Pierce and Lal, 1994; Mulengera and Payteon, 1999). One of these models is also PI (Soil Productivity Index) based on the assumption that optimum crop yield is a function of root growth which in turn is controlled by soil environment and evaluation a soil’s vulnerability by simulated removal of soils (Wilson et al., 1991; Lindstrom et al., 1992; Delgado, 2003; Udawatta and Henderson, 2003).
Today advanced computer programs including decision support systems (Geographic Information System and Remote Sensing) contribute to the speed and efficiency of the overall planning process and allow access to large amounts of information quickly. Especially during the last decade, GIS and RS have received much attention in application related to resources at large spatial scales (Green, 1995; Hinton, 1996).
Most of the basins or catchments have insufficient data to make conservation planning for sustainable agricultural land uses in Turkey. Thus, it is necessary quantitative model that allows easily estimate soil productivity and forecast the water erosion risk on large areas with limited data. In this sense, in order to make plan for sustainable agriculture in the Sogulca catchment especially affected by intensive agricultural activities and severe soil erosion risk, PI model was selected.
Consequently, the purposes of this research were: (i) to create database system for the study area, (ii) to evaluate the relative soil productive potential of the study area’s soils, (iii) to determine potential soil erosion risk status, (iv) to prepare a future conservation land management plan using soil productivity model selected soils in Ankara-Sogulca catchment.
MATERIALS AND METHODS
Field Description
Sogulca watershed is of about 56.8 km2, which is geographically located between 446000 E-4362000 N and 456000 E- 4356000 N and occupied a depression in the dry central plateau (Central Anatolia) of Turkey, 80 km southwest of Ankara (Fig. 1). 46.2% this total area has been used for rainfed agricultural practices and 52.7% of it is rangeland. Only 1.1% is water surface. Average sea level altitude ranges from 948 to 1382 m. The study area consists of various topographic features (flat, hilly, rolling etc.) and slope varies between 2-30%. Hilly and rolling physiographic units are particularly common in the study area. Average annual precipitation and temperature are 456.7 mm and 11.1°C, respectively. There are three villages, Gedik, Evcik and Tabaklı in Sogulca catchment. The study area has mesic soil temperature and xeric soil moisture regime, according to Soil Taxonomy (Soil Survey Staff, 1999). Quaternary new alluvium deposits formed on both sides of Sögütcesme stream and Palaeocene formations generally distributed north and south parts and composed of limestone and sandstone occur in Sogulca catchment. There are 8 different soil series in the study area and they were classified as Inceptisol (37.9%) and Entisol (60.8%).
Methods
Study was carried out mainly in two phases; (i) Model analyses (ii) Database creating and mapping process. In first step, qualitative approach was consisted of the two important land quality indexes which are soil productivity and soil erosion risk and conservation planning.
Soil Productivity Index
The basic concept of this method is that agricultural-soil productivity, under optimal management conditions, depends on the intrinsic characteristics (Riquier et al., 1970). In other words, as a general concept, soil productivity is also the capacity of a soil to support plant growth under a specific management system Delgado (2003).
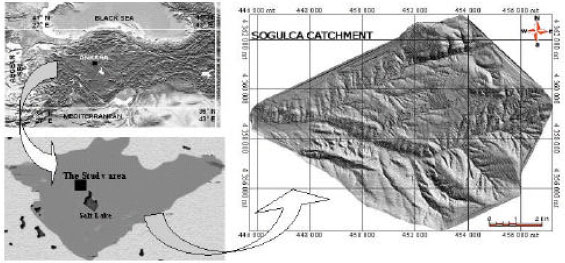 | |
| Fig. 1: | Location of the study area |
The main assumption in this model is that vertical root distribution is fully expressed under optimum soil-site conditions and these results in optimum productivity. The soil productivity index is calculated with the following multi-factorial model:
where PI is soil productivity index and has a range value of between 0 and 1. The least favour value of PI is 0 and the most beneficial value of PI is 1 for root growth. In other words, the limiting nature of each PI classes is taken into account by its effect in reducing productivity (Table 1).
PI includes four basic parameters and presented in Fig. 2. 1- Ai evaluates conditions that regulate the air-water condition of horizon I. 2- Bi is the parameter which relates with mechanical resistances to root development in horizon I. 3- Factor Ci evaluates the potential fertility condition of horizon I and finally 4-Factor Ki evaluates weighting factor of the respective horizon and also the importance of soil depth.
As it can be seen Fig. 3, each of parameters of Ai, Bi and Ci is composed two sub-factors. The selection of the specific sub-factor depends on local conditions that are climate (precipitation and evapotranspration) and soil properties. In this sense, the following relations must be taken into account:
Factor A
Plant available water holding capacity (water retained at a suction of between -33 and -1500 KPa)
| • | A1 subfactor: In dry climate (P/EPT< 0.5) or, | A1 = 0.05 W; 0< W <20 A1 = 1.00; W > 20 W: available water content (%) |
| Table 1: | Ranking soil productivity and class in terms of the PI |
 | |
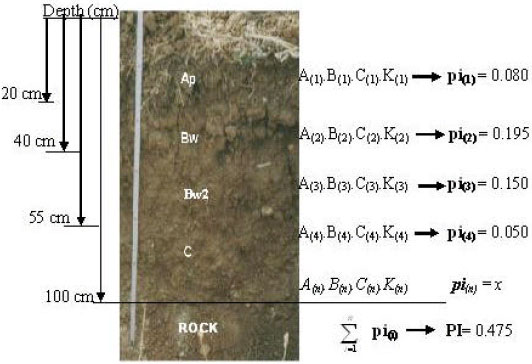 | |
| Fig. 2: | Selected profile for calculation of soil’s PI value |
 | |
| Fig. 3: | Cumulative weighting factor |
| • | A2 subfactor: In humid climate (P/EPT> 2.0) or, |
| • | For soils with a weak structure: | If clay = 20% A2 = 1.0-0.01 (cl) If clay > 20% A2 = 1.2-0.02 (cl) |
| • | For soils with a moderate structure: | If clay = 30% A2 = 1.0-0.0066 (cl) If clay > 30% A2 = 1.0-0.016 (cl) |
| • | For soils with a strong structure: | If clay = 40% A2 = 1.0-0.005 (cl) If clay > 40% A2 = 1.3-0.0133 (cl) cl: clay content |
| • | Between A1 and A2: In subhumid to dry climate (0.5<P/EPT<2.0). Factor A must be most limiting value (the lowest numerical value). |
Factor B
B1 subfactor: Volumetric coarse fragments in soil less than or equal to 30% or,
Bulk density of the soil as related to texture type.
| • | For fine texture (clayey, fine silty) |
| B1= 3.6-2 (BD) 1.30 = BD = 1.40 |
| B1= 9.6-6 (BD) 1.40 = BD = 1.60 |
| • | For medium texture (loamy, coarse silty) |
| B1= 1.87-0.67 (BD) 1.30 = BD = 1.55 |
| B1= 6.0-3.33 (BD) 1.55 = BD = 1.80 |
| • | For coarse texture (coarse loamy, sandy) |
| B1= 1.52-0.4 (BD) 1.30 = BD = 1.55 |
| B1= 8.0-4.0 (BD) 1.80 = BD = 2.00 |
| • | B2 subfactor: Volumetric coarse fragments in soil more than 30 %. |
| B2= (1-ƒ)r |
Where ƒ: Fraction of coarse fragments (volume)
r: Coefficient of root exploratory capacity (Table 2)
Factor C
| • | C1 subfactor: In humid climate (P/EPT> 2.0) or, | ||
| C1 = 0 | if | pH < 2.8 | |
| C1 = 0.50 (pH)-1.35 | if | 2.8 = pH = 4.5 | |
| C1 = 0.45 + 0.1 (pH) | if | 4.5 < pH = 5.5 | |
| C1 = 1 | if | 5.5 < pH = 7.0 | |
| C1 = 1.905-0.13 (pH) | if | 7.0 < pH = 8.5 | |
| C1 = 4.2-0.4(pH) | if | 8.5 < pH = 10.5 | |
| C1 = 0 | if | pH > 10.5 | |
| pH: pH in the soil-water extract, relation 1:1 | |||
| • | C2 subfactor: In dry climate (P/EPT< 0.5) or, C2= 1-e-ax Where x = Organic matter content (%) | |
| a =Clay coefficient (Table 3) | ||
| Table 2: | Values of the coefficient r for the calculation of sub-parameter B2 |
 | |
| Table 3: | Values of coefficient a for the calculation of subfactor C2 |
 | |
| • | Between C1 and C2: In subhumid to dry climate (0.5 < P/EPT< 2.0). Factor C must be most limiting value (the lowest numerical value). |
Factor K
| • | Factor K, as shown Fig. 3, is the cumulative weighting factor of the respective horizon I and is calculated as following; Kcum = 0.024 X0.82 → K(i) = Kcum (i).- Kcum (i-1) Where Kcum = Cumulative weighting factor up to horizon i. X = Maximum depth of horizon i (cm). |
Soil Erosion Risk and Soil Conservation Planning
The approach takes into consideration three basic factors for estimating the vulnerability of a soil to water erosion. These factors are soil hydrological characteristics (infiltration-runoff ratio), rainfall intensity and slope. The Erosion Risk Index (ERI) is calculated with the following equation;
where η: The value of the factor is determined by the interaction between train slope and the Fournier index (Fournier, 1960; quoted by FAO-PNUMA, 1980). It is determined with the following equation;
where F is the Fournier index, p is the highest monthly precipitation (mm) and P is the annual precipitation (mm). η value is obtained from Fig. 4.
α: This factor evaluate the soil runoff that has significantly relationship with topsoil structure. Value α is obtained from Fig. 5.
 | |
| Fig. 4: | Factor η of the erosion risk index |
 | |
| Fig. 5: | Factor α of the erosion risk index |
 | |
| Fig. 6: | Schematic chart of GIS application |
Each factor is evaluated ranging from o to 1, corresponding 1 to the condition that potentially promotes the highest occurrence of water erosion processes. Relative values for the water erosion of a land unit, estimated by means of the Erosion Risk Index ERI, can be classified as indicated in Table 1.
Database Creating and Mapping Process
In second step, GIS and RS or image processing software packages (TNT Mips v6.4, 1999) were used to handle process and generate topographic (DEM) layer, soil productivity, soil erosion and land classification maps, respectively. Soil productivity and soil erosion models requirement soil data were taken from 1:25.000 scaled digital soil map. The diagnostic factor of topography is combination of land form and slope gradient that were extracted from satellite imagery and topographic map. Each land characteristics is considered as a thematic layer in the GIS. Each of land qualities with associated attribute data is digitally encoded in a GIS database to generate PI and ERI layers. These two layers then spatially overlaid to produce a resultant polygon layer (Fig. 6).
RESULT AND DISCUSSION
Physical and Chemical Properties
Some physical and chemical properties of the soil series are presented in Table 4. Effect of topography and landscape position on soil thickness has been reported by many researchers (Benny and Stephens, 1985; McIntosh et al., 2000; Power et al., 1981; Rezaei and Gilkes, 2005). While the deepest soil formed on low slope class (2-4%), shallow soils cover on steep slope, which is the obvious effect of soil erosion process. Toprak Tepe, Dolga Tepe and Kamıslık Tepe series have high slope gradient (20-30%) and low profile thickness. Most of the soil texture of the study area is clay except for Dolga Tepe and Kamıslık Tepe soil series which include clay loam texture. In addition, while the highest values of coarse fragment (Cfm) which varies between 65.7-81.2% belongs to Toprak Tepe, Dolga Tepe and Kamıslık Tepe soil series, the other series have low values of Cfm.
| Table 4: | Some physical, chemical and morphological properties and classes of the soil series |
 | |
A logical reason of this event is that in high slope (> 20%) runoff processes are dominant.
Soil profile thickness, structure and soil clay content are important parameters for water retention. Benny and Stephens (1985) reported that soil profile thickness was considered an effective element in determining soil quality, especially considering storage of plant available water and nutrients. Rezaei and Gilkes (2005) also indicate that this case is a very important soil physical property especially for rangelands, which usually receive no artificial fertilizer. Particular steep lands (Dolga Tepe and Kamıslık Tepe soil series) have low AWC (6.4-8.2%) and less stable structure.
Soil organic matter content has very important effects on soil structure, aeration, water holding capacity and chemical properties. Organic matter changes between 0.72-4.20% in topsoils of the soil series. However, these ratios are steadily decreasing from surface to down. Besides pH values varies between 7.50 and 8.12 in all series.
Sögüttepe Çeşme series has deep soil profile, heavy texture and strong structural development. Main problems of this soil are poorly drainage and low aeration capacity. Therefore, root development is insufficient especially after 60 cm depth. Gedikli, Tabaklı and some part of Berensırtı soil series have deep soil profile, low slope gradient and well structural and root development. Toprak Tepe, Karlıkdagı Tepe, Kamıslık Tepe and some part of Dolga Tepe soil series have shallow and moderate soil depth. Their main root growing limited factors are steep slope (>30%), low water retention capacity and high CFr percentage.
It was detected that under surface layer (Ap-plough layer) has higher BD than its lower and upper layer BD without textural changing in most of the all agricultural lands due to machine traffic and tillage implements, which lead to reduce diffusion water and gasses, drainage, root growth and crop yield. Therefore, timing of farming operation, increased equipment size and power which tent to increase compaction problems have an important impact on productivity. This compaction causes increasing erosion especially during too wet clay soil.
It was observed surface sealing and crusting in Gedikli and Karlıkdağı series. Degradation of soil structure due to intensive field traffic, as above mentioned, increases also soil erodibility, reduce infiltration that provides less opportunity for soil water storage. On the other hand, well structured soils and soils with macro pores and fractures provide a pore network for root growth (Logsdon et al., 1992) and water infiltration, often resulting in no yield reduction, even when the soil is compacted (Logsdon et al., 1992; Kaspar et al., 1995).
Soil Productivity, Erosion Risk and Land Classification System
Soils series used in this study for the evaluation of PI, ERI and LCS are presented in Table 6 and their maps shown in Fig. 7-9, respectively. Table 6 shows the soil properties of the study area soils with different levels of soil erosion used to assess the Productivity Index (PI). Those properties area the result of different erosion levels caused by different number of years under rainfed farming system. The result indicated that while about half of the study area (43.4%) has high and very high PI levels that located on Gedikli, Tabaklı and Berensırtı soil series, (Fig. 7) the rest of the study area has moderate and low PI level. This case can be explained that the PI is highest in the lightly eroded soil, whereas the severely eroded soil shows the lowest PI level.
Slope is undoubtedly one of the most important determinants of soil erosion. Erosion only occurs when slope exceeds a critical angle and it increases with the absence of vegetation cover. Slope groups derived from DEM. According to results, 26.7% of the study area has less than 12% slope (very gentle and gentle) found on Sögütcesmesi, Berensırtı, Gedikli and Tabaklı soil series, 24.2% has moderate slope (12-20%) and 49.1% has varying from steep to very steep, from which runoff can easily occur. Steep and very steep areas are located on Toprak Tepe, Dolga Tepe and Kamıslık Tepe soil series.
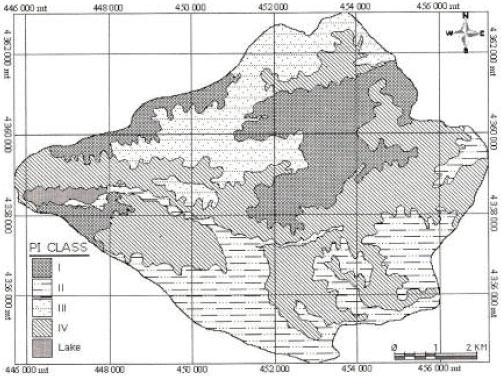 | |
| Fig. 7: | Soil productivity map of the study area |
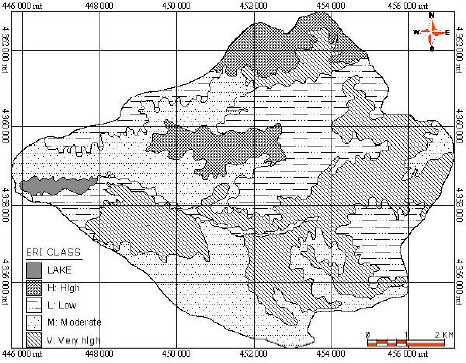 | |
| Fig. 8: | Soil erosion risk map of the study area |
| Table 5: | Productivity index (PI), erosion risk index (ERI) and land classification system (LCS) of the soil series |
 | |
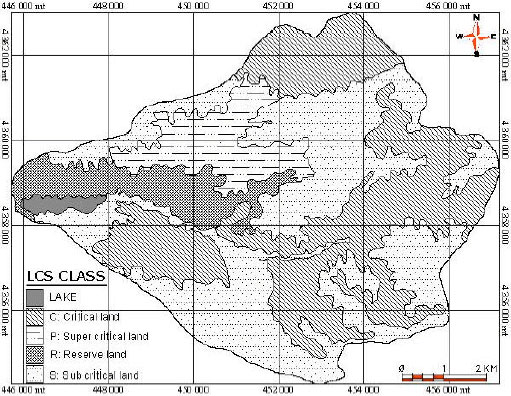 | |
| Fig. 9: | Land classification system for soil conservation |
It was found that there is a negatively linear relationship between PI and ERI. Whereas some soil series have low PI values, potential erosion risk status of this soil has high due to landscape position and high slope gradient. Table 5 shows that while approximately half of the study area has under moderate erosion, 37.4% of the area has high and very high and only 22.5% has low potential soil erosion risk.
According to Table 6, land classification map including reserve land (R), critical lands (C), sub critical land (S) and super critical land (P) classes was produced after overlaying of soil productivity and erosion layers and the results are presented (Fig. 9). Land classification map results showed that reserve, critical and sub critical lands of the study area are 531.3, 2126.0 and 3372.8 ha, respectively and only 558.5 ha of the study area is super critical land.
| Table 6: | Land classification system for soil conservation planning (LCS) |
 | |
Main limitation factors of the soil series were detected in the analysis of factors corresponding to soil productivity and soil erosion risk. To reduce such risks and to improve land conditions, some alternative applications were suggested for each soil series. Since Toprak Tepe, Dolga Tepe, Kamıslık Tepe and some part of Karlıkdag Tepe soil series have all most the same restricted root growing factors such as shallow soil depth, high Cfm and weak structure and so on, they require similar soil conservation managements which are considerable for reducing runoff velocity and improvement soil condition such as mulch-tillage, residue incorporation, organic manures, contour cropping, diversion channels, retention ditches, retention terraces, diversion terraces, contour furrows etc. It was detected low aeration capacity and high BD under surface soil for heavy clay textures soils such as Gedikli, Sögüttepe Cesmesi, Tabaklı and some part of the Berensırtı soil series due to intensive field traffic. Particularly, reduce tillage, deep ploughing, organic manure, residue incorporation, surface and sub surface drainage were recommended for these soils to easily rood and water diffuse in soil profile. In addition proper timing especially in planting, the farmer should wait until soils are dry enough to permit tillage.
CONCLUSION
Integration of among soil properties, landscape position and climatic factors that affect crop growth is very important to provide a useful estimate of erosion-productivity relationships for yield in the Ankara-Sogulca catchment. The model also promises to give reliable prediction and requires not sophisticate database as well as to allow identification and selection of the most appropriate alternatives soil conservation programs. Therefore, PI model an attractive method for predicting erosion influence on soil productivity. Because, researches to determine the effects of soil erosion on crop production have generally been limited for two reasons; the difficulty in acquiring useful information over vast areas and the lack of a means for effective process and analyse the acquired data (Champbell, 1987). In addition, during data collection, analysis, manipulation and using manual methods require too much cost and time consuming. Today advanced computer programs such as Geographic Information System and Remote Sensing contribute to the speed and efficiency of the overall planning process and allow access to large amounts of information quickly (Dengiz and Akgül, 2005). It is also very easy to update or modify data involved in GIS database in future.
REFERENCES
- Delgado, F. and R. Lopez, 1998. Evaluation of soil development impact on the productivity of Venezuelan soils. Adv. GeoEcol., 31: 133-142.
Direct Link - Kaspar, T.C., S.D. Logsdon and M.A. Prieksat, 1995. Traffic pattern and tillage system effects on corn root and shoot growth. Agron. J., 87: 1046-1051.
Direct Link - Lindstorm, M.J., T.E. Schumacher, A.J. Jones and C.J. Gantzer, 1992. Productivity index model comparison for selected North Central region soils. J. Soil Water Conserv., 47: 491-494.
Direct Link - Logsdon, S.D., R.R. Almaras, W.W. Nelson, W.B. Voorhees, 1992. Persistence of subsoil compaction from heavy axle loads. Soil Tillage Res., 23: 95-110.
Direct Link - McIntosh, P.D., I.H. Lynn and P.D. Johnstone, 2000. Creating and testing a geometric soil landscape model in dry steep lands using a very low sampling density. Aust. J. Soil Res., 38: 101-112.
Direct Link - Mulengera, M.K. and R.W. Payton, 1999. Modification of the productivity index model. Soil Tillage Res., 52: 11-19.
Direct Link - Rezaei, S.A. and R.J. Gilkes, 2005. The effects of landscape attributes and plant community on soil physical properties in rangelands. Geoderma, 125: 145-154.
Direct Link - Schumacher, T.E., M.J. Lindstrom, D.L. Mokma and W.W. Nelson, 1994. Corn yield: Erosion relationships of representative loess and till soils in the North Central United States. J. Soil Water Cons., 49: 77-81.
Direct Link - Udawatta, R.P. and G.S. Henderson, 2003. Root distribution to soil properties in Missouri Oak stands. Soil Sci. Soc. Am. J., 67: 1869-1878.
Direct Link - Wilson, P.J., P.S. Sandor and G.A. Nielsen, 1991. Productivity index model modified to estimate variability, of Montana small grain yields. Soil Sci. Soc. Am. J., 55: 228-234.
Direct Link