
S. Cerrate
Aviagen Inc. Huntsville, AL. 920 Explorer Blvd. NW. Huntsville, AL 35806, USA
A. Corzo
Aviagen Inc. Huntsville, AL. 920 Explorer Blvd. NW. Huntsville, AL 35806, USA
International Journal of Poultry Science
Year: 2019 | Volume: 18 | Issue: 1 | Page No.: 28-38


ABSTRACT
Background and Objective: It seems that current broiler chickens have modified the dietary nutrient needs and body composition over time. Further, the relationships between dietary nutrients and feed cost or biological nutrient requirements are unknown. The aim of this study was to understand and explain current energy and amino acid tendencies of dietary levels and requirements, to evaluate relationships between dietary energy and lysine among levels, feed cost and requirements and to compare energy and lysine efficiency from 2001-2017. Methodology: Data from literature were evaluated to predict the dietary ME and amino acids as well as the body fat content by multiple regression. Actual dietary ME and digestible lysine levels were linearly regressed with diet cost and ME and lysine requirements. Efficiencies of lysine and ME were calculated taking into account the broiler genetic improvement through body composition. Results: Dietary energy levels have been reduced at a rate of 5 kcal per year while digestible lysine has increased by 0.009% per year from 2001-2017. Nutritionists during the process of selecting dietary energy and lysine levels have been influenced by feed cost (r2 = 0.75) and lysine requirements (r2 = 0.86), respectively. During a period of 16 years, modern broiler chickens deposit less body fat (-6% of body weight) and more body protein (+4% of body weight) and convert energy and amino acids into meat more efficiently than older broiler genotypes. Conclusion: These data indicate that dietary energy and lysine are reduced and increased, respectively, influenced by feed cost and requirements, resulting in better energy and lysine efficiencies due to feed intake and body composition changes.
PDF Abstract XML References Citation
Received: May 04, 2018;
Accepted: October 06, 2018;
Published: December 15, 2018
Copyright: © 2019. This is an open access article distributed under the terms of the creative commons attribution License, which permits unrestricted use, distribution and reproduction in any medium, provided the original author and source are credited.
How to cite this article
S. Cerrate and A. Corzo, 2019. Lysine and Energy Trends in Feeding Modern Commercial Broilers. International Journal of Poultry Science, 18: 28-38.
DOI: 10.3923/ijps.2019.28.38
URL: https://scialert.net/abstract/?doi=ijps.2019.28.38
DOI: 10.3923/ijps.2019.28.38
URL: https://scialert.net/abstract/?doi=ijps.2019.28.38
INTRODUCTION
Globally, different energy and amino acid levels are used in different regions, although it is unknown the magnitude by which these dietary nutrients are influenced by feed cost or biological nutrient requirements. Furthermore, a study that explains nutrient trends, body composition and nutrient efficiency in one systemized approach over time as a way to gain insight into the future should shed light on biological mechanisms in modern broiler chickens.
As compared to slow growing birds, fast growing birds require more amino acids1 or methionine2 but less dietary energy3. However, these differences cannot be extrapolated to evaluate the magnitude of dietary nutrient changes in current broiler chickens. Many peer-reviewed papers studying nutrient needs from the last few years could be compiled and analyzed to calculate the genetic progress and future nutrient trends. Furthermore, a comparison between commercial nutrient levels and biological nutrient requirements could be analyzed which may suggest what is the main driving force that dictates nutrient levels used in the field. On the other hand, it seems that genetic progress has changed body composition significantly. The body protein can be accurately predicted by breast meat regardless of sex and broiler strains4, whereas the body fat can be affected by sex, type of feed, age and strains4-7. Body fat was, for example, reduced in chickens with improved feed conversion or faster growth rates compared to birds of poorer feed conversion or slower growth rates8,9. In contrast, the carcass protein is enhanced by genetic progress3. However, when the breast yield is less than 15% of body weight (BW), the carcass protein is similar between chickens of fast and slow growth rate3,9,10. The objectives of the present study were to understand and explain current energy and amino acid tendencies of dietary levels and requirements, to evaluate relationships between dietary energy and lysine among levels, feed cost and requirements and to compare energy and lysine efficiency from 2001-2017.
MATERIALS AND METHODS
Metabolizable energy (ME) lysine and body fat: Data from literature were evaluated to quantify the ME and amino acids (AA) requirements for broiler starter, grower and finisher feed. The data were obtained from peer-reviewed journals and from performance results of 2 research studies at Aviagen Inc (unpublish data). The main criteria used for article selection were the following: a) commercial broiler chickens (Avian, Cobb, Hubbard and Ross), minimum of 3 nutrient levels and normal temperature or moderate heat stress. For each article, the year of publication, start and end period of each feeding phase, lysine or ME requirements, dietary ME, digestible lysine (dLys), dietary protein and body fat were included in the database. Further, other variables (genetic strains, feed form, sex, feed conversion, live body weight, body weight gain and method of estimated requirement) were registered to allow a more descriptive analysis. The nutrient requirements were recorded according to published journals using linear broken line, quadratic broken line, quadratic polynomial regression or difference of means based on feed conversion, body weight gain and breast muscle yield. The energy database included articles between 1996 and 2016, containing equal levels of amino acids11-32. The database for lysine requirements included journals considering constant amounts of amino acids between 2001 and 201718,33-67 and changing the amino acids proportionally to lysine between 2001 and 201441,68-77. The body fat database included studies between 1991 and 2014, including the year of publication, broiler age, dietary ME, dLys and dietary crude protein (CP) as independent variables4-6,65,73,78-88.
Comparisons among diet cost, dietary and requirements of lysine and energy: Average nutrient requirements were calculated to show trends over time using the following variables: year range (2001-2017), starter period between 0-10 days, grower period between 11-25 days and finisher period between 26-39 days and assuming feed intake proportions of 7.1, 30.2 and 62.8%, respectively. Thus, the actual ME or dLys values and diet costs were obtained from a US industry reporting service89.
Body composition: Body fat was calculated from year, age and ME/dLys. Body protein was calculated from breast muscle yield using an allometric relationship between breast and body protein (lnBreast meat weight = -2.379 +1.409xlnbody protein weight) as described by Danisman and Gous4 and breast meat yields reported by Agri Stats89.
Lysine efficiency: Efficiencies of dlys from 2001 and 2017 were calculated considering the lysine used for maintenance and deposited for protein gain.
 |
where 35.73 mg/kg0.75/day was developed from data of Fatufe et al.38 (dLys intake = 35.73+1.337×[Lysine accretion], r2 = 0.97).
Lysine for protein gain (g/period) = [6.7/100×protein gain]×[# days to reach 2268 g], calculated using 6.7% of lysine for whole body protein from Fatufe et al.38, protein gain as difference between gain at day 1 and market age of 2268 g (2268×body protein/100-40×16/100) and # days to reach 2268 g as division between target weight and body weight gain per day (2265 g/[body weight gain, g day–1]).
Digestible lysine intake was calculated as follow:
dLys intake = Actual dietary dLys (%)×(FCRadj×2265)/100
where, the feed conversion adjusted by target body weight (2265 g) (FCRadj) was calculated as:
FCR adj = FCRactual+[(2265-BWactual)/45×0.01]
where, 45 g difference in BW is equivalent to 1 point or one hundredth of FCR, as described by Lesuisse et al.90
where, actual BW and FI from 2001-2017 as reported by Agri Stats89.
Energy efficiency: Efficiencies of energy from 2001 and 2017 were calculated as the energy used for gain and maintenance:
Efficiency of ME for gain and maintenance = [net energy for body gain and maintenance]/MEintake×100
where, net energy for body gain was calculated using the body protein (BP) and body fat (BF) gain and their corresponding caloric values of 5.66 and 9.35 kcal g–1 respectively, as described by Fraps and Carlyle91.
Net energy for body gain = 5.66×(2268×BP) + 9.35×(2268×BF)
Net energy for maintenance = 1.15×90×[(2268+40)/2]0.75 ×[# days to reach 2268 g]
where, 90 kcal kg–1 0.75 as reported by Sakomura et al.92 and assuming 15% more of physical activity.
ME intake = Actual dietary ME (kcal kg–1)×FCRadj×2265
Nutrient efficiencies: Nutrient efficiencies in relation to a year were calculated as follows:
where, nutrients were ME intake, dLys intake, energy requirement (NEm+NEgain) and lysine requirement (dLys for maintenance and protein gain).
Design of the analysis: Actual dietary ME and dLys levels were linearly regressed with diet cost and requirements of ME and dLys. To gain insight into possible future nutrient needs, efficiencies of dLys and ME were calculated taking into account the broiler genetic improvement through body composition for each year from 2001-2017. Body protein was estimated from breast meat yield, and body fat was calculated by multiple regressions in function of year, age, dLys, protein, ME/dLys or ME/CP. Further, ME intake, dLys intake, energy requirement (NEm+NEgain) and lysine requirement (dLys for maintenance and protein gain) were plotted against one specific year to observe the trends during the time. The actual dietary ME, digestible lysine, breast muscle yield, BW and FI were retrieved from a US industry reporting service89 from 2001-2017. Because the genetic selection pressures on feed conversion and body composition had reduced the numbers of days to reach market weights, the nutrient intakes and efficiencies were adjusted to 2265 g of body weight, removing the age of market weight during the trends.
Statistical methods: Multiple linear regressions for estimating energy and digestible lysine requirements and linear regressions to evaluate the determination between dietary and requirement of ME and dLys were obtained using JMP Software93. Further, coefficients for year and market age, dietary ME, dLys, CP, or ME/dLys to estimate body fat were plotted by multiple linear regressions. Regression coefficients were compared among independent variables using confidence intervals derived from the SE of respective regression coefficients94.
RESULTS AND DISCUSSION
Energy and lysine requirements: The energy and lysine requirements were statistically influenced by year and age (Table 1). Coefficients of lysine and amino acid (AA) requirements, though numerically higher, were statistically similar to those of lysine needs with constant levels of AA. Lana et al.41,42 reported that lysine requirements based on equal lysine: AA ratios were higher than lysine needs based on constant levels of AA (+3% starter or +6% grower). Herein, similar increments of lysine requirements (+6% starter and +4% in grower) were found when lysine and AA were adjusted proportionally as compared to constant dietary AA.
| Table 1: | The energy and lysine requirements predicted from year and age period |
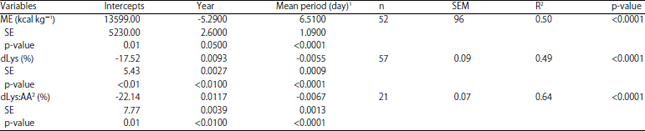 | |
| 1Mean period for energy and lysine needs is middle age of feeding period and for body fat, the period age is the final broiler age, 2dLys:AA: digestible lysine and amino acids were formulated proportionally | |
| Table 2: | Linear regression analysis comparing dietary energy and lysine with diet cost or lysine and energy requirement |
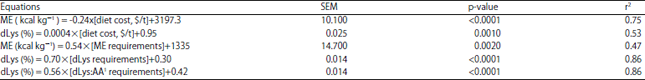 | |
| 1dLys:AA: Digestible lysine and amino acids were formulated proportionally | |
Nutrient requirement trends depict mainly the expression of genetic advancements for commercial broiler chickens used in the poultry industry. From the previously described, during each feeding phase, the ME needs are being lowered by 5 calories per year, while dLys levels have been increased by 0.009% per year. Further, trends in the US industry show that dietary ME and dLys levels in broiler diets are displaying opposite trends. From 2001-2017, dietary ME has shown a tendency of being reduced by 38 kcal kg–1 or 2.4 kcal year–1, whereas dLys has shown to be increased by 0.12 or 0.008% per year (Fig. 1). Even though, the lysine requirement increment per year originated from different countries matches closely to the commercial dLys which represent values from the US poultry industry. In line with current reviewed tendencies, Wen et al.2 demonstrated that fast growing broiler chickens need more dietary methionine compared to slow growing chickens. On the other hand, a more efficient digestion of energy in modern chickens with good FCR compared to those with poor FCR95,96 suggest that modern chickens metabolize nutrients more efficiently and might need less dietary energy as suggested herein. Furthermore, a pair-fed study indicated that the dietary energy levels needed to improve feed conversion were lower in modern broiler chickens (3200 vs 3400 kcal kg–1) than those in random bred chickens3. As broiler chickens age, the energy needs are increased by 6.5 kcal day–1, whereas the digestible lysine is reduced by 0.006% per day. In agreement with these trends, lysine and energy requirements are reduced and increased, respectively, as broiler chickens aged22,35,68.
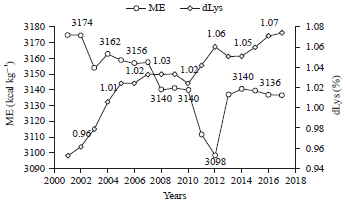 | |
| Fig. 1: | Trends of ME and digestible lysine (dLys) in the poultry industry (adapted from a US industry reporting service91). The dLys was calculated from total lysine with an average digestibility of 0.89%, based on ingredients typically used in broiler chickens109 |
Associations among diet cost, energy and lysine requirement: The relationship between dietary ME and diet cost, for example, indicates that when feed cost is higher, dietary ME is lower. The higher best fit to predict energy from feed cost (r2 = 0.75) suggests that dietary ME over time is being driven by feed cost (Table 2). Other economic variables such as broiler meat price might also influence the dietary energy selection97,98. Conversely, a smaller coefficient of determination (r2 = 0.53) is observed when predicting dLys from average feed cost as compared to dietary ME, inferring that other variables may be associated with the behavior of dLys values in recent years. When considering the relationship between average nutrient requirements and actual poultry industry nutrient levels, it seems that the actual dLys level is primarily influenced by dLys requirements (r2 = 0.86) but actual dietary ME is less related to actual ME requirements (r2 = 0.47).
| Table 3: | Prediction of body fat, (%BW) from year, age, dietary energy, lysine and protein |
 | |
| 1aintercept. Age: last day of experimental trial. P: p-value, **<0.001, *<0.01. a,bValues within columns having superscripts letters differ significantly (p<0.05) according to confidence interval.2Digestible lysine and amino acids were changed proportionally | |
According to these associations, it can be inferred that decisions made by commercial nutritionists for selecting ME values are mostly influenced by feed cost, whereas dLys values are mainly influenced by amino acid requirements. Both coefficients of dLys and dLys:AA requirements showed similar significance and r2 for predicting dietary dLys.
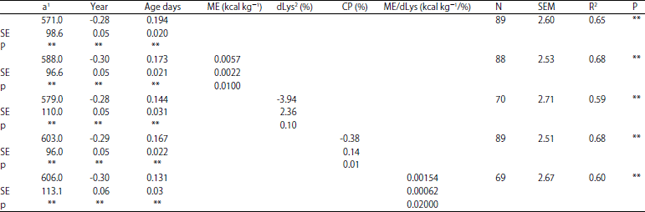
Body composition and nutrient efficiency: Body fat was significantly predicted by year, age, ME, dLys, protein and ME/dLys (Table 3). The negative coefficient of dLys to predict body fat shows a tendency to be significant (p = 0.10). The body fat is reduced by 0.28% each year, by 0.39% for +0.10% of dLys and by 0.38% for +1.0% of CP. In contrast, the body fat is increased by 0.57% for +100 kcal of ME kg–1 and by 0.15% for +100 kcal of ME/kg/% of dLys. When plotting the predictive equations for body fat and protein, over the last 16 years, body protein has been increased by 4%, whereas body fat has been lowered by around 6% (Fig. 2). In general, these body compositions and feed conversion trends suggest that FCR is inversely related to body protein and positively related to body fat, especially from 2010-2012 where drastic changes for FCR, breast yield and body fat occurred. Corporal body fat at similar age or body weight was smaller by 2% in birds with good FCR compared to those with poor FCR8,9. In these old broiler lines, the body protein content was similar between high and low feed efficient birds8-10. However, both types of birds had small breast yield (≤15%) compared to modern broiler chickens and had not changed body composition with the exception of body fat. The breast muscle yield has been drastically increased during the last 10 years (Fig. 2) and these new differences in breast meat yield might change the whole body protein in the modern broiler chickens.
 | |
| Fig. 2: | Feed conversion (FCR), breast yield and body protein and fat changes over time. Breast yield and FCR adjusted to 2268 g of body weight |
Thus, broiler chickens with higher growth performance and breast meat yield produced higher carcass protein than random broiler chickens3. In agreement with current results, the body fat is increased by 0.6% when dietary energy was augmented by 100 kcal 6,85. In contrast, as observed herein, body fat was lowered as the protein and lysine were proportionally increased4,66,86. The limited data evaluating only dietary dLys considering constant amounts of amino acids on carcass composition did not allow predicting the body fat in the current study. However, it is interesting to note that body fat was not affected when broilers were fed lysine above their requirements, although feeding lower lysine levels resulted in an increase in body fat33,44,53.63,66.
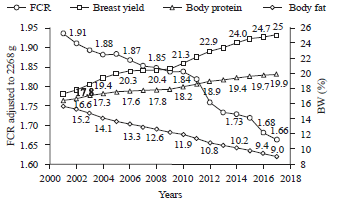
Trends of dLys intake, dLys for maintenance, lysine for protein gain and efficiency of lysine are shown in Fig. 3. Since 2001, dLys efficiency has been positively improved from 61-76% due to body protein gain. Digestible lysine for maintenance has remained almost constant and relatively small, around 4% of actual dLys intake, and actual dLys intake remained almost constant due to reduced feed intake.
 | |
| Fig. 3: | Trends of digestible lysine (dLys) intake, dLys for maintenance (dLys maint), lysine for protein gain (Lys gain) and efficiency of lysine. Actual dLys intake is adapted from a US industry reporting service91 |
Research studies also indicate that the modern broiler chickens or lines with best feed conversion had higher protein efficiency compared to random-bred chickens or lines with poor feed conversion. The improved protein efficiency can be attributed to a reduction in protein degradation and an increment in protein synthesis10,99-102.
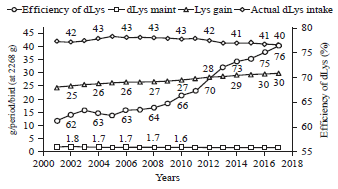
Trends of ME intake, net energy for maintenance and body weight gain and ME efficiency are shown in Fig. 4. The efficiency of ME for gain has remained almost constant (~74%) from 2001-2017. This efficiency has not increased because the energy gained from body fat has been decreased, whereas the energy gained from body protein has increased over the last years. Further, both the energy for body gain and the actual ME intake were also reduced in parallel, as a result of decreasing the feed intake and number of days to reach the target body weight. However, when energy efficiencies were compared to similar ages, birds with improved feed conversion or modern broilers had better energetic efficiency (energy gain/ME intake) compared to random-bred broiler chickens or lines with poorer feed conversion103,104. Therefore, the efficiency of nutrients by comparing the nutrient intake and requirements from a previous year shows another approach to measuring the energy efficiency (Fig. 5). When yearly nutrients were, for instance, compared to nutrients in 2001, the ME intake and NE for maintenance and body gain were observed to be more efficient by approximately 18% from 2001-2017. This type of ME efficiency by a specific year indicates that advancement from genetic progress is similar to that observed in dLys efficiency (Fig. 3). But when using the specific year approach for lysine, the dLys intake was found to be constant.
 | |
| Fig. 4: | Trends of ME intake (MEi), net energy for maintenance (NEm) and body gain (NEg) and ME efficiency [(NEm+NEg)/MEi]. Actual ME intake is adapted from a US industry reporting service91 |
 | |
| Fig. 5: | Nutrients relative to 2001 [(Nutrients, 2001-2017)/(Nutrients, 2001)×3100]. Nutrient intakes were obtained from a US industry reporting service91. Net energy for maintenance (NE maint.), net energy for body gain (NE gain), digestible lysine for maintenance (dLys maint.) and lysine for protein gain (Lys gain). Digestible lysine (dLys) |
As expected, the lysine for maintenance (dLys main.) and for body protein gain (Lys gain) was augmented from 100-119%. This 19% increase in lysine needs might be misunderstood as inefficiency; however, this higher lysine demand is accounted for by observed improvements in breast meat yield. From industry reports and research trials carried out over the last 16 years, it could be assumed that caloric values will continue to be influenced mostly by feed ingredient cost and less influenced by energy needs. However, future reduction trends of ME requirements might be evaluated by nutritionists when conducting field trial evaluation, which could result in this being the primary reason for selecting dietary ME values. Evidence from the scientific literature regarding the benefits of fiber-contributing ingredients in current broiler chickens106,107 might suggest that birds in the future may eat diets lower in ME. In addition, primary breeder companies may also choose to select their birds based on diets with reduced caloric density. In the future, we can expect that amino acid trends will depend more on amino acid requirements mainly influenced by breast muscle yield rather than feed cost. However, if other traits such as robustness or health status were to take priority over breast muscle yield, this continuous tendency of increasing amino acid needs might plateau and become more impacted by feed cost.
CONCLUSION
Based on the research papers discussed and an industry report, the energy and lysine levels have been reduced and increased, respectively, over the last 16 years. The employment of commercial energy and amino acid levels in commercial feed formulation seem to be influenced by feed cost and lysine requirements, respectively. From genetic selection, the reduction of feed intake and body fat and the increment of weight gain and body protein have resulted in an improvement in the energy and lysine efficiencies based on available data.
SIGNIFICANCE STATEMENT
This study discovers the possible dietary energy and amino acid trends and body composition changes that can be beneficial for Nutritionist in the process of selecting the dietary energy and amino acids. This study will help the researcher to uncover the critical areas of energy and amino acid efficiencies over time that many researchers were not able to explore. Thus, a new theory on future nutrient levels and physiological mechanisms may be arrived at.
REFERENCES
- Wen, C., X. Jiang, L. Ding, T. Wang and Y. Zhou, 2017. Effects of dietary methionine on breast muscle growth, myogenic gene expression and IGF-I signaling in fast- and slow-growing broilers. Scient. Rep., Vol. 7.
CrossRefDirect Link - Rosa, P.S., D.E. Faria Filho, F. Dahlke, B.S. Vieira, M. Macari and R.L. Furlan, 2007. Effect of energy intake on performance and carcass composition of broiler chickens from two different genetic groups. Revista Brasileira Ciencia Avicola, 9: 117-122.
CrossRefDirect Link - Danisman, R. and R.M. Gous, 2013. Effect of dietary protein on the allometric relationships between some carcass portions and body protein in three broiler strains. S. Afr. J. Anim. Sci., 41: 194-208.
CrossRefDirect Link - Geraert, P.A., J.C.F. Padilha and S. Guillaumin, 1996. Metabolic and endocrine changes induced by chronic heat exposure in broiler chickens: Growth performance, body composition and energy retention. Br. J. Nutr., 75: 195-204.
CrossRefDirect Link - Shahin, K.A. and F. Abd El Azeem, 2006. Effects of breed, sex and diet and their interactions on fat deposition and partitioning among depots of broiler chickens. Arch. Tierz. Dummertorf., 49: 181-193.
CrossRefDirect Link - Henn, J.D., L. Bockor, A.M.L. Ribeiro, A. Coldebella and A.D.M. Kessler, 2014. Growth and deposition of body components of intermediate and high performance broilers. Rev. Bras. Cienc. Avic., 16: 319-328.
CrossRefDirect Link - Washburn, K.W., R.A. Guill and H.M. Edwards Jr., 1975. Influence of genetic differences in feed efficiency on carcass composition of young chickens. J. Nutr., 105: 1311-1317.
CrossRefDirect Link - Pym, R.A.E. and A.J. Solvyns, 1979. Selection for food conversion in broilers: Body composition of birds selected for increased body‐weight gain, food consumption and food conversion ratio. Br. Poult. Sci., 20: 87-97.
CrossRefDirect Link - Pym, R.A.E., B. Leclercq, F.M. Tomas and S. Tesseraud, 2004. Protein utilisation and turnover in lines of chickens selected for different aspects of body composition. Br. Poult. Sci., 45: 775-786.
CrossRefDirect Link - Leeson, S., L. Caston and J.D. Summers, 1996. Broiler response to diet energy. Poult. Sci., 75: 529-535.
CrossRefDirect Link - Rabie, M.H. and M. Szilagyi, 1998. Effects of L-carnitine supplementation of diets differing in energy levels on performance, abdominal fat content and yield and composition of edible meat of broilers. Br. J. Nutr., 80: 391-400.
Direct Link - Zanusso, J.T., R.F.M. de Oliveira, J.L. Donzele, R.A. Ferreira, H.S. Rostagno, R.F. Euclydes and S.R. Valerio, 1999. Metabolizable energy levels for broilers (1 to 21 days) maintained under a thermoneutral environment. Rev. Bras. Zootec., 28: 1068-1074.
CrossRefDirect Link - Raju, M.V.L.N., G.S. Sunder, M.M. Chawak, S.V.R. Rao and V.R. Sadagopan, 2004. Response of naked neck (Nana) and normal (Nana) broiler chickens to dietary energy levels in a subtropical climate. Br. Poult. Sci., 45: 186-193.
CrossRefDirect Link - Araujo, L.F., O.M. Junqueira, C.S.S. Araujo, L.C.G.S. Barbosa, J.H. Ortolan, D.E. Faria and J.H. Stringhini, 2005. Energy and lysine for broilers from 44-55 days of age. Rev. Bras. Cienc. Avic., 7: 237-241.
CrossRefDirect Link - Dozier III, W.A., C.J. Price, M.T. Kidd, A. Corzo, J. Anderson and S.L. Branton, 2006. Growth performance, meat yield and economic responses of broilers fed diets varying in metabolizable energy from thirty to fifty-nine days of age. J. Applied Poult. Res., 15: 367-382.
CrossRefDirect Link - Dozier, W.A., J.L. Purswell, M.T. Kidd, A. Corzo and S.L. Branton, 2007. Apparent metabolizable energy needs of broilers from two to four kilograms as influenced by ambient temperature. J. Applied Poult. Res., 16: 206-218.
CrossRefDirect Link - Plumstead, P.W., H. Romero-Sanchez, N.D. Paton, J.W. Spears and J. Brake, 2007. Effects of dietary metabolizable energy and protein on early growth responses of broilers to dietary lysine. Poult. Sci., 86: 2639-2648.
CrossRefDirect Link - Niu, Z., J. Shi, F. Liu, X. Wang, C. Gao and L. Yao, 2009. Effects of dietary energy and protein on growth performance and carcass quality of broilers during starter phase. Int. J. Poult. Sci., 8: 508-511.
CrossRefDirect Link - Dozier, W.A.3rd., C.K. Gehring, A. Corzo and H.A. Olanrewaju, 2011. Apparent metabolizable energy needs of male and female broilers from 36 to 47 days of age. Poult. Sci., 90: 804-814.
CrossRefPubMedDirect Link - Bess, F., A. Favero, S.L. Vieira and J. Torrent, 2012. The effects of functional oils on broiler diets of varying energy levels. J. Applied Poult. Res., 21: 567-578.
CrossRefDirect Link - Mousavi, S.N., A. Afsar and H. Lotfollahian, 2013. Effects of guanidinoacetic acid supplementation to broiler diets with varying energy contents. J. Applied Poult. Res., 22: 47-54.
CrossRefDirect Link - Choe, H.S., J.S. Um and K.S. Ryu, 2013. A comparison of various energy and protein concentrations in diets on the performance, bone mineral density and blood characteristics of broiler chicks. Korean J. Poult. Sci., 40: 369-377.
CrossRefDirect Link - Heger, J., J. Zelenka, V. Machander, C. de la Cruz, M. Lestak and D. Hampel, 2014. Effects of guanidinoacetic acid supplementation to broiler diets with varying energy content. Acta Univ. Agric. Silvic. Mendel. Brun., 62: 477-485.
CrossRefDirect Link - Tancharoenrat, P. and V. Ravindran, 2014. Influence of tallow and calcium concentrations on the performance and energy and nutrient utilization in broiler starters. Poult. Sci., 93: 1453-1462.
CrossRefDirect Link - Dozier III, W.A. and C.K. Gehring, 2014. Growth performance of Hubbard × Cobb 500 and Ross × Ross 708 male broilers fed diets varying in apparent metabolizable energy from 14 to 28 days of age. J. Applied Poult. Res., 23: 494-500.
CrossRefDirect Link - Chang, A., D. Elfick, S. Sooncharernying and S. Cerrate, 2015. Performance of ross 308 broilers fed different levels of energy and balanced protein under moderate heat stress. Aust. Poult. Sci. Symp., 26: 117-120.
Direct Link - Harrington, D., M. Sims and A.B. Kehlet, 2016. Effect of Bacillus subtilis supplementation in low energy diets on broiler performance. J. Applied Poult. Res., 25: 29-39.
CrossRefDirect Link - Infante-Rodriguez, F., J. Salinas-Chavira, M.F. Montano-Gomez, O.M. Manriquez-Nunez, V.M. Gonzalez-Vizcarra, O.F. Guevara-Florentino and J.A.R. De Leon, 2016. Effect of diets with different energy concentrations on growth performance, carcass characteristics and meat chemical composition of broiler chickens in dry tropics. SpringerPlus, Vol. 5.
CrossRefDirect Link - Ghahremani, A., A.A. Sadeghi, S. Hesaraki, M. Chamani and P. Shawrang, 2016. Energy type and amount in the diets of broiler chickens: Effects on performance and duodenal morphology. Iran. J. Applied Anim. Sci., 6: 909-915.
Direct Link - Akbari, S.M., A.A. Sadeghi, M.A. Afshar, P. Shawrang and M. Chamani, 2017. The effect of energy sources and levels on performance and breast amino acids profile in Cobb 500 broiler chicks. Iran J. Applied Anim. Sci., 7: 129-137.
Direct Link - Costa, F.G.P., H.S. Rostagno, L.F.T. Albino, P.C. Gomes and R.S. Toledo, 2001. Dietary lysine levels for broilers chickens from 1 to 21 and 22 to 40 days of age. Rev. Bras. Zootec., 30: 1490-1497.
CrossRefDirect Link - Costa, F.G.P., V.D.S. Amarante Junior, G.A.J. do Nascimento, P.A. Brandao, L.R. Barros, J.H.V. da Silva and J.S. da Costa, 2006. Lysine levels for broilers in the periods from 22 to 42 and 43 to 49 days of age. Cienc. Agrotecnol., 30: 759-766.
CrossRefDirect Link - Labadan, Jr. M.C., K.N. Hsu and R.E. Austic, 2001. Lysine and arginine requirements of broiler chickens at two- to three-week intervals to eight weeks of age. Poult. Sci., 80: 599-606.
CrossRefDirect Link - Corzo, A., E.T. Moran Jr. and D. Hoehler, 2002. Lysine need of heavy broiler males applying the ideal protein concept. Poult. Sci., 81: 1863-1868.
CrossRefDirect Link - Kidd, M.T. and B.I. Fancher, 2001. Lysine needs of starting chicks and subsequent effects during the growing period. J. Applied Poult. Res., 10: 385-393.
CrossRefDirect Link - Fatufe, A.A., R. Timmler and M. Rodehutscord, 2004. Response to lysine intake in composition of body weight gain and efficiency of lysine utilization of growing male chickens from two genotypes. Poult. Sci., 83: 1314-1324.
CrossRefDirect Link - Garcia, A. and A.B. Batal, 2005. Changes in the digestible lysine and sulfur amino acid needs of broiler chicks during the first three weeks posthatching. Poult. Sci., 84: 1350-1355.
CrossRefDirect Link - Greenwood, M.W., K.R. Cramer, R.S. Beyer, P.M. Clark and K.C. Behnke, 2005. Influence of feed form on estimated digestible lysine needs of male broilers from sixteen to thirty days of age. J. Applied Poult. Res., 14: 130-135.
CrossRefDirect Link - Lana, S.R.V., R.F.M. de Oliveira, J.L. Donzele, P.C. Gomes, R.G.M.V. Vaz and W.D.O. Rezende, 2005. Requirements of dietary digestible lysine for broilers from 22 to 42 days old on thermoneutral environment. Rev. Bras. Zootec., 34: 1624-1632.
CrossRefDirect Link - Lana, S.R.V., R.F.M. de Oliveira, J.L. Donzele, L.T.F. Albino, R.G.M.V. Vaz and W.D.O. Rezende, 2005. Requirements of dietary digestible lysine for broilers from 1 to 21 days old on thermoneutral environment. Rev. Bras. Zootec., 34: 1614-1623.
CrossRefDirect Link - Urdaneta-Rincon, M., K. de Lange, L. Pena-Ortega and S. Leeson, 2005. Lysine requirements of young broiler chickens are affected by level of dietary crude protein. Can. J. Anim. Sci., 85: 195-204.
CrossRefDirect Link - Cafe, M.B. and P.W. Waldroup, 2006. Interactions between levels of methionine and lysine in broiler diets changed at typical industry intervals. Int. J. Poult. Sci., 5: 1008-1015.
CrossRefDirect Link - Garcia, A.R., A.B. Batal and D.H. Baker, 2006. Variations in the digestible lysine requirement of broiler chickens due to sex, performance parameters, rearing environment and processing yield characteristics. Poult. Sci., 85: 498-504.
CrossRefDirect Link - Vieira, S.L., E.S. Viola, J. Berres, A.R. Olmos, O.R.A. Conde and J.G. Almeida, 2006. Performance of broilers fed increased levels energy in the pre-starter diet and on subsequent feeding programs having with acidulated soybean soapstock supplementation. Rev. Bras. Cienc. Avic., 8: 55-61.
CrossRefDirect Link - Berri, C., J. Besnard and C. Relandeau, 2008. Increasing dietary lysine increases final pH and decreases drip loss of broiler breast meat. Poult. Sci., 87: 480-484.
CrossRefDirect Link - Goulart, C.D.C., F.G.P. Costa, R.D.C.L. Neto, J.G. Souza, J.H.V. da Silva and P.E.N. Givisiez, 2008. Digestible lysine requirements for male broilers from 1 to 42 days old. Rev. Bras. Zootec., 37: 876-882.
CrossRefDirect Link - Safamehr, A., A. Azgani and Y. Mehmannavaz, 2008. Effects of lysine-HCL supplementation on performance and carcass characteristics of ross broilers. Res. J. Biol. Sci., 3: 1197-1201.
Direct Link - Dozier III, W.A., A. Corzo, M.T. Kidd, P.B. Tillman and S.L. Branton, 2009. Digestible lysine requirements of male and female broilers from fourteen to twenty-eight days of age. Poult. Sci., 88: 1676-1682.
CrossRefPubMedDirect Link - Abdel-Maksoud, A., F. Yan, S. Cerrate, C. Coto, Z. Wang and P.W. Waldroup, 2010. Effect of dietary crude protein, lysine level and amino acid balance on performance of broilers 0 to 18 days of age. Int. J. Poult. Sci., 9: 21-27.
CrossRefDirect Link - Abudabos, A. and R. Aljumaah, 2010. Evaluation of digestible lysine needs for male broiler. Int. J. Poult. Sci., 9: 1146-1151.
CrossRefDirect Link - Dozier III, W.A., A. Corzo, M.T. Kidd, P.B. Tillman, J.P. McMurtry and S.L. Branton, 2010. Digestible lysine requirements of male broilers from 28 to 42 days of age. Poult. Sci., 89: 2173-2182.
CrossRefPubMedDirect Link - Ghahri, H., R. Gaykani and T. Toloie, 2010. Effect of dietary crude protein level on performance and lysine requirements of male broiler chickens. Afr. J. Agric. Res., 5: 1228-1234.
Direct Link - Mehri, M., H. Nassiri-Moghaddam, H. Kermanshahi and M. Danesh-Mesgaran, 2010. Digestible lysine requirements of straight-run broiler chickens from fifteen to twenty-eight days of age. J. Anim. Vet. Adv., 9: 2321-2324.
CrossRefDirect Link - Zaghari, M., M. Shivazad, A. Kamyab and A. Nikkhah, 2010. Digestible lysine requirement of Arian male and female broiler chicks during six to twenty-one days of age. J. Agric. Sci. Technol., 4: 111-117.
Direct Link - Taghinejad-Roudbaneh, M., K. Nazeradl, M.A. Taghavi, M. Afrooziyeh and A. Zakerii, 2011. Estimation of dietary lysine requirement based on broken line and quadratic model analyses with the use performance and immune responses criterion. J. Applied Poult. Res., 39: 367-374.
CrossRefDirect Link - Zaboli, G.R., G. Jalilvand, A.A. Davarpanah and M. Mehri, 2011. Estimation of standardized ileal digestible lysine requirement of starting broiler chicks fed soybean-and cottonseed meal-based diets. J. Anim. Vet. Adv., 10: 1278-1282.
CrossRefDirect Link - Corzo, A., L. Mejia, C.D. McDaniel and J.S. Moritz, 2012. Interactive effects of feed form and dietary lysine on growth responses of commercial broiler chicks. J. Applied Poult. Res., 21: 70-78.
CrossRefDirect Link - Dozier III, W.A. and R.L. Payne, 2012. Digestible lysine requirements of female broilers from 1 to 15 days of age. J. Applied Poult. Res., 21: 348-357.
CrossRefDirect Link - Mehri, M., A.A. Davarpanah and H.R. Mirzaei, 2012. Estimation of ideal ratios of methionine and threonine to lysine in starting broiler chicks using response surface methodology. Poult. Sci., 91: 771-777.
CrossRefDirect Link - Lessire, M., Y. Primot, E. Corrent, F. Pauline, S. Tesseraud and C. Berri, 2013. Lysine Supply in Finishing Broilers: Effect on Performances and Meat Quality. In: Energy and Protein Metabolism and Nutrition in Sustainable Animal Production, Oltjen, J.W., E. Kebreab and H. Lapierre (Eds.)., Wageningen Academic Publishers, Wageningen, pp: 209-210.
- Mahdavi, A., M. Shivazad, F. Alemi, M. Zaghari, H. Moravej and B. Darabighane, 2012. Digestible lysine requirement of broilers based on practical diet. Ital. J. Anim. Sci., 11: 68-76.
CrossRefDirect Link - De Oliveira, W.P., R.F.M. de Oliveira, J.L. Donzele, L.F.T. Albino and P.H.R.F. Campos et al., 2013. Lysine levels in diets for broilers from 8 to 21 days of age. Rev. Bras. Zootic., 42: 869-878.
CrossRefDirect Link - Carlos, T.C.F., C.T. Marino, N.V.P. da Silva, L.C.G.S. Barbosa and R.N. Reis et al., 2014. Evaluation of different digestible lysine levels for male broilers during the period of 18 to 40 days of age. Rev. Bras. Cienc. Avic., 16: 83-87.
CrossRefDirect Link - Wecke, C., A. Pastor and F. Liebert, 2017. Assessing lysine requirement of growing chicken by direct comparison between supplementation technique and “Goettingen approach". Open J. Anim. Sci., 7: 56-69.
CrossRefDirect Link - Cemin, H.S., S.L. Vieira, C. Stefanello, M. Kipper, L. Kindlein and A. Helmbrecht, 2017. Digestible lysine requirements of male broilers from 1 to 42 days of age reassessed. PloS One, Vol. 12, No. 6.
CrossRefDirect Link - Cella, P.S., J.L. Donzele, R.F.M. de Oliveira, L.F.T. Albino and A.S. Ferreira et al., 2001. Levels of lysine maintaining the amino acid relation for broilers from 1 to 21 days of age in different thermal environments. Rev. Bras. Zootec., 30: 433-439.
CrossRefDirect Link - Si, J., C.A. Fritts, D.J. Burnham and P.W. Waldroup, 2001. Relationship of dietary lysine level to the concentration of all essential amino acids in broiler diets. Poult. Sci., 80: 1472-1479.
CrossRefPubMedDirect Link - Kidd, M.T., C.D. McDaniel, S.L. Branton, E.R. Miller, B.B. Boren and B.I. Fancher, 2004. Increasing amino acid density improves live performance and carcass yields of commercial broilers. J. Applied Poult. Res., 13: 593-604.
CrossRefDirect Link - Viola, T.H., A.D.M. Kessler, A.M.L. Ribeiro, I.C.M. da Silva and R. Kras, 2009. The influence of crude protein level in the basal diet on the determination of lysine requirements for broiler performance and part yields. Rev. Bras. Cienc. Avic., 11: 155-160.
CrossRefDirect Link - Takeara, P., A.L. Toledo, E.R.S. Gandra, R. Albuquerque and M.A.T. Neto, 2010. Digestible lysine for male broilers from 12 to 22 days of age. Arq. Bras. Med. Vet. Zootec., 62: 1455-1461.
CrossRefDirect Link - Neto, M.A.T., A.L. de Toledo, P. Takeara, E. Kobashigawa, D.C.Z. Donato and R. de Albuquerque, 2011. Dietary levels of lysine for male broilers from 23 to 36 days of age: Performance and body composition. Rev. Bras. Zoot., 40: 609-615.
CrossRefDirect Link - Siqueira, J.C., N.K. Sakomura, L.R.B. Dourado, J.M.B. Ezequiel, N.A.A. Barbosa and J.B.K. Fernandes, 2013. Diet formulation techniques and lysine requirements of 1-to 22-day-old broilers. Rev. Bras. Cienc. Avic., 15: 123-134.
CrossRefDirect Link - Bernal, L.E.P., F.C. Tavernari, H.S. Rostagno and L.F.T. Albino, 2014. Digestible lysine requirements of broilers. Rev. Bras. Cienc. Avic., 16: 49-54.
CrossRefDirect Link - De Oliveira, W.P., R.F.M.D.O. Donzele, J.L. Donzele, L.F.T. Albino and M.V.D.L. Antunes et al., 2014. Digestible lysine levels obtained by two methods of formulation of diets for 22-to-42-day-old broilers. Rev. Bras. Zootec., 43: 579-589.
CrossRefDirect Link - Yu, M.W., F.E. Robinson, M.T. Clandinin and I. Bodnar, 1990. Growth and body composition of broiler chickens in response to different regimens of feed restriction. Poult. Sci., 69: 2074-2081.
CrossRefDirect Link - Charles, R.G., F.E. Robinson, R.T. Hardin, M.W. Yu, J. Feddes and H.L. Classen, 1992. Growth, body composition and plasma androgen concentration of male broiler chickens subjected to different regimens of photoperiod and light intensity. Poult. Sci., 71: 1595-1605.
PubMedDirect Link - Santoso, U., K. Tanaka and S. Ohtani, 1995. Early skip-a-day feeding of female broiler chicks fed high-protein realimentation diets: Performance and body composition. Poult. Sci., 74: 494-501.
CrossRefDirect Link - Wiseman, J. and C.E. Lewis, 1998. Influence of dietary energy and nutrient concentration on the growth of body weight and of carcass components of broiler chickens. J. Agric. Sci., 131: 361-371.
Direct Link - Santoso, U., 2001. Effects of early feed restriction on growth, fat accumulation and meat composition in unsexed broiler chickens. Asian-Aust. J. Anim. Sci., 14: 1585-1591.
Direct Link - Bregendahl, K., J.L. Sell and D.R. Zimmerman, 2002. Effect of low-protein diets on growth performance and body composition of broiler chicks. Poult. Sci., 81: 1156-1167.
CrossRefDirect Link - Crespo, N. and E. Esteve-Garcia, 2002. Dietary polyunsaturated fatty acids decrease fat deposition in separable fat depots but not in the remainder carcass. Poult. Sci., 81: 512-518.
CrossRefDirect Link - Villaverde, C., M.D. Baucells, L. Cortinas, M. Hervera and A.C. Barroeta, 2005. Chemical composition and energy content of chickens in response to different levels of dietary polyunsaturated fatty acids. Arch. Anim. Nutr., 59: 281-292.
CrossRefDirect Link - Kamran, Z., M. Sarwar, M. Nisa, M.A. Nadeem and S. Ahmad et al., 2008. Effect of lowering dietary protein with constant energy to protein ratio on growth, body composition and nutrient utilization of broiler chicks. Asian-Aust. J. Anim. Sci., 21: 1629-1634.
Direct Link - Marcato, S.M., N.K. Sakomura, D.P. Munari, J.B.K. Fernandes, I.M. Kawauchi and M.A. Bonato, 2008. Growth and body nutrient deposition of two broiler commercial genetic lines. Rev. Bras. Cienc. Avic., 10: 117-123.
CrossRefDirect Link - Danisman, R. and R.M. Gous, 2013. Effect of dietary protein on performance of four broiler strains and on the allometric relationships between carcass portions and body protein. S. Afr. J. Anim. Sci., 43: 25-37.
CrossRefDirect Link - Lesuisse, J., C. Li, S. Schallier, J. Leblois, N. Everaert and J. Buyse, 2017. Feeding broiler breeders a reduced balanced protein diet during the rearing and laying period impairs reproductive performance but enhances broiler offspring performance. Poult. Sci., 96: 3949-3959.
CrossRefDirect Link - Sakomura, N.K., F.A. Longo, E.O. Oviedo-Rondon, C. Boa-Viagem and A. Ferraudo, 2005. Modeling energy utilization and growth parameter description for broiler chickens. Poult. Sci., 84: 1363-1369.
CrossRefDirect Link - Dilger, R.N. and O. Adeola, 2006. Estimation of true phosphorus digestibility and endogenous phosphorus loss in growing pigs fed conventional and low-phytate soybean meals. J. Anim. Sci., 84: 627-634.
CrossRefDirect Link - Jorgensen, H., P. Sorensen and B.O. Eggum, 1990. Protein and energy metabolism in broiler chickens selected for either body weight gain or feed efficiency. Br. Poult. Sci., 31: 517-524.
CrossRefDirect Link - Ten Doeschate, R.A.H., C.W. Scheele, V.V.A.M. Schreurs and J.D. van der Klis, 1993. Digestibility studies in broiler chickens: Influence of genotype, age, sex and method of determination. Br. Poult. Sci., 34: 131-146.
CrossRefDirect Link - Cerrate, S. and P. Waldroup, 2009. Maximum profit feed formulation of broilers: 1. Development of a feeding program model to predict profitability using non linear programming. Int. J. Poult. Sci., 8: 205-215.
CrossRefDirect Link - Talpaz, H., M. Cohen, B. Fancher and J. Halley, 2013. Applying complex models to poultry production in the future-economics and biology. Poult. Sci., 92: 2541-2549.
CrossRefDirect Link - Maeda, Y., K. Hayashi, S. Toyohara and T. Hashiguchi, 1984. Variation among chicken stocks in the fractional rates of muscle protein synthesis and degradation. Biochem. Genet., 22: 687-700.
CrossRefDirect Link - Tomas, F.M., L.M. Jones and R.A. Pym, 1988. Rates of muscle protein breakdown in chickens selected for increased growth rate, food consumption or efficiency of food utilisation as assessed by Nτ-methylhistidine excretion. Br. Poult. Sci., 29: 359-370.
CrossRefDirect Link - Tomas, F.M., R.A. Pym and R.J. Johnson, 1991. Muscle protein turnover in chickens selected for increased growth rate, food consumption or efficiency of food utilisation: Effects of genotype and relationship to plasma IGF-I and growth hormone. Br. Poult. Sci., 32: 363-376.
CrossRefDirect Link - Pym, R.A.E., P.J. Nicholls, E. Thomson, A. Choice and D.J. Farrell, 1984. Energy and nitrogen metabolism of broilers selected over ten generations for increased growth rate, food consumption and conversion of food to gain. Br. Poult. Sci., 25: 529-539.
CrossRefDirect Link - Skinner-Noble, D.O. and R.G. Teeter, 2003. Components of feed efficiency in broiler breeding stock: energetics, performance, carcass composition, metabolism and body temperature. Poult. Sci., 82: 1080-1090.
CrossRefDirect Link - Lopez, G. and S. Leeson, 2005. Utilization of metabolizable energy by young broilers and birds of intermediate growth rate. Poult. Sci., 84: 1069-1076.
CrossRefDirect Link - Barekatain, R., R.A. Swick, M. Toghyani and C.T. de Koning, 2017. Interactions of full-fat canola seed, oat hulls as an insoluble fiber source and pellet temperature for nutrient utilization and growth performance of broiler chickens. Poult. Sci., 96: 2233-2242.
CrossRefDirect Link - Kimiaeitalab, M.V., L. Camara, S.M. Goudarzi, E. Jimenez-Moreno and G.G. Mateos, 2017. Effects of the inclusion of sunflower hulls in the diet on growth performance and digestive tract traits of broilers and pullets fed a broiler diet from zero to 21 d of age. A comparative study. Poult. Sci., 96: 581-592.
CrossRefDirect Link - Batal, A. and N. Dale, 2009. Ingredient analysis Table: 2010 Edition. Feedstuffs, 80: 16-17.
Direct Link