
V. K. Mishra
Department of Plant Pathology, C.S.A. University of Agriculture and Technology, Kanpur, Uttar Pradesh-208002, India
S. K. Biswas
Department of Plant Pathology, C.S.A. University of Agriculture and Technology, Kanpur, Uttar Pradesh-208002, India
M. Rajik
Department of Plant Pathology, C.S.A. University of Agriculture and Technology, Kanpur, Uttar Pradesh-208002, India
International Journal of Plant Pathology
Year: 2011 | Volume: 2 | Issue: 2 | Page No.: 72-80


ABSTRACT
The aim of this research is to study the resistance response to Alternaria blight by different varieties of wheat alongwith growth stages of plant. Resistance response to Alternaria blight by different varieties of wheat namely HUW 612, K 508, K 0708, HD 3003, K 402, HUW 468 and PBW 343 revealed that all the varieties give variable response on disease severity. Among the varieties, minimum disease severity was recorded in K 0708 with the value of 11, 21 and 30% at flowering, dough and hard dough stage. Biochemical analysis of leaves of different varieties of wheat revealed that the variable amount of phenol and soluble protein content. The maximum with 3.12, 2.98, 2.59 and 2.60 mg g-1 of total phenol and 31.52, 30.79, 29.73 and 29.73 mg g-1 of soluble protein content was found in K 0708 at seedling, flowering, dough and hard dough stage, respectively. The banding pattern of soluble protein showed that quantitative and qualitative differences are existing among the variety. Protein profiling by SDS-PAGE revealed that the variety, HUW 612 has the maximum number of bands with 23. The presence or absence of bands in protein profiling might be responsible for resistance to Alternaria blight in wheat. The correlation co-efficient between disease severity and soluble protein content at different stage of wheat varieties revealed that there was negative correlation showing (r) -0.4212 (flowering), -0.4221 (dough) and -0.4592 (Hard dough) on the varieties HUW 612. The regression equation of soluble protein and disease severity showed that higher regression value, lower disease incidence. The variety K 0708 has the correlation coefficient value as (r) -0.4310 at flowering stage -0.4410 at dough stage and -0.4420 at the hard dough stage, resulting highest response of resistance to Alternaria triticina.
PDF Abstract XML References Citation
How to cite this article
V. K. Mishra, S. K. Biswas and M. Rajik, 2011. Biochemical Mechanism of Resistance to Alternaria Blight by Different Varieties of Wheat. International Journal of Plant Pathology, 2: 72-80.
DOI: 10.3923/ijpp.2011.72.80
URL: https://scialert.net/abstract/?doi=ijpp.2011.72.80
DOI: 10.3923/ijpp.2011.72.80
URL: https://scialert.net/abstract/?doi=ijpp.2011.72.80
INTRODUCTION
Wheat (Triticum aestivum L.) is one of the most important grains crops providing nearly 20% of the total world food requirement (Uddin et al., 2006). It is considered as the second most staple food crop next to rice in India. In India, the contribution of wheat to total food grains production has been ranging between 35-37% in last 5 years. The contribution of wheat to total food grain is impressive. However, in the background of increasing population, there is a demand for more production from same pieces of land. The production of wheat is affected by numbers of pests and diseases. Foliar blight is the most serious biotic constraint to wheat yields in the rice-wheat system of South Asia. In this warm environment, foliar blight is commonly occurs as a complex of spot blotch, tan spot and Alternaria blight caused by Cochliobolus sativus, Pyrenophora tritici-repentis and Alternaria triticina, respectively (Maraite et al., 1998; Duveiller and Dubin, 2002; Chaurasia et al., 1999, 2000).
Among the foliar blight diseases complex, leaf blight caused by Alternaria triticina is the major yield and quantity reducing factors of wheat. The disease is occurred through out the world, but severe losses occurred in India, Bangladesh, Belivia, Brazil, Parayung and Zambia. Basically, leaf blight has been serious problem in cool climatic area, but in recent year, the severity of this disease has been increasing in an alarming proportion in India (Alam et al., 1994). The yield losses may go up to 100% in case of severe infection (Hossain and Azad, 1992). Ahmad and Hossain (2005) reported that yield losses due to leaf blight disease under the field condition is about 40-51.17%. The disease is affects all aerial plant parts but the extent of damage may very from variety to variety. Casulli (1990) reported susceptibility of Italian durum wheat genotypes is in Southern Italy only. Semi dwarf bread wheat genotypes highly resistant to rust diseases were also found to harbour resistance to alternaria leaf blight (Prabhu and Prasada, 1966). However, in separate studies in India and Mexico, bread wheat genotypes RR21 (Sonalika) and Bobwhite SH9846 were used as susceptible controls (Sinha et al., 1991; Chaurasia et al., 2000; Pellegrineschi et al., 2001). Prabhu and Prasad (1966) that reported there is a clear differences in resistance and susceptibility among genotypes within the same Triticum species. Prabhu and Prasad (1966) reported that durum wheat (T. durum) genotypes such as cv. Bansi were found to be highly susceptible in Eastern Uttar Pradesh where other part of India it is resistance. These observations imply that certain biochemical differentiation responsible for the host might be associated with resistance in wheat. Therefore, present investigation was undertaken on these aspects.
MATERIALS AND METHODS
Collection of wheat genotypes: The varieties namely HUW 612, K 508, K 0708, HD 3003, K 402, HUW 468 and PBW 343 are popular variety of wheat, commonly used by the farmers around the vicinity of Kanpur. The seeds of all varieties are collected from E.B. Rabi Cereal section, C.S. Azad University of Agriculture and Technology, Kanpur, in the year 2008-09 for conducting various experiments.
Field trial: The experiment was conducted at Agriculture Research Farm of C.S. Azad University of Technology, Kanpur to evaluate the variability among different varieties of wheat with special reference to Alternaria blight caused by Alternaria triticina. The experiment was laid out RBD with three replications. Recommended agronomical practices were followed. Observations on disease severity were taken at flowering, dough and hard dough stages. The leaf samples were also collected for estimation of total soluble protein and total phenol content in wheat leaves at there different stages of plant growth.
Measurement of disease severity: The observation on disease severity was recorded at flowering, dough and hard dough stage in all the varieties of wheat and was calculated from fifty randomly selected leaves of diseased plant separately. The sketch of each leaf was drawn on a graph paper (mm) and area covered by squares was measured. The average area of all the fifty leaves was calculated to get leaf area in cm3. Leaves with no sign of infection received a score of zero, while those with highest received a score of IV. Similarly leaves with 1-25, 26-50 and 51-75, area covered with blight received a score of I, II and III, respectively. The disease severity of individual plant was calculated by the fallowing formula (Chenula and Singh, 1964):
Biochemical study
Soluble protein estimation: Soluble protein were extracted from the samples of all the treatments and estimated following Lowary et al. (1951). The absorbance at 660 nm against a reagent blank was measured using ultra violet visible (UV-VIS) spectra and the standard curve using different concentrations of bovine serum albumin (as blank) was prepared. From the standard curve the concentration of soluble protein in the test sample was determined and expressed as mg soluble protein/g of the sample material.
Total phenol estimation: The accumulation of total phenols in paddy seedlings after treatment with spore suspension of different bioagent and host fungus (D. oryzae) was estimated following Bray and Thorpe (1954) procedure. The absorbance at 650 nm against a reagent blank was measured using ultra violet visible (UV-VIS) spectra and the standard curve using different concentrations of catechol (as blank) was prepared. From the standard curve the concentration of phenols in the test sample was determined and expressed as mg phenol/g of sample material.
Protein profiling: Profiling of soluble proteins was also done in various treatments described. Analysis of total soluble proteins through polyacrylamide gel electrophoresis was carried out the study of variable response of resistance to Alternaria triticina among popular wheat varieties. Polyacrylamide gel electrophoresis was done to get soluble protein pattern. Soluble proteins were electrophoresis by 12% SDS polyacrylamide gel based on the method described by Laemmli (1970).
Correlation coefficients (r) of disease severity with soluble protein and total phenol: The biochemical observations of wheat leaves at different growth stage and disease severity of the corresponding stage under field condition were statistically analyzed. Correlation coefficients (r) between soluble protein and disease severity and between total phenol and disease severity were calculated by standard statistical calculation. Simple regression equations (Y = a + bx) were also developed for both the variables (Protein and phenol) separately to understand their relation with disease severity.
RESULTS AND DISCUSSION
The results obtained from the field and laboratory studies on the mechanism of resistance to Alternaria blight by different varieties of wheat. The experimental findings are presented as below.
Disease severity in different variety of wheat: The resistance could be assumed to be one factor for the reduction of disease severity. Severity of disease was recorded in field trail under natural condition. The data presented in Table 1 showed that all the varieties give variable response on disease severity in three stages of plant growth. Among the variety the minimum disease severity was recorded in K 0708 with the value of 11, 21 and 30% which was followed by HUW 612, showing 13, 23 and 37% disease severity at flowering, dough and hard dough stage, respectively. Thus, the variety K 0708 represented the resistant to Alternaria leaf blight against rest of others. From the Table 2, it is also cleared that the stage of plant growth also gives different response on disease development. The data from the table indicated that the disease severity gradually decrease from flower to dough and hard dough stage with the value of 11, 21 and 30%, respectively in K-0708.
| Table 1: | Severity of leaf blight (Alternaria triticina) on different variety of wheat |
 | |
| Table 2: | Variation in soluble protein content in different varieties of wheat seedling |
 | |
Statistical analysis of data revealed that K-0708 had significantly difference with rest of all the varieties. Wheat varieties HUW 468 and K 508 are statistically at per and showed non significant difference in respect to disease severity.
Biochemical study
Soluble protein: The data presented in the Table 2 showed that the maximum soluble protein content with 31.52, 30.79, 29.73 and 29.50 mg g-1 of fresh leaf at seedling, flowering, dough and hard dough stage was found in the variety K 0708, respectively. The variety HUW 612 was showing second highest in respect of total soluble protein content with the value of 30.92, 30.61, 28.50 and 27.25 mg g-1 of fresh leaves at seedling, flowering, dough and hard dough stage, respectively. Similarly, minimum amount of soluble protein content was found in variety of PBW-343 with the value of 24.09, 23.01, 21.72 and 20.72 mg g-1 of fresh leaves, seedling, flowering, dough and hard dough stage, respectively. From the Table 2, it is also cleared that the soluble protein content was gradually decreased from seedling to flowering, dough and hard dough stage. In the current study, increased amount of protein content might be an indication of defense response of plant. Accumulation of increase amount of soluble protein in host plant due the infection by pathogen was reported by several workers (Tuzun et al., 1989). Infection of the plants by the pathogens led to a marked increase in protein content in graminaceous hosts, such as wheat (Sock et al., 1990), oat (Fink et al., 1988), maize (Nasser et al., 1990), rice (Kumavat et al., 2008) and barley (Hoj et al., 1989) due to activity of β-1, 3 glucanase etc. Antoniew et al. (1980) considered that Pathogenesis Related (PR) proteins are involved in plant defense responses to pathogens.
| Table 3: | Variation in total phenol content in different varieties of wheat seedling |
 | |
Boller (1985) was also the opinion that proteins are associated the defense of plants against fungi and bacteria by their action on the cells walls invading pathogen. An increase in the protein in the current study appears to be an indicative of immunized paddy seedlings against the brown leaf spot pathogen.
Total phenol content: The data presented in Table 3 showed that the content of phenolic compounds in plant was varies from variety to variety and also depends on the age of plant. The maximum amount of total phenol content as 3.12 mg g-1 at seedling stage, 2.98 mg g-1 at flowering stage, 2.75 mg g-1 at dough and 2.60 mg g-1 at hard dough stage was found in the variety K 0708, followed by variety HUW 612 with the value of 2.98, 2.78, 2.59 and 2.50 mg g-1 of fresh leaf at seedling, flowering, dough and hard dough stage. Variety PBW 343 showed minimum amount of phenol content with 2.70, 2.48, 2.28 and 2.10 mg g-1 of fresh leaf at seedling, flowering, dough and hard dough stage. The experimental finding also revealed that the total phenol content was gradually decreased from seedling to flowering dough and hard dough stage. The varieties K 0708 had significant difference with rest of all these varieties. These findings are in conformity with the observation of Biehn et al. (1968) that increased synthesis of phenols in response to increased synthesis of phenols was 4 to 5 times increased over healthy plants after 24 h of inoculation. Shetty and Ahamd (1980) estimated that the total phenolic contents at different growth stages in leaf and root tissues of resistant and susceptible cultivars of maize and sorghum plants to downy mildew and reported faster accumulation of phenols in higher quantity in the disease area. Vidhyasekaran (1974) also reported enhanced quantity of phenols in resistant ragi plants to H. tetramera. Matern and Kneusal (1988) suggested that the first stage of defense mechanism involves a rapid accumulation of phenols at the infection site which restricts or slows the growth of the pathogens. According to Dixon and Lamb (1990) phenolics are substrates synthesized within plant that are involved in disease resistance. Sivakumar and Sharma (2003) expressed the view that increase in phenolic content in maize leaf sheaths inoculated with R. solani or plants, raised from P. fluorescens treated seeds. Observation of the current study pertaining to suppression of A. triticina lesion in wheat supports this view.
Protein profiling: For further confirmation protein profiling was done to determine the possible mechanism of resistance at flowering stage. The banding patterns showed that qualitative and quantitative difference were exit among the varieties. The finding of Protein profiling by SDS PAGE revealed that the variety, K 0708 has the maximum number of bands with 23 and minimum bands are in variety PBW 343 and K 508 which is 19 each.
| Table 4: | Variation in the wheat varieties using SDS-PAGE |
 | |
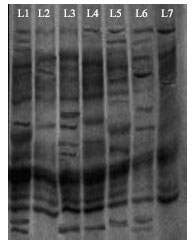 | |
| Fig. 1: | Protein profiling of different varieties of wheat resolved by SDS-PAGE. L-R: Lane 1- HUW 612, Lane 2- K 508, Lane 3-K 708, Lane 4-HD 3003, Lane 5-K 402, Lane 6-HUW 468, Lane 7-PBW 343 |
Other varieties like HUW 612, HD 3003, K 402 and HUW have 21, 20, 21 and 20 bands, respectively (Table 4, Fig. 1). The presence or absence of the bands in protein profiling might be responsible for resistance response to Alternaria blight in wheat. This was supported by worked done by Guo et al. (1986) in rice and Biswas et al. (2003) in wheat. Dwivedi (2008) was also found the different banding pattern of protein in different wheat varieties. Biochemical variation in different varieties of wheat might be one of the key factors for resistance.
Correlation of disease severity with soluble protein content: The correlation between disease severity and soluble protein content at different stage of wheat varieties revealed that there was negative correlation showing (r) -0.4212 (flowering), -0.4221 (dough) and -0.4592 (Hard dough) on the varieties HUW 612. The regression equation of soluble protein and disease severity showed that higher regression value, lower disease incidence. The variety K 0708 has the correlation coefficient value as (r) -0.4310, -0.4410 and -0.4420 at flowering, dough stage and hard dough stage, resulting highest response of resistance to Alternaria triticina (Table 5). Kumavat et al. (2008) also opined that both soluble protein and total phenol were negatively co-related with disease severity.
| Table 5: | Correlation of disease severity with soluble protein content |
 | |
| Table 6: | Correlation of disease severity with soluble phenol content |
 | |
Correlation of disease severity with phenol content: Phenol is another important parameter for resistance response in plant. The high content of phenol indicates lower disease severity. There was also negative correlation between disease severity and total phenol content. The variety K 0708 showed correlation value r) -0.3421, -0.3460 and -0.3475 at flowering, dough and hard dough stage, respectively. The variety K 0708 has the correlation coefficient (r) -0.3115, -0.3120 and -0.3160 at flowering, dough and hard dough stage, respectively (Table 6). Similarly regression equation of total phenol and disease severity showed that higher regression value lower disease incidence. From the table, it is also cleared that the higher co-relation value at flowering stage than dough and hard dough stage of a variety resulting lower disease incidence.
The present finding speculated that the increase amount of soluble protein and phenol along with association of more number of proteins might be responsible for resistance response in plant.
REFERENCES
- Antoniw, J.F., C.E. Ritter, W.S. Pierpoint and L.C. van Loon, 1980. Comparison of three pathogenesis-related proteins from plants of two cultivars of tobacco infected with TMV. J. Gen. Virol., 47: 79-87.
CrossRefDirect Link - Biswas, S.K., K.D. Srivastava, R. Aggarwal, S. Praveen and D.V. Singh, 2003. Biochemical changes in wheat induced by Chaetomium globosum against spot blotch pathogen. Indian Phytopathol., 54: 374-379.
Direct Link - Bray, H.G. and W.V. Thorpe, 1954. Analysis of phenolic compounds of interest in metabolism. Methods Biochem. Anal., 1: 27-52.
PubMedDirect Link - Chaurasia, S., R. Chand and A.K. Joshi, 2000. Relative dominance of Alternaria triticina Pras. et Prab. and Bipolaris sorokiniana (Sacc.) shoemaker in different growth stages of wheat (T. aestivum L.). J. Plant Dis. Prot., 107: 176-181.
Direct Link - Chaurasia, S., A.K. Joshi, R. Dhari and R. Chand, 1999. Resistance to foliar blight of wheat: A search. Genet. Resour. Crop Evol., 46: 469-475.
CrossRefDirect Link - Dixon, R.A. and C.J. Lamb, 1990. Molecular communication in interaction between in plants and microbial pathogens. Ann. Rev. Plant Physiol. Plant Mol. Biol., 41: 339-367.
Direct Link - Fink, W., M. Liefland and K. Mendgen, 1988. Chitinases and β-1,3-glucanases in the apoplastic compartment of oat leaves (Avena sativa L.). Plant Physiol., 88: 270-275.
CrossRefDirect Link - Guo, Y.J., R. Bishop, T.H. Ferhnstrom, G.Z. Yu, Y.N. Lian and S.D. Huang, 1986. Classification of chineserice varieties by electrofocussing. Cereal Chem., 63: 1-3.
Direct Link - Hoj, P.B., D.J. Hartman, N.A. Morrice, D.N. Doan and G.B. Fincher, 1989. Purification of B-1,3-glucon endohydrolase enzyme II from germinated barley and determination of the primary structure from a cDNA clone. Plant Mol. Biol., 13: 31-42.
Direct Link - Hossain, I. and A.K. Azad, 1992. Reaction of wheat to Helminthosporium sativum in Bangladesh. Hereditas, 116: 203-205.
CrossRefDirect Link - Laemmli, U.K., 1970. Cleavage of structural proteins during the assembly of the head of bacteriophage T4. Nature, 227: 680-685.
CrossRefDirect Link - Lowry, O.H., N.J. Rosebrough, A.L. Farr and R.J. Randall, 1951. Protein measurement with the folin phenol reagent. J. Biol. Chem., 193: 265-275.
CrossRefPubMedDirect Link - Matern, U. and R.E. Kneusel, 1988. Phenolic compounds in plant disease resistance. Phytoparasitica, 16: 153-170.
CrossRefDirect Link - Nasser, W., M. de Tapia and G. Burkard, 1990. Maize pathogenesis-related proteins: Characterization and cellular distribution of 1,3-β-glucanases and chitinases induced by brome mosaic virus infection or mercuric chloride treatment. Physiol. Mol. Plant Pathol., 36: 1-14.
CrossRefDirect Link - Pellegrineschi, A., S. McLean, M. Salgado, L. Velazquez and R. Hernandez et al., 2001. Transgenic wheat plants: A powerful breeding source. Euphytica, 119: 135-138.
CrossRef - Uddin, S.A., K.M. Khalequzzaman and A.B. Rashid, 2006. Effect of relative humidity on the development of head blight by Bipolaris sorokiniana in wheat. J. Agric. Rural Dev., 4: 61-65.
CrossRefDirect Link - Sivakumar, G. and R.C. Sharma, 2003. Induced biochemical changes due to seed bacterization by Pseudomonas fluorescens in maize plants. Indian Phytopathol., 56: 134-137.
Direct Link - Shetty, H.S. and R. Ahmad, 1980. Changes in phenolic content of sorghum and maize cultivars resistant and susceptible to sorghum downy mildew. Curr. Sci., 49: 439-441.
Direct Link - Sinha, B., R.M. Singh and U.P. Singh, 1991. Genetics of leaf blight resistance in wheat. Theor. Applied Genet., 82: 399-404.
CrossRefDirect Link - Tuzun, S., M.N. Rao, U. Vogeli, C.L. Schardl and J. Kuc, 1989. Induced systemic resistance to blue mold: Early induction and accumulation of β-1, 3-glucanases, chitinases and other pathogenesis-related proteins (b-proteins) in immunized tobacco. Phytopathology, 79: 979-983.
Direct Link