
Ananthaya Sansawat
Department of Food Science and Technology, Faculty of Science and Technology, Rajamangala University of Technology Tawan-ok, Chonburi, 20110, Thailand
LiveDNA: 66.36623
Paweena Tangjuang
Department of Science and Mathematics, Faculty of Science and Technology, Rajamangala University of Technology Tawan-ok, Chonburi, 20110, Thailand
Dhoungsiri Sayompark
Department of Food Science and Technology, Faculty of Science and Technology, Rajamangala University of Technology Tawan-ok, Chonburi, 20110, Thailand
LiveDNA: 66.37482
International Journal of Dairy Science
Year: 2022 | Volume: 17 | Issue: 1 | Page No.: 24-32


ABSTRACT
>Background and Objective: Colorants from the fruit Basella spp., which are safer than synthetic substances, can be used in food colouring. This study investigated how Basella spp. fruit powder (BFP) affected the quality of goat milk yoghurt. Material and Methods: Goat milk yoghurt was fortified with 0-3% BFP. Differences in physicochemical, sensory and microbial properties were analyzed during storage for 21 days at 4±1°C. Results: Compared to the control, yoghurt fortified with BFP exhibited no statistical differences in pH, lactic acid, ash, fibre, protein, or fat content (p>0.05). Compared to the control, yoghurt supplemented with 3% BFP had higher syneresis, viscosity, carbohydrate and a* colour values, but lower moisture, L* and b* values (p<0.05). The colour, goat and yoghurt odour, sour flavours and overall acceptance of goat milk yoghurt with 2.5% BFP were slightly lower as compared to the control. Both the yoghurt with 2.5% BFP and the control showed significantly lower pH values (p<0.05) during the storage period, whereas, the lactic acid content slightly increased. The colour change was greater in yoghurt with 2.5% BFP had more lactic acid bacterial than the control, whereas, the total bacterial count was similar. Throughout the storage period, no yeast, mould, coliform bacteria and Escherichia coli were found. Conclusion: Adding BFP to goat milk yoghurt affects its good texture and nutritional value, including survival of lactic acid bacteria during storage. Therefore, BFP could be used as a natural colour substance in goat milk yoghurt, representing a new healthy food product for consumers.
PDF Abstract XML References Citation
Copyright: © 2022. This is an open access article distributed under the terms of the creative commons attribution License, which permits unrestricted use, distribution and reproduction in any medium, provided the original author and source are credited.
How to cite this article
Ananthaya Sansawat, Paweena Tangjuang and Dhoungsiri Sayompark, 2022. Effect of Basella spp. Fruit Powder on the Physicochemical, Sensory and Microbiological Properties of Goat Milk Yoghurt. International Journal of Dairy Science, 17: 24-32.
DOI: 10.3923/ijds.2022.24.32
URL: https://scialert.net/abstract/?doi=ijds.2022.24.32
DOI: 10.3923/ijds.2022.24.32
URL: https://scialert.net/abstract/?doi=ijds.2022.24.32
INTRODUCTION
Goat milk is highly nutritious milk that contains easily digested and absorbed proteins and fats. It has less allergenic properties than cow milk1,2 and has high levels of iron, zinc, magnesium, calcium, phosphorus and vitamins A and B. Consequently, goat milk is considered to have a nutritional value similar to that of milk from a human mother3,4. Goat milk is also used for patients with food absorption problems, including malabsorption and malfunctioning of the small intestine5-7. However, goat milk has a specific “goaty” smell. Consequently, some groups of consumers dislike goat milk. However, when goat milk is processed into fermented milk or yoghurt, the smell disappears and its nutritive value is enhanced5. Yoghurt is a fermented milk product generated by Streptococcus thermophilus and Lactobacillus bulgaricus, with lactose being converted to lactic acid during the fermentation process8. Yoghurt is a popular product because it is a healthy food able to digest and absorb nutrients. It is suitable for patients suffering from lactose intolerance or gastrointestinal disorders, such as inflammatory and irritable bowel diseases. Yoghurt also reduces cholesterol, increases immune function, controls weight and prevents colon cancer and Helicobacter pylori infection9-11. The quality of yoghurt depends on its physicochemical, microbiological and sensory properties12. Compared to cow’s milk yoghurt, goat milk yoghurt has a smaller fat globule size and lower αs1-casein quantity (leading to a different texture), along with lower viscosity and higher syneresis. Goat milk yoghurt products have been developed that improve texture, nutrition and health benefits, making them more attractive to consumers, by adding various ingredients, such as strawberry, cupuassu, oat-maltodextrin, inulin and butterfly pea13,14.
Basella spp. belongs to the Basellaceae family. Its common names include Malabar spinach, Indian spinach, Ceylon spinach and vine spinach15. It originates from South Asia and is found in Malaysia, the Philippines, Africa and Thailand. Basella spp. is a vegetable that is rich in high-value nutrients, containing essential amino acids, such as arginine, isoleucine, leucine, lysine, threonine and tryptophan. It also contains vitamin A, vitamin C, vitamin B9 (folic acid), thiamine, riboflavin and niacin, as well as calcium, magnesium, iron and several vital antioxidants16. Basella sp. fruit and juice are purple-black when ripe and the pulp is soft. The main substances contained in the fruit are betalains, which are water-soluble and include gomphrenin-I, beanidin dihexose, betalains and isobetanidin dihexose. These compounds have antioxidant and anti-inflammatory effects17. The colourants obtained from Basella sp. fruit are not toxic. In addition, the pigments in Basella sp. fruit are resistant to pH 3-7, light, temperature, reducing agents and citric acid18. Ripe Basellan sp. fruit has been used in ice cream products to enhance their visual appeal and nutritive value without impacting the taste or sensory properties19. The colourants in Basella sp. fruit could be used to substitute synthetic colours and increase the nutritive value when developing functional foods. However, the use of Basella sp. fruit pigments to enhance the nutritive value of goat milk yoghurt products has not been investigated. This study investigated the effect of Basella sp. fruit colour powder on the physical, chemical, sensory and microbiological qualities of goat milk yoghurt.
MATERIALS AND METHODS
Study area: This study was carried out at the Laboratory of the Faculty of Science and Technology, Rajamangala University of Technology Tawan-ok, Thailand, from November, 2020 to March, 2021.
Materials: Raw goat milk was obtained from a goat on a farm in Chachoengsao Province, Thailand. Commercial yoghurt, consisting of Lactobacillus delbrueckii subsp. bulgaricus and Streptococcus thermophilus, was used in yoghurt production. Basella spp. fruit powder was obtained from the laboratory of Food Science and Technology, Rajamangala University of Technology Tawan-ok, Thailand.
Production of goat milk yoghurt: Goat milk yoghurt production was adapted from the methods of Damunupola et al.4 and Bruzantin et al.20. Goat milk were pasteurized at 85°C for 5 min and then, the temperature was reduced to 10°C. Pasteurized goat milk was heated to 80°C, then 6% sugar (w/v) and 3% isolate whey protein (w/v) were added and the temperature was maintained for 5 min. Goat milk was cooled to 40°C and inoculated with 4% w/v starter culture commercial yoghurt. Goat milk was separated into six equal portions; one for the control and the other five for the experiments. Basella spp. fruit powder (BFP) was added to the experimental goat milk at 1.0, 1.5, 2, 2.5 and 3% (w/v) and incubated at 42°C for 6 hrs. Goat milk yoghurt samples were stored in a refrigerator at 4°C until analysis.
Physiochemical analysis
pH and titratable acidity analysis: The pH of the goat milk yoghurt samples was measured with a pH meter (Consort C830, Belgium). Lactic acid content was adapted from the method of Anuyahong et al.11. Goat milk yoghurt samples were diluted with distilled water at a ratio of 1:9 and titrated with 0.01 N NaOH using 0.1% phenolphthalein as an indicator. The amount of acid produced from the yoghurt was expressed as g lactic acid/100 g yoghurt.
Colour analysis: The colour of the goat milk yoghurt samples was evaluated with a colorimeter (Konica Minolta CM-3500d, Japan). The instrument processed the measured data using SpectraMagic software version NX. The results were expressed as CIE L*, a* and b* colour values, where L* is the lightness value, a* is the redness (+) to greenness (-) and b* is the yellowness (+) to blueness (-) of the yoghurt21.
Viscosity analysis: The apparent viscosity of 300 mL goat milk yoghurt samples was measured at 5°C using a Brookfield concentric cylinder viscometer (Brookfield Model RVDV-III, USA). Viscosity analysis was performed according to the method described by Madora et al.9.
Syneresis analysis: Syneresis of goat milk yoghurt was determined using a centrifugation procedure adapted from Mani-Lopez et al.22 Ten grams of goat milk yoghurt were weighed and centrifuged at 5000 g and 4°C for 20 min using a centrifuge (Hermle Labortechnik Z 36 HK, Germany). The separated liquid was weighed. Syneresis was calculated using the following equation:
 |
where, Ws is the weight of the supernatant after centrifugation and Wt is the weight of the total yoghurt sample in the tube.
Proximate analysis: Goat milk yoghurt was analyzed for fibre, moisture, ash, protein, fat and carbohydrate according to the method of Pires et al.23.
Sensory analysis: One hundred and twenty untrained panellists the sensory acceptability of goat milk yoghurt after 1 day of refrigerated storage. The panellists had an age between 20-75 years, regularly consume yoghurt and were not allergic to milk. Sensory attributes included colour, goaty odour, yoghurt odour, texture, sour flavour, sweet flavour and overall acceptance. A 9-point hedonic scale was used that was adapted from Moreno-Montoro et al.24 Specifically: 9: Like extremely 8: Like very much, 7: Like moderately, 6: Like slightly, 5: Neither like nor dislike, 4: Dislike slightly, 3: Dislike moderately, 2: Dislike very much, 1: Dislike extremely.
Microbiological analysis: The microbial composition of goat milk yoghurt was analyzed for the total bacterial count, lactic acid bacteria, Escherichia coli, yeast and mould. The analyses were adapted from the methods of Damunupola et al.4 and Salih et al.25. Twenty-five grams of yoghurt sample were added to 225 mL of 0.1% peptone water, which was homogenized using a Stomacher for 2 min, after which the sample was serially diluted. The total bacterial count was determined using plate count agar (PCA). Lactic acid bacteria were determined using De Man, Rogosa and Sharpe (MRS). Escherichia coli were detected using eosin methylene blue agar (EMB) after incubation at 37°C for 48 hrs. Yeast and mould were determined using sabouraud dextrose agar (SDA) and incubated at 25°C for 5 days. The results were reported as log10 colony-forming units (CFU/g). The coliform test followed the method described by da Costa et al.26.
Changes to goat milk yoghurt during storage: Changes to goat milk yoghurt supplemented with BFP were compared with the control during storage at 4±1°C for 21 days. Physicochemical and microbiological properties were evaluated on days 1, 7, 14 and 21 based on methods adapted from Damunupola et al.4.
Statistical analysis: Statistical analysis was performed using a completely randomized design (CRD). The results are shown as Mean±Standard Deviation (Mean±SD). The mean difference was tested with one-way ANOVA and Duncan's Multiple Range Test (DMRT) at the 95% confidence level using SPSS version 11.5, based on three iterations of experimental data.
RESULTS AND DISCUSSION
Physicochemical analysis of goat milk yoghurt: Comparison of 1-3% BFP goat milk yoghurt with the control revealed no statistical difference in pH and lactic acid (p>0.05, pH: 4.29-4.31 BFP yoghurt, 4.32 control, lactic acid: 0.82-0.90 BFP yoghurt, Table 1). Acid bacteria (producing a starter culture) cause yoghurt pH to decline, converting lactose to organic acids, especially lactic acid21,27,28. The BFP did not affect the growth of lactic acid bacteria during the fermentation of goat milk yoghurt. Madora et al.9 reported that yoghurt with 1, 2 and 3% of added carrot powder had a pH of 4.27-4.32 and lactic acid content of 0.94-1.01. Damunupola et al.4 reported that goat milk yoghurt with beetroot juice had a pH of 4.45 and a lactic acid content of 0.85. However, the amount of lactic acid affects the sourness and flavour of yoghurt products and hence, consumer preferences. A pH of 4.2 could affect the stability of the structural network of yoghurt29.
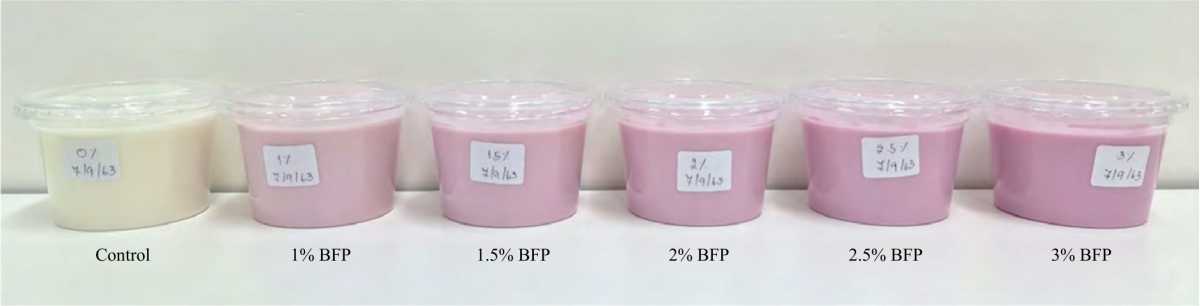 |
| Fig. 1: | Goat milk yoghurt fortified with BFP |
| Table 1: | Physicochemical analysis of goat milk yoghurt fortified with BFP | ||||||
Colour | |||||||
| Treatments | pHns | Acidicns (%) | Syneresis (%) | Viscosity (cP) | L* | a* | b* |
| Control | 4.32±0.06 | 0.90±0.00 | 14.66±0.26a | 3257.67±10.02a | 81.79±0.05a | -1.72±0.03a | 5.67±0.08a |
| 1% BFP | 4.31±0.07 | 0.86±0.06 | 9.94±1.65b | 3299.20±159.48ab | 76.29±0.25b | 4.46±0.22b | 1.34±0.20b |
| 1.5% BFP | 4.30±0.07 | 0.82±0.06 | 9.49±2.98b | 3418.00±92.88ab | 70.91±0.30c | 10.27±0.23c | -2.64±0.18c |
| 2% BFP | 4.30±0.06 | 0.84±0.06 | 8.70±1.95b | 3781.20±71.25c | 68.69±0.24d | 12.42±0.21d | -3.92±0.06d |
| 2.5% BFP | 4.29±0.02 | 0.82±0.12 | 8.28±0.66b | 4175.80±67.12d | 66.79±0.35e | 14.03±0.23e | -4.78±0.09e |
| 3% BFP | 4.29±0.03 | 0.80±0.00 | 8.23±0.23b | 4492.80±236.81e | 65.09±0.42f | 15.45±0.38f | -5.51±0.06f |
| Data represent the average of 3 replicates, ±SD: Mean±Standard deviation, Different letters in columns indicate significant differences (p<0.05) and ns: Non-significant (p>0.05) | |||||||
The syneresis of 1-3% BFP goat milk yoghurt was 8.23-14.66%, which was significantly different from the control (p<0.05). The viscosity effect of 1-3% BFP goat milk yoghurt was 3257.67-4492.80 cP. Goat milk yoghurt fortified with 3% BFP had the highest viscosity (4492.80 cP) and was significantly different to that with 1-2.5% BFP and the control (p<0.05). The control had the lowest viscosity (3257.67 cP), it did not differ from yoghurt with 1 and 1.5% BFP (p>0.05), but did differ from yoghurt with 2, 2.5 and 3% BFP (p<0.05) (Table 1). The percentage of syneresis and viscosity was correlated to food quality and consumer acceptance. Consumers do not accept yoghurt that is too liquid, too viscous or contains layers. When more BFP was added in our experiment, syneresis of the yoghurt decreased, whereas viscosity increased because BFP contains maltodextrin to encapsulate the colour of Basella spp. fruit. Maltodextrin is a polysaccharide carbohydrate that is obtained by digesting starch molecules to short glucose chains. The addition of 0, 0.125, 0.25 and 0.5% Riceberry Rice Extract (RBE) to yoghurt yielded 14.13, 12.0, 8.45 and 8.14%, syneresis, respectively11. The addition of 1, 2 and 3% carrot powder to yoghurt yielded a viscosity of 3092, 3407 and 3494 cP, respectively9. Thus, the percentage of syneresis and viscosity increased with increasing proportions of RBE and carrot powder. Combining maltodextrin with modified starch in non-fat yoghurt production generates a smooth, fine creamy texture and good feeling when consumed30. The highest viscosity is obtained in yoghurt with low acidity and high pH31.
Yoghurt viscosity is affected by the number and strength of the bonds between casein micelles. Casein aggregates from at an isoelectric pH <4.9, with a maximum gel stiffness occurring at pH 4.6. A higher viscosity is directly proportional to the production of exopolysaccharides by lactic acid bacteria during yoghurt fermentation31.
Colour analysis of 1-3% BFP yoghurt showed statistically significant differences in L*, a* and b* values (p<0.05) (Table 1). L* measures brightness, while positive and negative a* values correspond to reddish and greenish colours, respectively and those of b* correspond to yellowish and bluish colours, respectively. The control had the highest L* and b* values (81.79 and 5.67, respectively) and the lowest a* value (-1.72). The 3% BFP treatment had the lowest L* and b* values (65.09 and -5.51, respectively) and the highest a* value (15.45). The red colour of goat milk yoghurt increased with the percentage of added BFP. Thus, pigment concentration increased due to the dark pink colour of BFP (Fig. 1). Food colour reflects the degree of preference by consumers32-34.
 |
| Fig. 2: | Consumer acceptance scores for goat milk yoghurt |
| Table 2: | Nutritional composition of goat milk yoghurt fortified with BFP | |||||
Nutritional composition (%) | ||||||
| Treatments | Moisture | Ashns | Fiberns | Proteinns | Fatns | Carbohydrate |
| Control | 78.35±0.36a | 0.81±0.29 | 0.05±0.03 | 4.51±1.13 | 1.92±0.03 | 14.07±1.00a |
| 1% BFP | 78.15±0.41a | 0.87±0.49 | 0.04±0.03 | 4.22±0.05 | 1.90±0.11 | 14.81±0.78a |
| 1.5% BFP | 77.40±0.28b | 0.97±0.49 | 0.03±0.02 | 4.72±0.40 | 1.88±0.09 | 15.00±0.40a |
| 2% BFP | 77.11±0.74b | 0.96±0.54 | 0.06±0.09 | 4.92±0.01 | 1.89±0.06 | 15.05±1.19a |
| 2.5% BFP | 77.05±0.73b | 0.86±0.29 | 0.05±0.00 | 4.77±0.03 | 1.84±0.17 | 15.42±0.89b |
| 3% BFP | 76.64±0.33c | 0.97±0.47 | 0.03±0.02 | 4.37±0.38 | 1.80±0.11 | 16.20±0.69b |
| Data represent the average of 3 replicates, ±SD: Mean±Standard deviation, different letters in columns indicate significant differences (p<0.05) and ns: Non-significant (p>0.05) | ||||||
Proximate analysis of goat milk yoghurt: The percentages of ash, fibre, protein and fat did not significantly differ between BFP yoghurt and the control (p>0.05). Yoghurt with 3% BFP had the lowest moisture and the highest carbohydrates contents (p<0.05, Table 2). Because maltodextrin is an encapsulate additive, it affects the nutrients in food. For example, goat milk yoghurt with BR juice has moisture, fat, protein, ash and total solid contents of 79.08, 2.46, 4.59, 0.93 and 20.42%, respectively4. Goat milk yoghurt with cupuassu (which is a native fruit of the Amazon forest zone) and skimmed or skim milk, has protein, fat and moisture contents of 2.23-6.84, 0.23-2.75 and 85.33-90.36%, respectively21.
Sensory analysis of goat milk yoghurt: The control had higher hedonic scores for colour, goaty odour, yoghurt odour, texture, sour flavour and overall acceptability as compared to the BFP treatments (p<0.05), except for sweet flavour. The likely scores for 3% BFP yoghurt were significantly different (p<0.05). Yoghurt with 2.5% BFP had only slightly lower preference scores for colour, goaty odour, yoghurt odour, sour flavour and overall acceptability than the control (Fig. 2). Anuyahong et al.11 obtained higher scores for colour, odour, flavour, texture, appearance and overall acceptability in the control as compared to yoghurt with 0.125-0.5% RBE. However, 0.25% RBE treated yoghurt had only slightly lower consumer acceptability than the control.
Flavour and texture are the most important qualities of yoghurt for consumer acceptance. Many factors affect the flavour and texture of yoghurt, such as starter culture, incubation temperature, process conditions and various components of milk used in production9. Therefore, goat milk yoghurt fortified with 2.5% BFP had the highest acceptability after the control. Thus, only 2.5% BFP yoghurt was used in the subsequent analyses.
 |
| Fig. 3(a-b): | Changes to (a) pH and (b) Acid content of BFP and control goat milk yoghurt over the 21 days storage period *Significant difference (p<0.05) |
| Table 3: | Changes to the colour values of goat milk yoghurt fortified with BFP over a 21 days storage period | |||
| Treatments | Storage Time (days) | L* | a* | b* |
| Control | 1 | 90.23±0.29a | -1.74±0.03a | 10.07±0.12a |
7 | 90.16±0.05a | -1.85±0.04ab | 10.16±0.25a | |
14 | 90.14±0.09a | -2.02±0.06c | 10.23±0.10a | |
21 | 90.07±0.05a | -1.92±0.11bc | 10.38±0.10a | |
| 2.5% BFP | 1 | 66.83±0.51a | 20.73±0.34a | -5.94±0.06a |
7 | 67.24±0.24a | 20.12±0.23b | -5.20±0.18b | |
14 | 68.94±0.06b | 17.95±0.12c | -3.98±0.03c | |
21 | 69.13±0.04b | 17.56±0.06c | -3.38±0.07d | |
| Data represent the average of 3 replicates, ±SD: Mean±Standard deviation, different letters in columns indicate significant differences (p < 0.05) | ||||
Changes to the physicochemical and microbiological properties of goat milk yoghurt during storage: The pH of both 2.5% BFP yoghurt and the control significantly declined on days 7, 14 and 21 (p<0.05) and were not statistically different (p>0.05). In contrast, the lactic acid content of 2.5% BFP yoghurt slightly increased from day 1, which was, however, not statistically significant (p>0.05). The lactic acid content in the control was slightly but significantly lower than that of the 2.5% BFP from day 1 (p<0.05) (Fig. 3a-b). During storage at low temperatures, yoghurt pH gradually declines until the end of its shelf life, due to the slowing metabolic activity of the starter culture. Furthermore, a lower pH limits the growth of germs and causes the lactose fermentation process to slow35,36.
Over the 21 days shelf life, L* (lightness) and b* (yellowness) were lower in 2.5% BFP yoghurt than the control, whereas a* (redness) was higher. The control showed a slight decrease in L* and b*, with a* values changing significantly over time (p<0.05). In contrast, L*, a* and b* values significantly changed in 2.5% BFP yoghurt over time (p<0.05). In particular, a* (red) decreased from day 1 (initial value: 20.73) and significantly decreased on days 7, 14 and 21 (p<0.05, Table 3). Because BFP is a naturally occurring pigment, it decomposes quickly when exposed to light or heat37,38. When a* decreased, L* (brightness) and b* (yellowness) increased with increasing shelf life. This phenomenon was also recorded by Öztürk et al.10, who found that the brightness (L*) and yellow colour (b*) of yoghurt supplemented with lavender powder and stored at 4°C for 14 days were not significantly different to the control yoghurt over the shelf life, however, the red colour (a*) of yoghurt changed significantly. Anuyahong et al.11 showed that yoghurt with RBE had lower L* and b* values than the control, but higher a* values over the 21 days shelf life. The colour value of yoghurt with RBE remained unchanged until the end of storage, except for the a* value. Yellow colouration increased over time due to an oxidation reaction, in which anthocyanins deteriorated39.
Goat milk yoghurt fortified with 2.5% BFP contained more lactic bacteria than the control over the shelf life. The number of lactic acid bacteria rose from day 1 (7.94 log CFU g–1) to day 7 and 14 (8.09 and 9.40 log CFU g–1), respectively. The number of lactic acid bacteria on day 14 was the highest and significantly different from that on days 1 and 7 (p<0.05). On day 21, the number of lactic acid bacteria declined (to 7.93 log CFU g–1). A similar trend was detected in the control, the number of lactic acid bacteria rose from day 1-14 and decreased on day 21, but there was no significant difference (p>0.05, Fig. 4a). Anuyahong et al.11 found that the number of lactic acid bacteria decreased on day 14 in low-temperature storage. This phenomenon could be attributed to ingredients, the amount of oxygen, moisture, water activity, storage temperature, pH, acid amount and packaging40. The number of lactic acid bacteria in yoghurt filled with BFP met the Ministry of Public Health’s recommendation on sourness, as 7 log CFU g–1 of microorganisms remained in the non-sterile curd after fermentation.
 |
| Fig. 4(a-b): | Changes to the (a) Lactic acid bacteria count and (b) Total bacteria count of control and 2.5% BFP goat milk yoghurt *Significant difference (p<0.05) |
Both the control and 2.5% BFP had similar total bacterial counts, which significantly increased from day 1 to the end of shelf life (p<0.05, Fig. 4b). Yeast, mould, coliform bacteria and Escherichia coli were not detected over the 21 days (data not shown). Damunupola et al.4 reported that the total bacterial count of the control and yoghurt with BR juice were not different on days 1 and 21, however, total bacterial numbers increased significantly on day 14 and decreased on day 21 of storage. The decrease in the total number of bacteria was attributed to acid production. While no coliform bacteria were found, 1-2 colonies of yeast and mould were found during the post-storage period. El-Kholy et al.36 did not detect fungi or yeast in probiotic-fortified yoghurt samples, either initially or during the storage period. These results were obtained because yoghurt was produced under hygienic conditions, with good preparation and storage. Yeast is the main parameter spoiling yoghurt and fermented milk products. An increase in acid and decrease in oxygen during the fermentation process generate optimal conditions for yeast growth36. Yoghurt produced under good manufacturing practices must not exceed 108 yeast cells and should have a shelf life of 3-4 weeks at 5°C. However, yoghurt with yeast cell counts >100 CFU g–1 tends to spoil more quickly9. Moreover, coliform bacteria are used as an indicator of hygiene in production and packaging processes. If food is contaminated with coliform, it is an obvious indicator of unsanitary processing and faecal pollution, which is a public health concern26.
CONCLUSION
This study showed that in general goat milk yoghurt fortified with BFP retained a similar pH and lactic acid, ash, fibre, protein and fat contents to the control. Only 3% BFP had a higher viscosity, redness and carbohydrate content and lower moisture content than the control. Goat milk yoghurt fortified with 2.5% BFP had the second-highest overall liking score. The colour of goat milk yoghurt fortified with BFP declined with storage time, especially the red value, however, the count of lactic acid bacteria rose. Therefore, BFP could be used as a natural pigment when developing goat milk yoghurt as a healthy food product. Future studies on other bioactive parameters (such as an antioxidant activity) involved in in vitro gastrointestinal digestion are required, along with studies on how to develop BFP that is stable throughout the required shelf life.
SIGNIFICANCE STATEMENT
S
This study discovers that Basella sp. fruit powder could be used as a natural additive to goat milk yoghurt, without reducing product quality or shortening shelf life. These findings are important and timely due to the increasing awareness of consumers and food quality boards for the need to improve the quality of foods while reducing the use of synthetic additives in healthy food products. We further demonstrate the viability of natural products for enhancing the shelf life and the consumer preferences for perishable foods, which will help design novel healthy food products.
ACKNOWLEDGMENTS
This research was supported financially (research and publishing) by the Thailand Science Research and Innovation (TSRI), project number: 39/2563. This research was supported technically by the Rajamangala University of Technology Tawan-ok.
REFERENCES
- Ranadheera, C.S., C.A. Evans, M.C. Adams and S.K. Baines, 2012. Probiotic viability and physico-chemical and sensory properties of plain and stirred fruit yogurts made from goat's milk. Food Chemistry, 135: 1411-1418.
CrossRefDirect Link - Mituniewicz-Małek, A., M. Ziarno and I. Dmytrów, 2014. Incorporation of inulin and transglutaminase in fermented goat milk containing probiotic bacteria. J. Dairy Sci., 97: 3332-3338.
CrossRefDirect Link - Slacanac, V., R. Bozanic, J. Hardi, J.R. Szabo, M. Lucan and V. Krstanovic, 2010. Nutritional and therapeutic value of fermented caprine milk. Int. J. Dairy Technol., 63: 171-189.
CrossRefDirect Link - Damunupola, D.A.P.R., W.A.D.V. Weerathilake and G.S. Sumanasekara, 2014. Evaluation of quality characteristics of goat milk yoghurt incorporated with beetroot juice. Int. J. Sci. Res. Publ., Vol. 4.
Direct Link - Jia, R., H. Chen, H. Chen and W. Ding, 2016. Effects of fermentation with Lactobacillus rhamnosus GG on product quality and fatty acids of goat milk yogurt. J. Dairy Sci., 99: 221-227.
CrossRefDirect Link - Desouky, M.M. and M.H. El-Gendy, 2017. Physicochemical characteristics of functional goats' milk yogurt as affected by some milk heat treatments. Int. J. Dairy Sci., 12: 12-27.
CrossRefDirect Link - Paz, N.F., E.G. de Oliveira, M.S.N. de Kairuz and A.N. Ramón, 2014. Characterization of goat milk and potentially symbiotic non-fat yogurt. Food Sci. Technol., 34: 629-635.
CrossRefDirect Link - Amadou, N.M., E.A. Richard, K. Jules-Roger, N.C. Waingeh and K.D. Ateh et al., 2018. Effect of ginger extract on the physicochemical and sensory properties of yoghurt. Int. J. Dev. Res., 8: 20468-20477.
Direct Link - Madora, E.P., T.K. Takalani and M.E. Mashau, 2016. Physicochemical, microbiological and sensory properties of low fat yoghurt fortified with carrot powder. Int. J. Agric. Biol. Eng., 9: 118-124.
Direct Link - Öztürk, H.İ., S. Aydın and N. Akın, 2017. Effect of lavender powder on microbial, physicochemical, sensory and functional properties of yoghurt. Int. J. Sec. Metabolite, 4: 94-102.
CrossRefDirect Link - Anuyahong, T., C. Chusak and S. Adisakwattana, 2020. Incorporation of anthocyanin-rich riceberry rice in yogurts: Effect on physicochemical properties, antioxidant activity and in vitro gastrointestinal digestion. LWT, Vol. 129.
CrossRefDirect Link - Yang, G.H., J.J. Guan, J.S. Wang, H.C. Yin, F.D. Qiao and F. Jia, 2012. Physicochemical and sensory characterization of ginger-juice yogurt during fermentation. Food Sci. Biotechnol., 21: 1541-1548.
CrossRefDirect Link - Delgado, K.F., B.D.S. Frasao, M.P. da Costa and C.A.C. Junior, 2017. Different alternatives to improve rheological and texture characteristics of fermented goat products-A review. Rheology, Vol. 1.
Direct Link - Suharman, A. Sutakwa and L.S. Nadia, 2021. Effects of sucrose addition to lactic acid concentrations and lactic acid bacteria population of butterfly pea (Clitoria ternatea L.) yogurt. J. Phys.: Conf. Ser., Vol. 1823.
CrossRefDirect Link - Roy, S.K., G. Gangopadhyay and K.K. Mukherjee, 2010. Is stem twining from of Basella alba L. a naturally occurring variant. Curr. Sci, 98: 1370-1375.
Direct Link - Kumar, S.S., P. Manoj and P. Giridhar, 2015. Nutrition facts and functional attributes of foliage of Basella spp. LWT-Food Sci. Technol., 64: 468-474.
CrossRefDirect Link - Lin, S.M., B.H. Lin, W.M. Hsieh, H.J. Ko, C.D. Liu, L.G. Chen and R.Y. Chiou, 2010. Structural identification and bioactivities of red-violet pigments present in Basella alba fruits. J. Agric. Food Chem., 58: 10364-10372.
CrossRefDirect Link - Deshmukh, S.A. and D.K. Gaikwad, 2014. A review of the taxonomy, ethnobotany, phytochemistry and pharmacology of Basella alba (basellaceae). J. Appl. Pharm. Sci., 4: 153-165.
CrossRefDirect Link - Kumar, S.S., P. Manoj, N.P. Shetty, M. Prakash and P. Giridhar, 2015. Characterization of major betalain pigments-gomphrenin, betanin and isobetanin from Basella rubra L. fruit and evaluation of efficacy as a natural colourant in product (ice cream) development. J. Food Sci. Technol., 52: 4994-5002.
CrossRefDirect Link - Bruzantin, F.P., J.L.P. Daniel, P.P.M. da Silva and M.H.F. Spoto, 2016. Physicochemical and sensory characteristics of fat-free goat milk yogurt with added stabilizers and skim milk powder fortification. J. Dairy Sci., 99: 3316-3324.
CrossRefDirect Link - Costa, M.P., B.S. Frasao, B.L. Rodrigues, A.C. Silva and C.A. Conte-Junior, 2016. Effect of different fat replacers on the physicochemical and instrumental analysis of low-fat cupuassu goat milk yogurts. J. Dairy Res., 83: 493-496.
CrossRefDirect Link - Mani-Lopez, E., E. Palou and A. Lopez-Malo, 2014. Probiotic viability and storage stability of yogurts and fermented milks prepared with several mixtures of lactic acid bacteria. J. Dairy Sci., 97: 2578-2590.
CrossRefDirect Link - Pires, T.C.S.P., M.I. Dias, L. Barros, J.C.M. Barreira, C. Santos-Buelga and I.C.F.R. Ferreira, 2018. Incorporation of natural colorants obtained from edible flowers in yogurts. LWT-Food Sci. Technol., 97: 668-675.
CrossRefDirect Link - Moreno-Montoro, M., M. Navarro-Alarcón, T. Bergillos-Meca, R. Giménez-Martínez, S. Sánchez-Hernández and M. Olalla-Herrera, 2018. hysicochemical, Nutritional, and Organoleptic Characterization of a Skimmed Goat Milk Fermented with the Probiotic Strain Lactobacillus plantarum C4 Nutrients, Vol. 10, No. 5.
CrossRefDirect Link - Salih, Z.A., A. Siddeeg, A.F. Ammar, A.I.E. Ibrahim and A.O. Ali, 2019. The physicochemical, microbiological and sensory properties of yoghurt processed by addition of rice flour. Ann. Obes. Disord., Vol. 4.
Direct Link - da Costa, M.P. and C.A. Conte-Junior, 2015. Chromatographic methods for the determination of carbohydrates and organic acids in foods of animal origin. Comprehen. Rev. Food Sci. Food Saf., 14: 586-600.
CrossRefDirect Link - Chen, C., S. Zhao, G. Hao, H. Yu, H. Tian and G. Zhao, 2017. Role of lactic acid bacteria on the yogurt flavour: A review. Int. J. Food Prop., 20: S316-S330.
CrossRefDirect Link - Paz-Díaz, H.J., L.Z. Mora-Vergara, C.E. Navarro-Arana, A.S. Navarro and M.M. Pacheco-Valderrama, 2021. Effect of process variables on the physicochemical and rheological properties of yogurt. Rev. U.D.C.A Actualidad Divulgación Científica, Vol. 24.
CrossRefDirect Link - Sandoval-Castilla, O., C. Lobato-Calleros, E. Aguirre-Mandujano and E.J. Vernon-Carter, 2004. Microstructure and texture of yogurt as influenced by fat replacers. Int. Dairy J., 14: 151-159.
CrossRefDirect Link - Krisnaningsih, A.T., P. Purwadi, H. Evanuarini and D. Rosyidi, 2019. The effect of incubation time to the physicochemical and microbial properties of yoghurt with local taro (Colocasia esculenta (L.) schott) starch as stabilizer. Curr. Res. Nutr. Food Sci., 7: 547-554.
CrossRefDirect Link - Phadungath, C., 2005. The mechanism and properties of acid-coagulated milk gels. Songklanakarin J. Sci. Technol., 27: 433-448.
Direct Link - Pathare, P.B., U.L. Opara and F.A.J. Al-Said, 2013. Colour measurement and analysis in fresh and processed foods: A review. Food Bioprocess Technol., 6: 36-60.
CrossRefDirect Link - Reshmi, S.K., K.M. Aravindhan and P.S. Devi, 2012. The effect of light, temperature, pH on stability of betacyanin pigments in Basella alba fruit. Asian J. Pharm. Clin. Res., 5: 107-110.
Direct Link - Chye, S.J., R. Ahmad and A.A.N. Aziah, 2012. Studies on the physicochemical and sensory characteristics of goat’s milk dadih incorporated with tropical- fruit purees. Int. Food Res. J., 19: 1387-1392.
Direct Link - Sah, B.N.P., T. Vasiljevic, S. McKechnie and O.N. Donkor, 2015. Physicochemical, textural and rheological properties of probiotic yogurt fortified with fibre-rich pineapple peel powder during refrigerated storage. LWT - Food Sci. Technol., 65: 978-986.
CrossRefDirect Link - El-Kholy, W.M., R.A. Aamer and A.N.A. Ali, 2020. Utilization of inulin extracted from chicory (Cichorium intybus L.) roots to improve the properties of low-fat synbiotic yoghurt. Ann. Agric. Sci., 65: 59-67.
CrossRefDirect Link - Ozela, E.F., P.C. Stringheta and M.C. Chauca, 2007. Stability of anthocyanin in spinach vine (Basella rubra) fruits. Cienc. Invest. Agric., 34: 115-120.
CrossRefDirect Link - Reshmi, S.K., K.M. Aravinthan and P.S. devi, 2012. Antioxidant analysis of betacyanin extracted from Basella alba fruit. Int. J. Pharmtech Res., 4: 900-913.
Direct Link - de Nazaré do Carmo Brito, B., R. da Silva Pena, A.S. Lopes and R.C. Chisté, 2017. Anthocyanins of jambolão (Syzygium cumini): Extraction and pH-dependent color changes. J. Food Sci., 82: 2286-2290.
CrossRefDirect Link - Tripathi, M.K. and S.K. Giri, 2014. Probiotic functional foods: Survival of probiotics during processing and storage. J. Funct. Foods, 9: 225-241.
CrossRefDirect Link