
H. A. Abdul Bari
Faculty of Chemical and Natural Resources Engineering, Universiti Malaysia Pahang, Kuantan, 25000, Pahang, Malaysia
R. B. Mohd. Yunus
Faculty of Chemical and Natural Resources Engineering, Universiti Malaysia Pahang, Kuantan, 25000, Pahang, Malaysia
W. K. Mahmood
Faculty of Chemical Engineering, University of Technology, Tal-Mohammed, Baghdad, Iraq
Z. B. Hassan
Faculty of Chemical and Natural Resources Engineering, Universiti Malaysia Pahang, Kuantan, 25000, Pahang, Malaysia
International Journal of Chemical Technology
Year: 2009 | Volume: 1 | Issue: 1 | Page No.: 11-18


ABSTRACT
The aim of the present investigation was to decline the solubility condition that number of previous investigation put for any component to be classified as drag reducing agent. In the present investigation, Sodium Stearate (SS) with different concentrations (50 to 300 w ppm) was used. The solvent was used gas oil flowing in three pipe diameters pipelines (0.508, 0.254 and 0.01905 m) and within flow rate range starting from 1.9 to 4.5 m3 h-1. All the experimental work was carried out in a built-up closed loop liquid circulation system with three testing sections (2 m long) of the three pipe diameters investigated. The experimental results showed that, percentage drag reduction (Dr %) increases by increasing the surfactant concentration and Reynolds number. Also, Dr (%) was found to increase by decreasing the pipe diameter. The results proved that, the additive solubility in the transported media is not a condition to classify the chemical as drag reducing agent. Experimental work correlation equation was suggested representing the percentage drag reduction as a function of Reynolds number.
PDF Abstract XML References Citation
How to cite this article
H. A. Abdul Bari, R. B. Mohd. Yunus, W. K. Mahmood and Z. B. Hassan, 2009. Sodium Stearate as Drag Reducing Agent in Non-Aqueous Media. International Journal of Chemical Technology, 1: 11-18.
DOI: 10.3923/ijct.2009.11.18
URL: https://scialert.net/abstract/?doi=ijct.2009.11.18
DOI: 10.3923/ijct.2009.11.18
URL: https://scialert.net/abstract/?doi=ijct.2009.11.18
INTRODUCTION
Drag reduction or flow improving in pipelines carrying petroleum products or crude oils, was one of the main challenges especially in the last few decades when the term power saving, raised up due to the rapid increase in global power consumption. One of the major sectors that deal with huge amounts of power losses is the liquids transportations through pipelines. It is known that, liquids (water, crude oil and refinery products) are transported in pipelines in a turbulent mode (Reynolds number higher than 2500) and that will lead to huge pumping power losses along the pipelines (especially strategic pipelines). Drag Reducing Agents (DRA’s) were used in the past few decades to improve the flow in pipelines and to increase it without the need for any changes in the geometry of the pipeline system. These agents can be classified into three major categories which are (Virk et al., 1970): (i) polymers, (ii) surfactants and (iii) suspended solids.
Surfactants with its major classifications (certain anionic, cationic, non-ionic and also zwitterionic) are proven to be a powerful drag reducers in turbulent flow in pipes and can hence contribute to significant energy saving. Their drag reduction ability at concentrations as low as part per million is ascribed to the micelles present in the solution. These micelles play a dominant role in the mechanism of turbulence suppression and in the significant friction decrease, which can be even higher than in some high polymer solution.
Siriluck and Sirivat (2007) investigated the influence of ionic strength on the interaction between poly(ethylene oxide) (PEO) and cationic surfactant, hexadecyltrimethylammonium chloride (HTAC) and the consequent effect on turbulent drag reduction in aqueous PEO/HTAC solutions. For the measurement of turbulent drag reduction in a couette cell, their data indicate that the minimum wall shear stress in aqueous HTAC solutions occurs at an optimum HTAC concentration, close to CMC and this optimum concentration value decreases with increasing ionic strength. Finally, their findings provide evidences that the turbulent wall shear stress does not always scale inversely with the hydrodynamic volume of the polymer-surfactant complex.
Sung-Hwan et al. (2007) investigated the drag reduction and heat transfer efficiency reduction of non-ionic surfactant as a function of fluid velocity, temperature and surfactant concentration. Their results showed that existing alkyl ammonium surfactant had Drag Reduction of 60 to 80% at 1000-2000 ppm concentration with fluid temperature ranging between 50 and 60°C. They showed also that the percentage drag reduction decreases when the fluid temperature was 70-80°C. Finally, it was noticed that with fluid temperature ranging between 70 and 80°C the Dr was 0.6-0.8 when the concentration level was between 1000 and 2000 ppm.
Since the early nineties, many studies were published concerning the use of certain additives as Drag reducing Agents in a media that is not compatible with the physical behavior between the additive and the solvent (i.e., the solubility of the additive in the solvent). This condition (the solubility) was one of the basic conditions that any chemical must have to be classified as drag reducing agent (Pereira and Pinho, 2002; Lim et al., 2005; Usui et al., 1995; Mowla and Naderi, 2006; Sher and Hetsroni, 2008; Inaba et al., 1995; Wang et al., 1998).
Later, the classification of the suspended solids (insoluble in liquid media) as Drag Reducing Agents opened the door wide for more research regarding the availability of the solubility condition in the drag reduction phenomena (Mowla and Nadari, 2006; Toorman, 2002; Zhu and Peskin, 2007; Hideo et al., 2000). The capability of insoluble material (solids) to act as a powerful Drag Reducing Agent was the main motivation in the present investigation to prove the capability of insoluble liquids to act as drag reducing agents in the transported hydrocarbon media (kerosene).
MATERIALS AND METHODS
Pipe diameter, solution flow rate and additive concentrations were the variables investigated in the present study. Each set of experimental work deals with sodium stearate in kerosene flowing in one of three pipe diameters within five addition concentrations and seven different solution flow rates. This study was conducted in 2008 in Faculty of Chemical and Natural Resources Engineering, University Malaysia Pahang.
Sodium Stearate (SS)
Sodium Stearate (SS) [CH3 (CH2)16COONa] is a white crystalline anionic surfactant with a molecular weight of 306 g/g mol and active substance of 87%.
SS can be found in most animal and vegetable oils and fats. It is used in lubricating mixtures, water proofing materials and soap manufacturing. SS can be made by reacting glyceryl stearate with water to form stearic acid then the stearic acid reacts with coastic soda to form the sodium stearate.
Flow System Description
The flow system apparatus constructed in the present investigation can be shown from Fig. 1. The reservoir tank was supported with two exit pipes connected to centrifugal pumps.
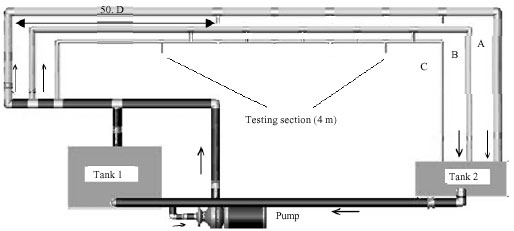 | |
| Fig. 1: | Experimental rig |
| Table 1: | Relative roughness for pipes used |
 | |
| Table 2: | Minimum entrance length for the pies used |
 | |
The first exit pipe with 0.0508 m ID was connected to the main centrifugal pump which delivers the fluid to the testing sections. The other exit is of 0.0127 m ID was connected to the other centrifugal pump for the draining of the solution after each run.
Three seamless carbon steel pipes of various inside diameters (0.0508, 0.0254 and 0.01905 m) with relative roughness shown in Table 1 were used in constructing the flow system. The three sections A, B and C represent the three testing sections with the three pipe diameters investigated.
A complete closed loop piping system was build. Piping starts from the reservoir tank through the pump, reaching a connection that splits the pipe into two sections. The first section returns back to the tank (bypass) and the other splits into three sections with different pipe diameters (testing section). For each pipe diameter, the minimum entrance length required for a fully developed velocity profile in turbulent flow was calculated from the relationship suggested by Desissler (1950).
Le = 50.D | (1) |
Therefore, the minimum entrance length for the present study according of the pipe diameter is shown in Table 2.
Calculations
The average velocity (V) and Reynolds number (Re) were calculated using the solution volumetric flow rate readings (Q), density (ρ), viscosity (μ) and pipe diameter (D), for each run as follows:
(2) |
Pressure drop readings through testing sections before and after drag reducer addition, were needed to calculate the percentage drag reduction Dr (%) as follows (Virk et al., 1970):
| | (3) |
Where:
| Δpa | = | Pressure drop after drag reducer addition |
| Δpb | = | Pressure drop before drag reducer addition |
Fanning friction factor was calculated using the following equation (Yunus and Cimbala, 2006):
(4) |
RESULTS AND DISCUSSION
The results of the experimental work showed that the percentage Drag reduction increases by increasing the transported fluid flow rate presented by Reynolds number (Re) as shown in Fig. 2 and 3. This behavior is due to the increase of the degree of turbulence that provides a suitable media for the drag reducing agent to act efficiently in the media by suppressing the turbulence structures formed.
 | |
| Fig. 2: | Effect of Reynolds number on percentage drag reduction for SS within different concentrations dissolved in kerosene flowing through 0.0254 m ID pipe |
 | |
| Fig. 3: | Effect of Reynolds number on percentage drag reduction for SS within different concentrations dissolved in kerosene flowing through 0.01905 m ID pipe |
Increasing the degree of turbulence means increasing the number of eddies that absorb the energy from the main flow to complete its shape. The penetrated (diluted) molecules of the surfactant added (sodium stearate) will be part of these eddies which will create a new media that these eddies works with and it will be more difficult for these eddies to form and complete its shape with the new addition to its structure done by these additives.
From the results it is also can be noticed that the percentage drag reduction increases by increasing the additive concentration from 50 to 300 and that is due to the increase of the number of the surfactants molecules involved in the drag reduction operation. This behavior also can be seen from Fig. 4 and 5.
The results of this study showed that within certain surfactant type and concentration, Dr (%) Increases by decreasing the pipe diameter, which means that the surfactant will have a better media to work in within smaller pipes (Fig. 6). Decreasing the pipe diameter means increasing the velocity inside the pipe which will increase the turbulence. Although, the flow inside the three pipes is turbulent but the degree of turbulence differs. For smaller pipe, the energy absorbed by the turbulence (eddies) from the main flow will be higher than that for larger pipes. That, whenever the degree of turbulence becomes higher, the number of collisions between eddies will be higher, which will produce smaller eddies. These collisions provide extra number of eddies absorbing energy from the main flow to complete their shape. Overcoming smaller eddies is easier by surfactants than larger once, because of the amount of energy absorbed by smaller eddies is lower.
 | |
| Fig. 4: | Effect of concentration on percentage drag reduction for SS dissolved in kerosene flowing through 0.0254 m ID pipe |
 | |
| Fig. 5: | Effect of concentration on percentage drag reduction for SS dissolved in kerosene flowing through 0.0508 m ID pipe |
 | |
| Fig. 6: | Effect of pipe diameter on percentage drag reduction at different volumetric flow rates, with 200 ppm concentration of SS dissolved in kerosene |
 | |
| Fig. 7: | Friction factor versus Reynolds number at different concentrations of SS surfactant dissolved in kerosene flowing through 0.0254 m ID pipe |
This indication was supported by large number of the experimental results of the present study. That generally, Dr (%) values for pipes of 0.0254 and 0.01905 m ID are close to each other and far from those of 0.0508 m ID.
Another representation to the effect of all variables used in this investigation can be seen using friction factor, which was calculated from Eq. 4.
Figure 7 shows the friction factor for various Re pipe diameters, surfactant concentrations. It can be noticed that, when the surfactant concentrations is zero (pure solvent), most of the experimental data points are located at or close Blasuis asymptote, which give an indication that the starting points of the operation are close to that of the standard operation conditions suggested in the literatures. When the surfactant is presented in the flow, the experimental data points are positioned in the direction of lowering friction towards Virk asymptote that represent maximum limits of drag reduction, which will give the idea that, to reach such an asymptote, higher additive concentration and Re are needed for each pipe diameter. But, it must be considered that higher concentrations should not affect solvent properties, also by considering the economical costs of raw material of drag reducing agents, therefore it was difficult to reach virk asymptote without affecting the investigated solvent properties.
From the results, it can be noticed that the SS can be classified as drag reducing agent although it is not soluble in the transported media. This phenomenon may be due to the idea of DRA molecules penetration instead of solubility which will open the door for anew explanations depending on those regarding the drag reduction caused by suspended solids. Which will lead to the idea of having these penetrated molecules as part of the turbulence inside the transport pipe which will prevent eddies from completing its shape and that will prevent the absorption of more.
 | |
| Fig. 8: | Predicted versus observed values of friction factor for SS dissolved in kerosene |
In the present investigation, the dimensional analysis could be used for grouping the significant quantities into a dimensionless group to reduce the number of variables appearing and to make the results so compact and applicable to all similar situations.
The choice of the appropriate variables that influent the friction factor (f) in the case of drag reduction is a great task. Since it is influenced by solvent physical and flow properties. Starting with the following relation:
ΔP = f (D, μ, ρ, V, C, L) |
Therefore by applying the dimensional analysis using Buckingham π theorem, the following non-dimensional relation was proposed:
f = f (Re, C) | (5) |
f = a Reb Ck | (6) |
The essential problem now is to find the values of the constants a, b and k, that give the best fitting of the experimental data.
The resulting equation is as follows:
f = 82.3 (Re)0.9. (C)0.12 | (7) |
Figure 8 shows the relation between the observed values of friction factor taken form experimental data and the predicted values from mathematical correlation. It can be noticed that most points lie at or close to the straight line, which means a good agreement between theoretical and experimental data.
CONCLUSIONS
It was proven in the present investigation that the condition of additive solubility is not always stands for all types of drag reducing agents. The experimental results showed that the sodium stearate is working well as drag reducing agent in non-aqueous media (kerosene) and the mechanism of drag reduction for suspended solids in turbulent flow can be adopted to explain this phenomenon.
It was proven that the percentage Drag Reduction (Dr%), increases by increasing the flow rate inside the pipe (the degree of turbulence) and the addition concentration and reduced by increasing the pipe diameter and all that due to the changes in the turbulence media the drag reducer works with.
Comparing the experimental results with those obtained before ( by comparing the friction factor) shoed good agreement.
REFERENCES
- Toorman, EA., 2002. Modelling of turbulent flow with suspended cohesive sediment. Proc. Mar. Sci., 5: 155-169.
CrossRef - Hideo, I., H. Naoto and H. Akihiko, 2000. Flow drag and heat transfer reduction of flowing water containing fibrous material in a straight pipe. Int. J. Thermal Sci., 39: 18-29.
CrossRefDirect Link - Inaba, H., K. Ozaki, N. Haruki and H. Asano, 1995. Flow resistance and heat transfer characteristics of water solution flow with surfactant in circular tubes. Trans. Jap. Soc. Mech. Eng., 61: 3304-3310.
Direct Link - Lim, S.T., S.J. Park, C.K. Chan and H.J. Choi, 2005. Turbulent drag reduction characteristics induced by calf-thymus DNA Physica A. Stat. Mech. Applications, 350: 84-88.
CrossRef - Mowla, D. and A. Naderi, 2006. Experimental study of drag reduction by a polymeric additive in slug two-phase flow of crude oil and air in horizontal pipes. Chem. Eng. Sci., 61: 1549-1554.
CrossRef - Pereira, A.S. and F.T. Pinho, 2002. Turbulent pipe flow of thixotropic fluids. Int. J. Heat Fluid Flow, 23: 36-51.
Direct Link - Sher, I. and G. Hetsroni, 2008. A mechanistic model of turbulent drag reduction by additives. Chem. Eng. Sci., 63: 1771-1778.
Direct Link - Siriluck, S. and A. Sirivat, 2007. Influence of ionic strength on complex formation between poly (Ethylene oxide) and cationic surfactant and turbulent wall shear stress in aqueous solution. Chem. Eng. J., 28: 11-20.
CrossRefDirect Link - Usui, H., T. Saeki, T. Takagi and K. Tokuhara, 1995. Evaluation of pumping power consumption in direct heating and cooling system with drag reducing cationic surfactants and discussions on the practical application of surfactant drag reduction. Kagaku Kogaku Ronbunshu, 21: 248-256.
Direct Link - Virk, P.S., H.S. Mickley and K.A. Smith, 1970. The ultimate asymptote and mean flow structure in toms phenomenon. J. Applied Mech., 37: 448-493.
CrossRef - Wang, Z.Y., P. Larsen, F. Nestmann and A. Dittrich, 1998. Resistance and drag reduction of clay suspensions. J. Hydraul. Eng., 124: 41-49.
CrossRef - Zhu, L. and C.S. Peskin, 2007. Drag of a flexible fiber in a 2D moving viscous fluid. Comput. Fluids, 36: 398-406.
CrossRef - Cho, S.H., C.S. Tae and M. Zaheeruddin, 2007. Effect of fluid velocity, temperature and concentration of non-ionic surfactants on drag reduction. Energy Conversion Manage., 48: 913-918.
CrossRef