
Mohammad Reza Amirjani
Department of Biology, Faculty of Sciences, Arak University, Arak 38156-879, Iran
International Journal of Botany
Year: 2011 | Volume: 7 | Issue: 1 | Page No.: 73-81


ABSTRACT
Salinity is a major yield-reducing factor in coastal and arid, irrigated rice production systems. Rice seedlings cv. Tarom Azmoon was exposed to 200 mM NaCl for 14 days. Plant growth, relative water content, pigment and sugars content, photosynthetic efficiency and enzyme activity of rice seedlings grown under salt stress were investigated Shoot length of treated seedlings decreased to about 71% compare to the control. Salinity stress caused an increase in root length of seedlings. Root length of treated seedlings was about 54% more than the control. Fresh weights and dry weights of treated seedlings reduced to 95 and 75%, respectively. Salinity stress caused reduction in leaf relative water contents from 87% in the control plants to 74% in the stressed plants. The reduction of chlorophyll a and b contents of leaves was detected after NaCl treatment in leaves. Under salt stress, reduction of the chlorophyll b content of leaves (41%) was more affected than the chlorophyll a content (33%). The maximum quantum yield of PSII (FV/FM), photon yield of PSII (φPSII), non-photochemical quenching (NPQ) and net photosynthetic rate (Pn) in the stressed seedlings were inhibited, leading to overall growth reduction. The positive correlations between chlorophyll a content and Fv/Fm, total chlorophyll content and φPSII, Pn as well as Pn and leaf area were found. Sugar content in shoots had a significant increase under salinity stress. The starch content of roots seedlings decreased NaCI stressed seedling. The contents of total, reducing and non reducing sugars increased in roots.
PDF Abstract XML References Citation
Received: October 23, 2010;
Accepted: November 27, 2010;
Published: March 12, 2011
How to cite this article
Mohammad Reza Amirjani, 2011. Effect of Salinity Stress on Growth, Sugar Content, Pigments and Enzyme Activity of Rice. International Journal of Botany, 7: 73-81.
DOI: 10.3923/ijb.2011.73.81
URL: https://scialert.net/abstract/?doi=ijb.2011.73.81
DOI: 10.3923/ijb.2011.73.81
URL: https://scialert.net/abstract/?doi=ijb.2011.73.81
INTRODUCTION
Rice (Oryza sativa L.) is one of the top five major carbohydrate crops for the world’s population, especially in Asia. It is a major staple food, which supports more than three billion people, and represents 50 to 80% of their daily calorie intake (Khush, 2005). Rice has previously been reported to be salt-sensitive at the seedling and reproductive stages (Zeng et al., 2001; Moradi and Ismail, 2007), leading to a reduction in crop productivity (Zeng and Shannon, 2000). With the rapid growth in population consuming rice and the deteriorating soil and water quality around the globe, there is an urgent need to understand the response of this important crop towards these environmental abuses. With the ultimate goal to raise rice plant with better suitability towards changing environmental inputs, intensive efforts are on worldwide employing physiological, biochemical and molecular tools to perform this task. Abiotic stress is the main factor negatively affecting crop growth and productivity worldwide. Rice plants are relatively susceptible to soil salinity as an abiotic stress (Flowers and Yeo, 1989; Gao et al., 2007).
In saline soil, there are many environmental factors which interact with salt contamination, such as soil pH (acidic or alkaline), water deficit and nutrient deficiency (James et al., 2005; Kopittke and Menzies, 2005; Moradi and Ismail, 2007). Alkalinity and acidity in saline soil are two major factors that inhibit the growth and development of higher plants in both halophyte and glycophyte species (Shi and Sheng, 2005; Shi and Wang, 2005; Yang et al., 2008). Salinity alters a wide array of metabolic processes in growing plants and induces changes in contents and activities of many enzymes (Dubey, 1994, 1997; Richharia et al., 1997; Khan and Panda, 2008). As a consequence of ion imbalance and hyperosmotic stresses, which are primary effects of salt stress, secondary stresses such as oxidative damage may occur.
Salinity effects on photosynthesis vary substantially among plant species. For example, salt stress drastically reduced CO2 exchange rates (CER) in cotton (Plaut and Federman, 1991) and barley leaves (Rawson, 1986), but had little effect on the leaf CER in wheat (Rawson, 1986), and Diplachne fusca (Gorham, 1987; Myers et al., 1990). Photosynthesis depends on leaf chlorophyll content and stomatal conductance, and is thus linearly correlated with the nitrogen content of the leaves (Dingkuhn et al., 1992). In the case of rice, saline soils are major factors in the induction of biochemical and physiological changes in plants, causing growth inhibition and yield loss (Colom and Vazzana, 2003; Chang and Sung, 2004; Fukuda et al., 2007; Kang et al., 2007; Rao et al., 2008; Yang et al., 2008).
Starch accumulates in leaves as a temporary reserve form of carbon and is the principal component of dry mass accumulated in mature leaves, whereas sucrose is transported to different organs where it is used by plants. The last step in the photosynthetic production of sucrose is catalyzed by the Sucrose Phosphate Synthase (SPS) (Krause et al., 1998) which converts hexose phosphates to sucrose. Prolonged water stress which limited photosynthesis led also to loss of SPS activity, e.g., in leaves of Phaseolus vulgaris (Vassey and Sharkey, 1989), whereas in rapidly stressed spinach leaves a stimulation in SPS activity was observed (Quick et al., 1989). A change in kinetic properties and the appearance of a new forms of SPS has been noticed in potato tubers after low temperature treatment (Krause et al., 1998). Sucrose breakdown inside the tissues is accomplished by acid invertase or sucrose synthase, yung leaves of growing plants are sinks for sucrose and possess high activities of both the enzymes, Starch phosphorylase degrades starch beginning at a non reducing end by incorporating phosphate.
Salinity appears to affect two plant processes water relations and ionic relations. During initial exposure to salinity, plants experience water stress, which in turn reduces leaf expansion. During long-term exposure to salinity, plants experience ionic stress, which can lead to premature senescence of adult leaves. The problem is compounded by mineral deficiencies (Zn, P) and toxicities (Fe, Al, organic acids), submergence, deep water and drought (Gregorio et al., 2002). Thus the photosynthetic area available to support continued growth is reduced (Cramer and Nowak, 1992). Reduced photosynthesis with increasing salinity is attributed to either stomatal closure, leading to a reduction in intracellular CO2 partial pressure, or non-stomatal factors (Bethke and Drew, 1992). There are evidences showing that salinity changes photosynthetic parameters, including osmotic and leaf water potential, transpiration rate, leaf temperature, and relative leaf water content (RWC). Salt also affects photosynthetic components such as enzymes, chlorophylls, and carotenoids. Changes in these parameters depend on the severity and duration of stress (Misra et al., 1997) and on plant species (Dubey, 1994).
Plants normally cope with salinity stress in various ways. Among these responses, accumulation of compatible solutes including proline, soluble sugars, sugar alcohols and glycine betaine has received most attention in terms of their functions in osmotic adjustment (Hare et al., 1998; Hasegawa et al., 2000). Osmotic adjustment refers to the net accumulation of solutes in cells in response to a fall in the water potential of their environment. As a consequence, the cell osmotic potential lowers, and turgor pressure tends to be maintained (Blum et al., 1996). Increased sugar concentration under salinity stress has been reported in many studies (Tattini et al., 1996; Dubey and Singh, 1999; Muscolo et al., 2003). Their role in terms of osmotic adjustment is however, still under debate. In many species, the absolute osmolyte concentrations are unlikely to mediate osmotic adjustment (Martínez-Ballesta et al., 2004). Additional benefits of these solutes have been described including buffering cellular redox potential and protecting cellular structure under stress condition. In addition, associated effects on photoassimilate allocation between source and sink tissues may also contribute to the accumulation of these solutes (Hare et al., 1998) . Although numerous studies have been done in the past few years to develop the rice (Oryza sativa L.) cultivars which can tolerate salinity condition, at least to some extent, the mechanisms of salinity tolerance in rice are not yet well understood.
MATERIALS AND METHODS
Rice materials and treatments: Rice seeds (Oryza sativa cv. Tarom Azmoon.) were surface sterilized with 1% sodium hypochlorite and washed thrice thoroughly in distilled water and then imbibed in water for 48 h at room temperature. The soaked seeds were then put in plastic pots filled with vermiculite saturated with Hoagland nutrient solution (Hoagland and Arnon, 1950). After germination seedlings were grown in the pots filled with vermiculite saturated either with Hoagland nutrient solution (control) or nutrient solution supplemented with 200 mM NaCl for 14 days. The solutions renewed after every 2 days. Seedlings were grown in a growth chamber under controlled environmental conditions with relative humidity of 70-85%, temperature 24±2°C and a photoperiod of 16 h in a photosynthetic photon flux density of 250-350 μmol m-2 sec-1. Data, relating to the biochemical, physiological and growth characters of the rice seedlings were collected. The experiment was arranged in a completely randomized design with three replications and five seedlings per replication.
Plant growth and relative water content measurements: After exposing to salinity stress, the seedlings were randomly sampled from each treatment. Root and shoot lengths of five plants from each treatment were determined. In addition, fresh weights of plants from each treatment were recorded and then the plants were oven dried at 80°C for 3 days in order to determine dry weight. Some plants from each treatment were randomly selected to determine leaf relative water content (Tarner, 1981). About 0.1 g leaf sample was cut into smaller pieces and weighed to determine fresh weight. The leaf sample was floated in freshly deionized water for 12 h and weighed thereafter to determine fully turgid weight. The leaf sample was oven-dried at 80°C for 3 days and the dry weight was obtained. The Relative Water Content (RWC) was determined using the following formula:
Pigment estimation: Fresh samples of leaves were analyzed for pigment contents. Photosynthetic pigments were extracted with 80% acetone as described by Brouers and Michel-Wolwertz (1983). The salt treated and untreated leaves (1.0-1.5 g) were ground to a fine powder in liquid nitrogen using a mortar and pestle. The pigments were extracted with 3 mL of cold 80% acetone. The acetone extracts were centrifuged at 3000 g for 10 min and the resulting pellet was extracted with cold 80% acetone. This operation was repeated 3 times. The successive supernatants were pooled and clarified by centrifugation at 4000 g for 5 min. The absorbance spectra of the extracts were measured and the total amount of pigments was determined with equations recommended by Brouers and Michel-Wolwertz (1983).
Measurement of chlorophyll fluorescence and the electron transport rate: The Maximal photochemical efficiency of PS2 (Fv/Fm) was determined by chlorophyll fluorescence, measured with a chlorophyll Fluorometer (PAM-2000; Heinz-Walz, Effeltrich, Germany) according to the manufacturer’s instructions. The experimental protocol of Genty et al. (1989) was basically used in this experiment. Following 30 min of dark adaptation, the minimum chlorophyll fluorescence (F0) was determined using a measuring beam, which was sufficiently low (<0.1 μmol m2 sec-1) not to induce any significant variable change in fluorescence. To obtain the maximum fluorescence in the dark-adapted state (FM), a saturation pulse (8000 μmol/m2/sec) was used and the quantum efficiency of PSII open centers in dark-adapted seedlings (FV/FM) was determined. The leaves were then illuminated with 300 μmol/m2/sec light. The steady-state value of fluorescence (FS) was recorded. To determine maximum fluorescence in the light-saturated state (F′M) a second saturating pulse at 8000 μmol m2/sec was used. After turning off the light the minimum fluorescence in the light saturated state (F′0) was determined by illuminating the leaves with far-red light (7 μmol/m2/sec). The quantum efficiency of PSII open centers light-adapted state, φPSII (F′M-FS/F′M), and the quantum efficiency of excitation energy trapping of PSII, (F′V/F′M), were calculated according to Genty et al. (1989). The non-photochemical quenching, (qNP) = (FM-F′M )/ FM-F′0), parameters were calculated as done by Schreiber et al. (1994).
Measurement of net photosynthetic rate: Net photosynthetic rate (Pn) was calculated by comparing the different concentrations of CO2 inside and outside of glass vessel containing rice seedlings. The CO2 concentrations inside and outside the glass vessel (Cin and Cout) at steady state were measured with a gas chromatography (Model GC-17A, Shimadzu Co Ltd., Japan).
Starch and sugar estimation: Roots and shoots were oven dried at 70°C for 24 h, homogenised in 80 % ethanol and placed in water bath at 80°C for 30 min. After centrifugation at 3000 g for 5 min, samples were washed twice with H2O at room temperature. Each sample was resuspended with 3 mL H2O and boiled for 2 h. Contents of total sugars were estimated calorimetrically using phenol sulphuric acid method described by DuBois et al. (1956) and reducing sugars by Nelson-Somogyi method as described by Oser (1979). Total sugars and starch were estimated calorimetrically using phenol sulphuric acid method of DuBois et al. (1956) and reducing sugars by Nelson-Somogyi method as described by Oser (1979).
Enzyme extraction and assay: About 1 g leaf tissue was collected for enzyme extraction and determination of sucrose phosphate synthase and invertase activities. The leaf sample was ground on ice using mortar and pestle in 5 mL grinding buffer containing 50 mM HEPES, 10 mM MgCl2, 1 mM EDTA, 0.25% BSA and 5 mM dithiothreitol, pH 7.5. The extract was filtered and centrifuged for 1 min at 10000 g. Crude extract was desalted on 2 ml Sephadex G25 columns equilibrated with the grinding buffer. The amount of protein in the enzyme extract was determined by Bradford method (Bradford, 1976).
Sucrose phosphate synthase (SPS) activity was determined by measuring sucrose-6-phosphate produced from the substrates, UDP-glucose and fructose-6-phosphate (Robbins and Pharr, 1987). Approximately 80 μL desalted enzyme was incubated in a reaction mixture containing 25 mM UDP-glucose, 8 mM fructose-6-phosphate, 5 mM MgCl2 at 25 EC for 1 h and terminated by adding 100 μL of 1 N NaOH. Unreacted fructose-6-phosphate and fructose were destroyed by boiling the tube in a boiling water bath for 10 min. Sucrose-6-phosphate formed during the reaction was determined by reacting with 0.25 mL resorcinol solution and quantified by a spectrophotometer at 520 mM.
Invertase activities were determined under acidic (pH 4.0) and alkaline (pH 7.6) conditions. Approximately 50 μL of desalted enzyme was incubated with 125 mM sucrose (w/v) in the extraction buffer. Assays were run at 30 EC for 30 min and stopped by boiling for 1 min. The glucose content of 10 Fl aliquots of the assay mixture was determined spectrophotometrically at 360 nm using hexokinase/glucose-6-P dehydrogenase enzymes (Madore, 1990).
Statistical analysis: Statistical analysis was performed using SPSS 18. The data represent means calculated from three replicates. The analysis of variance procedure (ANOVA) was used to compare the effect of NaCl and statistical significance was set at p<0.05.
RESULTS
Plant growth and relative water content: The growth characteristics, in terms of shoot height, root length leaf area, fresh weight and dry weight and were exhibited to a significant change when the seedlings were exposed to the salt stress. Salinity caused reduction in shoot heights. Shoot length of treated seedlings decreased to about 71% compare to the control (Fig. 1). Salinity stress caused an increase in root length of seedlings. Root length of treated seedlings was about 54% more than the control (Fig. 1).
Salinity stress also caused reduction in both fresh and dry weights of seedlings (Fig. 2). Fresh weights and dry weights of treated seedlings reduced to 95% and 75%, respectively, compare to the control.
Salinity caused reduction in leaf relative water contents in rice seedlings. Relative water content of treated seedlings was reduced from 87% in the control plants to 74% in the stressed plants (Fig. 2).
Pigment estimation: Salt treatment affected the chlorophyll amount of leaves (Fig. 3). The reduction of chlorophyll a and b contents of leaves was detected after NaCl treatment in leaves. Under salt stress, reduction of the chlorophyll b content of leaves (41%) was more affected than the chlorophyll a content (33%) (Fig. 3). Total chlorophyll content of the leaves decreased significantly with NaCl treatment. Total chlorophyll content decreased approximately by 35%. Carotenoid content was decreased by 39% with high amount of NaCl (Fig. 3).
Photosynthetic pigment contents, physiological and growth characteristics: Photosynthetic pigment contents, including chlorophyll a, chlorophyll b, total chlorophyll and total carotenoids contents in the rice seedlings were significantly degraded when plants were exposed to salt stress (Fig. 3).
The chlorophyll a degradation in the salt stressed seedlings was positively related to the maximum quantum yield of PSII (FV/FM, Table 1). In addition, the total chlorophyll contents in the salt stressed seedlings were certainly correlated with the photon yield of PSII (φPSII) Table 1, leading to a reduction of net photosynthetic rate (Pn). The FV/FM and φPSII parameters in the stressed seedlings decreased significantly when the seedlings were exposed to the salt stress, while the non-photochemical quenching (NPQ) increased (Table 1). The reduction of pigment contents and chlorophyll a fluorescence parameters in the stressed seedlings directly restricted Pn.
Sugars and starch contents: When rice seedlings were raised under salinity stress significant change in starch content could be observed in shoots and roots (Table 2). Sugar content in shoots had a significant increase under salinity stress. The starch content of roots seedlings decreased NaCI stressed seedling. The contents of total, reducing and non reducing sugars increased in roots (Fig. 4).
Enzyme activities: The increased activity of sucrose phosphate synthase (SPS) was observed in roots and shoots of the salt treated seedlings (Table 2).
| Table 1: | Maximum quantum yield of PSII (FV/FM), photon yield of PSII (FPSII), Non-Photochemical Quenching (NPQ) and net-photosynthetic rate (Pn) in rice seedlings grown under 0 and 200 mM NaCl. The results are presented as means±SD |
 | |
| Table 2: | Effect of salt stress on starch contents (mg g-1 DW) and sucrose phosphate synthase [μ mol (sucrose) mg-1 (protein) sec-1], invertase [μ mol (sucrose) mg-1 (protein) sec-1] and starch phosphorylase [μ mol Pi) mg-1 (protein) sec-1] activities in rice. The results are presented as means±SD |
 | |
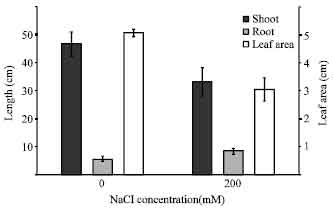 | |
| Fig. 1: | Effect of salinity stress on shoot height, root length and leaf area of rice. The results are presented as means±SD |
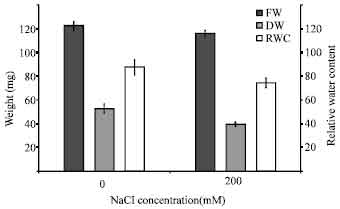 | |
| Fig. 2: | Effect of salinity stress on fresh weight, dry weight and relative water contents of rice seedlings. The results are presented as means±SD |
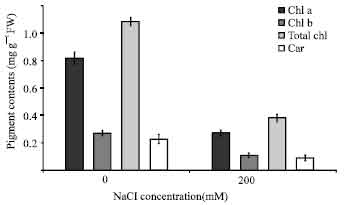 | |
| Fig. 3: | Effect of salinity stress on amount of chlorophyll and carotenoid of rice seedlings. The results are presented as means±SD |
The acid invertase and starch phosphorylase activities in shoots of treated seedlings increased about 23 and 61%, respectively, compared to the control (Table 2).
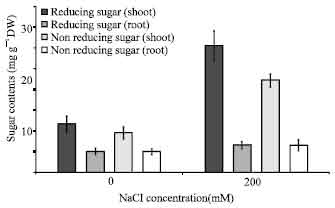 | |
| Fig. 4: | Effect of salinity stress on sugar contents of rice seedlings. The results are presented as means± SD |
DISCUSSION
Growth reduction is generally observed in plants exposed to salinity stress. This may be partly due to lower water potential in the cells which, in turn, causes stomatal closure and limits CO2 assimilation. In the present study, rice seedlings showed growth reduction when exposed salinity. A marked growth reduction was reported earlier in rice seedlings exposed to salinity stress (Lee et al., 2003; Pattanagul and Thitisaksakul, 2008). In addition, salinity caused pronounced effect on fresh and dry weights in treated rice seedlings. Root length, however, showed a marked difference in response to salinity stress. Rice seedlings showed an increase in root length in response to salinity stress. This probably reflects the maintenance or even induction of the root elongation at low water potential, which can be considered as an adaptive response to drought and salinity (Perez-Alfocea et al., 1996). Increased root length may possibly be resulted from reallocation of photosynthates into the root, instead of the shoot, thus causing a reduction in shoot growth. While an increase in root growth in order to increase water influx is usually documented as a general response to salinity, experimental evidence indicates that reduced root and increased shoot growth may improve salinity tolerance by restricting the flux of toxic ions to the shoot and consequently by delaying the onset of the tolerance threshold (Maggio et al., 2007).
The results showed a decrease in the RWC in salt treated seedlings (Fig. 1). It is known that salt stress affects both leaf growth and water status (Hernandez et al., 2000; Khan and Panda, 2008). The osmotic effect resulting from salinity may cause disturbances in the water balance of the plant and inhibiting growth as well as provoking stomatal closure and reducing photosynthesis (Hernandez and Almansa, 2002). Plants respond by means of osmotic adjustment, normally by increasing the concentrations of Na+ and Cl¯ in their tissues, although such accumulation of inorganic ions may produce important toxic effects and cell damage and inactivate both photosynthetic and respiratory electron transport. This limited osmotic adjustment was not sufficient to avoid water stress in the treated plants, and thus there was a decrease in the roots water content after salt stress. Wilson et al. (1989) indicated that osmotic adjustment accounted for decreases in the fresh weight/dry weight ratio, increases in apoplastic water content and direct solute accumulation (Wilson et al., 1989)
Leaf chlorosis is one of the most commonly observed consequences of salt stress. The leaves were significantly affected by NaCl treatment. The contents of photosynthetic pigments, including chlorophyll a, b and total carotenoids contents in rice plants grown under salt stress declined significantly (Fig. 3) being especially susceptible to salt. Similar results have been reported previously (Cha-Um et al., 2009). Carotenoids act as light-harvesting pigments as well, and can protect chlorophyll and membrane destruction by quenching triplet chlorophyll and removing oxygen from the excited chlorophyll b oxygen complex (Young, 1991). In this study, carotenoid content of cultivars decreased under salinity stress (Fig. 3).
The contents of photosynthetic pigments, including chlorophyll a, b and carotenoids contents in rice plants grown under salt stress declined significantly, being especially susceptible to salt. Many documents showes the performances of the chlorophyll pigment contents in the leaves of tolerant rice varieties were maintained better than in the sensitive varieties (Khan and Abdullah, 2003; Cha-Um et al., 2009). Water content in leaf tissues and water oxidation in the photosystem II of plants under salt stress decreased significantly in wheat (Yang et al., 2008) and rice (Weretilnyk et al., 1989). In the present study, there was a positive relationship between chlorophyll a content and FV/FM, φPSII and Pn, Pn and leaf area in the stressed seedlings. These findings are similar to a previous study of rice (Weretilnyk et al., 1989). Also, the growth performances were significantly reduced, depending on salt stresses.
Increased accumulation of sugars has been reported in many plant species exposed to salinity (Dubey and Singh, 1999; Flowers, 2004; Pattanagul and Thitisaksakul, 2008). According to Stoop and Pharr (1994) the increase in glucose pool induced by salinity in celery petioles appeared to be due to decreased demand of carbon. It is believed that under salinity stress accumulation of sugars along with other compatible solutes contribute to an osmotic adjustment (Dubey and Singh, 1999) allows the plants to maximize sufficient storage reserves to support basal metabolism under stressed environment (Hurry et al., 1995). The expression of Rubisco could be repressed by excess amount of sugars in cytoplasm (Sawada et al., 1992; Koch, 1996). Therefore, reduction of photosynthesis and metabolic alterations by sugar accumulation could contribute to salt sensitivity, which limits growth of the salt-sensitive cultivar under salt stress conditions.
Starch accumulation perhaps resulted from the increased activity of alkaline invertase activity which hydrolyzes sucrose and converts into simpler sugars. Starch may be synthesized from such sugars. High starch accumulation in mature leaves of the salt-tolerant cultivar of tomato was reported earlier (Balibrea et al., 2000). Although starch may not play a crucial role in salt-tolerance mechanism, it was suggested that the ability of plants to partition sugars into starch may help to avoid metabolic alterations by lowering feedback inhibition caused by excess amount of sucrose in cytoplasm (Krapp and Stitt, 1995).
The activities of sucrose phosphate synthase, acid invertase and starch phosphorylase increased the rice treated seedlings due to exposure to NaCl (Table 2). The increased SPS activity paralleled with increased accumulation of sugars. Similar results have been reported by previous workers (Krause et al., 1998; Dubey and Singh, 1999). Increased activity of starch phosphorylase under salinity might help starch degradation and mobilisation of sugars. Stimulation in the activity of starch degrading enzyme a-amylase was observed in wheat under salinity.
REFERENCES
- Balibrea, M.E., J. Dell'Amico, M.C. Bolarin and F. Perez-Alfocea, 2000. Carbon partitioning and sucrose metabolism in tomato plants growing under salinity. Physiologia Plantarum, 110: 503-511.
CrossRefDirect Link - Bethke, P.C. and M.C. Drew, 1992. Stomatal and non-stomatal components to inhibition of photosynthesis in leaves of Capsicum annuum during progressive exposure to NaCl salinity. Plant Physiol., 99: 219-226.
Direct Link - Blum, A., R. Munns, J.B. Passioura, N.C. Turner and R.E. Sharp et al., 1996. Genetically engineered plants resistant to dry soil and salt stress: How to interpret osmotic relations. Plant Physiol., 110: 1051-1053.
Direct Link - Brouers, M. and M.R. Michel-Wolwertz, 1983. Estimation of protochlorophyll(ide) contents in plant extracts, re-evaluation of the molar absorption coefficient of protochlorophyll(ide). Photosynth. Res., 4: 265-270.
Direct Link - Cha-Um, S., K. Supaibulwattana and C. Kirdmanee, 2009. Comparative effects of salt stress and extreme pH stress combined on glycinebetaine accumulation, photosynthetic abilities and growth characters of two rice genotypes. Rice Sci., 16: 274-282.
CrossRefDirect Link - Chang, C.S. and J.M. Sung, 2004. Nutrient uptake and yield responses of peanuts and rice to lime and fused magnesium phosphate in an acid soil. Field Crops Res., 89: 319-325.
Direct Link - Colom, M.R. and C. Vazzana, 2003. Photosynthesis and PSII functionality of drought-resistant and drought-sensitive weeping lovegrass plants. Environ. Exp. Bot., 49: 135-144.
CrossRefDirect Link - Cramer, G.R. and R.S. Nowak, 1992. Supplemental manganese improves the relative growth, net assimilation and photosynthetic rates of salt-stressed barley. Physiol. Plant., 84: 600-605.
Direct Link - Dingkuhn, M., S.K. De Datta, R. Pamplona, C. Javellana and H.F. Schnier, 1992. Effect of late-season N fertilization on photosynthesis and yield of transplanted and direct-seeded tropical flooded rice. II. A canopy stratification study. Field Crops Res., 28: 235-249.
Direct Link - Dubey, R.S. and A.K. Singh, 1999. Salinity induces accumulation of soluble sugars and alters the activity of sugar metabolising enzymes in rice plants. Biologia Plantarum, 42: 233-239.
CrossRefDirect Link - DuBois, M., K.A. Gilles, J.K. Hamilton, P.A. Rebers and F. Smith, 1956. Colorimetric method for determination of sugars and related substances. Anal. Chem., 28: 350-356.
CrossRefDirect Link - Fukuda, T., A. Saito, J. Wasaki, T. Shinano and M. Osaki, 2007. Metabolic alterations proposed by proteome in rice roots grown under low P and high Al concentration under low pH. Plant Sci., 172: 1157-1165.
Direct Link - Gao, J.P., D.Y. Chao and H.X. Lin, 2007. Understanding abiotic stress tolerance mechanisms: recent studies on stress response in rice. J. Integrative Plant Biol., 49: 742-750.
Direct Link - Genty, B., J.M. Briantais and N.R. Baker, 1989. The relationship between the quantum yield of photosynthetic electron transport and quenching of chlorophyll fluorescence. Biochim. Biophys. Acta, 990: 87-92.
CrossRef - Gorham, J., 1987. Photosynthesis, transpiration and salt fluxes through leaves of Leptochloa fusca L. Kunth. Plant Cell Environ., 10: 191-196.
CrossRefDirect Link - Gregorio, G.B., D. Senadhira, R.D. Mendoza, N.L. Manigbas, J.P. Roxas and C.Q. Guerta, 2002. Progress in breeding for salinity tolerance and associated abiotic stresses in rice. Field Crop Res., 76: 91-101.
CrossRefDirect Link - Hare, P.D., W.A. Cress and J. van Staden, 1998. Dissecting the roles of osmolyte accumulation during stress. Plant Cell Environ., 21: 535-553.
CrossRefDirect Link - Hasegawa, P.M., R.A. Bressan, J.K. Zhu and H.J. Bohnert, 2000. Plant cellular and molecular responses to high salinity. Annu. Rev. Plant Physiol. Plant Mol. Biol., 51: 463-499.
CrossRefDirect Link - Hernandez, J.A. and M.S. Almansa, 2002. Short-term effects of salt stress on antioxidant systems and leaf water relations of pea leaves. Physiol. Plant., 115: 251-257.
CrossRefDirect Link - Hernandez, J.A., A. Jimenez, P. Mullineaux and F. Sevilia, 2000. Tolerance of pea (Pisum sativum L.) to long-term salt stress is associated with induction of antioxidant defences. Plant Cell Environ., 23: 853-862.
CrossRefDirect Link - Hurry, V.M., A. Strand, M. Tobiaeson, P. Gardarstorm and G. Oquist, 1995. Cold hardening of spring and winter wheat and rape results in differential effect of growth carbon metabolism and carbohydrate content. Plant Physiol., 109: 697-706.
Direct Link - James, J.J., R.L. Tiller and J.H. Richards, 2005. Multiple resources limit plant growth and function in a saline-alkaline desert community. J. Ecol., 93: 113-126.
CrossRefDirect Link - Kang, D.J., K. Futakuchi, S. Dumnoenngam and R. Ishii, 2007. High-yielding performance of a new rice variety, ir53650 in mildly improved acid sulfate soil conditions. Plant Prod. Sci., 10: 64-67.
Direct Link - Khan, M.A. and Z. Abdullah, 2003. Salinity-sodicity induced changes in reproductive physiology of rice (Oryza sativa) under dense soil conditions. Environ. Exp. Bot., 49: 145-157.
CrossRefDirect Link - Khan, M.H. and S.K. Panda, 2008. Alterations in root lipid peroxidation and antioxidative responses in two rice cultivars under NaCl-salinity stress. Acta Physiol. Planta., 30: 81-89.
CrossRefDirect Link - Khush, G.S., 2005. What it will take to feed 5.0 billion rice consumers in 2030. Plant Mol. Biol., 59: 1-6.
CrossRef - Koch, K.E., 1996. Carbohydrate-modulated gene expression in plants. Ann. Rev. Plant Physiol. Plant Mol. Biol., 47: 509-540.
PubMedDirect Link - Kopittke, P. and N. Menzies, 2005. Effect of pH on Na induced Ca deficiency. Plant Soil, 269: 119-129.
CrossRefDirect Link - Krapp, A. and M. Stitt, 1995. An evaluation of direct and indirect mechanisms for the `sink-regulation` of photosynthesis in spinach: Changes in gas exchange, carbohydrates, metabolites, enzyme activities and steady-state transcript levels after cold-girdling source leaves. Planta, 195: 313-323.
CrossRefDirect Link - Krause, K.P., L. Hill, R. Reimholz, T. Hamborg Nielsen, U. Sonnewald and M. Stitt, 1998. Sucrose metabolism in cold-stored potato tubers with decreased expression of sucrose phosphate synthase. Plant Cell Environ., 21: 285-299.
CrossRefDirect Link - Lee, K.S., W.Y. Choi, J.C. Ko, T.S. Kim and G.B. Gregorio, 2003. Salinity tolerance of japonica and indica rice (Oryza sativa L.) at the seedling stage. Planta, 216: 1043-1046.
Direct Link - Madore, M.A., 1990. Carbohydrate metabolism in photosynthetic and nonphotosynthetic tissues of variegated leaves of coleus blumei benth. Plant Physiol., 93: 617-622.
CrossRefDirect Link - Maggio, A., G. Raimondi, A. Martino and S. de Pascale, 2007. Salt stress response in tomato beyond the salinity tolerance threshold. Environ. Exp. Bot., 59: 276-282.
CrossRefDirect Link - Martinez-Ballesta, M.C., V. Martinez and M. Carvajal, 2004. Osmotic adjustment, water relations and gas exchanges in pepper plants grown under NaCl or KCl. Environ. Exp. Bot., 52: 161-174.
CrossRef - Misra, A.N., S.M. Sahu, M. Misra, P. Singh and I. Meera et al., 1997. Sodium chloride induced changes in leaf growth and pigment and protein contents in two rice cultivars. Biol. Plant., 39: 257-262.
CrossRefDirect Link - Moradi, F. and A.M. Ismail, 2007. Responses of photosynthesis, chlorophyll fluorescence and ROS-scavenging systems to salt stress during seedling and reproductive stages in rice. Ann. Bot., 99: 1161-1173.
CrossRefDirect Link - Muscolo, A., M.R. Panuccio and M. Sidari, 2003. Effects of salinity on growth, carbohydrate metabolism and nutritive properties of kikuyu grass (Pennisetum clandestinum Hochst). Plant Sci., 164: 1103-1110.
Direct Link - Myers, B., T. Neales and M. Jones, 1990. The influence of salinity on growth, water relations and photosynthesis in Diplachne fusca (L.) P. Beauv. Ex Roemer & schultes. Functional Plant Biol., 17: 675-691.
CrossRefDirect Link - Pattanagul, W. and M. Thitisaksakul, 2008. Effect of salinity stress on growth and carbohydrate metabolism in three rice (Oryza sativa L.) cultivars differing in salinity tolerance. Indian J. Exp. Biol., 46: 736-742.
PubMedDirect Link - Perez-Alfocea, F., M.E. Balibrea, A. Santa Cruz and M.T. Estan, 1996. Agronomical and physiological characterization of salinity tolerant in a commercial tomato hybrid. Plant Soil, 180: 251-257.
CrossRef - Plaut, Z. and E. Federman, 1991. Acclimation of CO2 assimilation in cotton leaves to water stress and salinity. Plant Physiol., 97: 515-522.
Direct Link - Quick, W.P., G. Siegl, H.E. Neuhaus, R. Feil and M. Stitt, 1989. Short-term water stress leads to a stimulation of sucrose synthesis by activating sucrose phosphate synthase. Planta, 177: 535-546.
CrossRefDirect Link - Rao, P.S., B. Mishra, S.R. Gupta and A. Rathore, 2008. Reproductive stage tolerance to salinity and alkalinity stresses in rice genotypes. Plant Breed., 127: 256-261.
CrossRefDirect Link - Rawson, H.M., 1986. Gas exchange and growth in wheat and barley grown in salt. Aust. J. Plant Physiol., 13: 475-489.
Direct Link - Richharia, A., K. Shah and R.S. Dubey, 1997. Nitrate reductase from rice seedlings: Partial purification, characterization and the effects of in situ and in vitro NaCl salinity. J. Plant Physiol., 151: 316-322.
Direct Link - Robbins, N.S. and D.M. Pharr, 1987. Regulation of photosynthetic carbon metabolism in cucumber by light intensity and photosynthetic period. Plant Physiol., 85: 592-597.
CrossRefDirect Link - Sawada, S., H. Usuda and T. Tsukui, 1992. Participation of inorganic orthophosphate in regulation of the ribulose-1,5-bisphosphate carboxylase activity in response to changes in the photosynthetic source-sink balance. Plant Cell Physiol., 33: 943-949.
Direct Link - Shi, D. and Y. Sheng, 2005. Effect of various salt-alkaline mixed stress conditions on sunflower seedlings and analysis of their stress factors. Environ. Exp. Bot., 54: 8-21.
Direct Link - Shi, D. and D. Wang, 2005. Effects of various salt-alkaline mixed stresses on Aneurolepidium chinense (Trin.) Kitag. Plant Soil, 271: 15-26.
CrossRefDirect Link - Stoop, J.M.H. and D.M. Pharr, 1994. Growth substrate and nutrient salt environment alter mannitol-to-hexose partitioning in celery petioles. J. Am. Soc. Hort. Sci., 119: 237-242.
Direct Link - Tattini, M., R. Gucci, A. Romani, A. Baldi and J.D. Everard, 1996. Changes in non-structural carbohydrates in olive (Olea europaeaa) leaves during root zone salinity stress. Physiol. Plant, 98: 117-124.
CrossRefDirect Link - Turner, N.C., 1981. Techniques and experimental approaches for the measurement of plant water status. Plant Soil, 58: 339-366.
CrossRefDirect Link - Vassey, T.L. and T.D. Sharkey, 1989. Mild water stress of phaseolus vulgaris plants leads to reduced starch synthesis and extractable sucrose phosphate synthase activity. Plant Physiol., 89: 1066-1070.
CrossRefDirect Link - Weretilnyk, E.A., S. Bednarek, K.F. McCue, D. Rhodes and A.D. Hanson, 1989. Comparative biochemical and immunological studies of the glycine betaine synthesis pathway in diverse families of dicotyledons. Planta, 178: 342-352.
CrossRefDirect Link - Wilson, J.R., M.M. Ludlow, M.J. Fisher and E.E. Schulze, 1989. Adaptations to water stress of the leaf water relations of four tropical forage species. Aust. J. Plant Physiol., 7: 207-220.
CrossRefDirect Link - Yang, C., D. Shi and D. Wang, 2008. Comparative effects of salt and alkali stresses on growth, osmotic adjustment and ionic balance of an alkali-resistant halophyte Suaeda glauca (Bge.). Plant Growth Regul., 56: 179-190.
CrossRefDirect Link - Yang, F., Z.W. Liang, Z.C. Wang and Y. Chen, 2008. Relationship between diurnal changes of net photosynthetic rate and influencing factors in rice under saline sodic stress. Rice Sci., 15: 119-124.
Direct Link - Young, A.J., 1991. The photoprotective role of carotenoids in higher plants. Physiol. Plant, 83: 702-708.
Direct Link - Zeng, L. and M.C. Shannon, 2000. Salinity effects on seedling growth and yield components of rice. Crop Sci., 40: 996-1003.
CrossRefDirect Link - Zeng, L., M.C. Shannon and S.M. Lesch, 2001. Timing of salinity stress affects rice growth and yield components. Agric. Water Manage., 48: 191-206.
CrossRefDirect Link - Bradford, M.M., 1976. A rapid and sensitive method for the quantitation of microgram quantities of protein utilizing the principle of protein-dye binding. Anal. Biochem., 72: 248-254.
CrossRefPubMedDirect Link
m. tabatabaee Reply
hello Mr Amirjani
im caring to study your full paper please give me your full paper.
i study on pigment of aeloropus littoralis under salt treatment but my result of chlorophyll b incrssed in 600mM NaCl and i dont disscusion on this result.
do you help me about this?