
C.M. Tankou
Faculty of Agronomy and Agricultural Sciences, University of Dschang, P.O. Box 222, Dschang, Cameroon
G.R. de Snoo
Institute of Environmental Sciences, Leiden University, P.O. Box 9518, 2300 RA Leiden, The Netherlands
H.H. de Iongh
Institute of Environmental Sciences, Leiden University, P.O. Box 9518, 2300 RA Leiden, The Netherlands
G. Persoon
Department of Anthropology, Leiden University, P.O. Box 9518, 2300 RA Leiden, The Netherlands
International Journal of Agricultural Research
Year: 2013 | Volume: 8 | Issue: 1 | Page No.: 1-16


ABSTRACT
Soil nutrient depletion is a major constraint in agricultural development in sub-Saharan Africa. A study was conducted in the Western Highlands of Cameroon to assess soil nutrient balance and identify household and farm characteristics influencing soil nutrient balance using the procedures outlined in the NUTMON Tool-box. This is based on the assessment of the stocks and flows of nitrogen (N), phosphorus (P) and potassium (K) through the inputs (mineral fertilizers, organic inputs, atmospheric deposition and sedimentation) and outputs (harvested crop products, residues, leaching, denitrification and erosion). The gross margin was estimated as gross return minus variable costs while the net farm income was estimated as total gross margin minus fixed costs. The nutrient budgeting results revealed that nitrogen mining was very common at all levels with the greatest mining carried out by intercropping systems which generally received little or no off-farm inputs. High positive nutrient balances were found on market oriented crops. A general picture of the study site showed that only nitrogen was deficient while there were surplus amounts of potassium and phosphorus. The gross margins of green pepper, leeks and onions were negative while the others were positive. Legume intercrops could significantly modify the nutrient balance and sustainability in this region.
PDF Abstract XML References Citation
Received: January 14, 2013;
Accepted: March 22, 2013;
Published: June 04, 2013
How to cite this article
C.M. Tankou, G.R. de Snoo, H.H. de Iongh and G. Persoon, 2013. Soil Quality Assessment of Cropping Systems in the Western Highlands of Cameroon. International Journal of Agricultural Research, 8: 1-16.
DOI: 10.3923/ijar.2013.1.16
URL: https://scialert.net/abstract/?doi=ijar.2013.1.16
DOI: 10.3923/ijar.2013.1.16
URL: https://scialert.net/abstract/?doi=ijar.2013.1.16
INTRODUCTION
The depletion of soil nutrients is a major constraint to sustainable agriculture (Tchabi et al., 2008; Stoorvogel et al., 1993, Smaling et al., 1996). Oenema et al. (2003) postulated that nutrient monitoring of agro-ecosystems can be used as a tool to increase the understanding of nutrient cycling, or as a performance indicator and awareness raiser in nutrient management and environmental policy. The rural community of Cameroon in general (Molua, 2002) and the Western Highlands of Cameroon (WHC) in particular depend nearly entirely on agricultural activities for food, feed and income. The rising demographic pressure has imposed intensive land use over space and time which in turn demands high amounts of off-farm inputs. Though some studies have been done in the forest region of Cameroon (Stoorvogel and Smaling, 1990; Kanmegne et al., 2006; Ehabe et al., 2010), no information so far exists for the WHC to provide guidelines on soil nutrient management for sustainable production.
Nutrient monitoring is a method that quantifies a system’s nutrient inflows and outflows resulting in nutrient balance which is a useful indication of soil quality. Soil fertility is determined through the quantification of nutrient stocks and flows within the production systems (Bationo et al., 1998; Deugd et al., 1998). Nutrient balance can be determined at spatial scales ranging from field level to national level. A nutrient balance determined at the level of individual activities within a farm serves as a useful indicator to provide insight into magnitude of losses of nutrients from the system and the causes for such losses, which ultimately enables target interventions. Understanding the nutrient balance at each crop activity level at farm level can provide useful guides on agricultural policy decisions for planning at these levels to sustain the production system. The importance of this study to elucidate the nutrient dynamics in the breadbasket of Cameroon (Bergeret and Djoukeng, 1993) where no such study has been done cannot be overemphasized.
A nutrient balance is the difference between nutrient inputs and outflows (or losses). Positive balance for a particular nutrient means that nutrient will accumulate in the soil while negative balance reflects the mining of the nutrient concerned. Soil depletion is provoked by nutrient loss while pollution is the result of accumulation of high levels of nutrients, particularly nitrogen (N) and phosphorus (P). Nutrients are generally taken up by the plant from the solution phase of the soil, which is replenished through ion exchange, by dissolution from the solid mineral phase, or by mineralization of organic compounds. While part of the nutrients is returned to the soil in the form of crop residues, the rest is removed from the field in the form of harvested products, soil erosion, water runoff, soil sediments, and leaching (mainly nitrogen and potassium) and volatilization (mainly nitrogen). The loss of nutrients is countered by biological N-fixation, atmospheric deposition in rainfall and application of mineral fertilizers, animal manures, or compost.
Numerous studies have shown that soil nutrient depletion in Africa is extremely high (Stoorvogel and Smaling, 1990; Van der Pol, 1992; Smaling, 1993; Smaling and Braun, 1996; Smaling et al., 1997; Scoones, 2001). This is due to the fact that nutrients taken away in crops or lost in processes such as leaching and erosion far exceed the nutrient inputs through fertilisers, deposition and biological fixation (Smaling and Braun, 1996). Stoorvogel and Smaling (1990) estimated that 21 kg N, 2 kg P and 13 kg K were lost per ha and per year in southern Cameroon. The application of nutrients to croplands is critically important for improving crop yields and productivity of farmland. It has been estimated that approximately 50% of the applied nutrients are integrated into plant mass while the rest accumulate in soil, or are emitted to the atmosphere (NO, NH3, N2O) or water bodies as soluble components (NO3, PO4) or as a component of soil. Agricultural activities are a significant contributor to the substantial increase of both nitrogen and phosphorus (Smil, 2000; Galloway, 1998) in the environment.
The concern for soil nutrient depletion and low soil fertility has led to the development of several integrated soil fertility management technologies that offer potential for improving soil fertility management in Africa (Scoones and Toulmin, 1999). The soil fertility management technologies are focused on improved soil erosion control, inoculation of grain legumes for improved nitrogen fixation, efficient use of manure and other locally available organic materials, use of green manure and cover crops (Delve and Jama, 2002) and use of low levels of N and P fertilisers on maize and beans intercropping systems (Wortmann et al., 1998; Wortmann and Kaizzi, 1998). A holistic approach to tackle the soil fertility problem through integration of biophysical, socio-economic, institutional and policy factors has been proposed (CGIAR, 2002). High input costs, inadequate knowledge on soil fertility management practices and cropping systems design exacerbated by pests and disease problems, global policies on input-out market and institutional failures are amongst the determinants hampering the efforts of smallholder farmers (Van Reuler and Prins, 1993; Hart and Voster, 2006).
To address the importance of the problems faced by smallholder farmers of the WHC, the present study was undertaken by employing the NUTMON-Toolbox to assess the nutrient balance at field (crop activity) level in the WHC. In addition, the study attempted to identify household socio-economic and biophysical factors influencing soil quality, agro-economic performance and the profitability of cropping practices.
MATERIALS AND METHODS
Site description: The study was carried out during the first and second cropping seasons (March to August and September to November) in 2010 and 2011 in three villages: Bafou, Baleveng and Fongo-Tongo located in the WHC found between the geographical coordinates of 05° 27′-05° 37.62′N and 09° 57.502′-10° 09.544′ E (Fig. 1). The soil is characterized by granite and gneisses in the southern lower altitudes and basaltic plateau at northern higher altitudes (Fotsing, 1992).
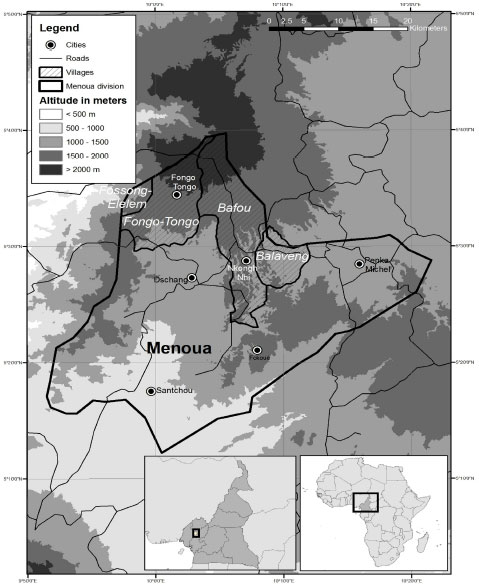 | |
| Fig. 1: | Geographical location of study site |
| Table 1: | Household and farm characteristics of the study area |
 | |
| *Adult equivalence scale = people age 18 or over assigned a weight of 1, children below 18 assigned a weight of 0.5 | |
The natural vegetation is dominated by grass with spotted shrubs and trees. Many households have planted Eucalyptus trees (most often for border demarcation) which are commonly used as timber and fuel wood. Cool season vegetable crop production is dominant at higher altitudes and agricultural activities are also very common in inland valley swamps and on steep slopes due to land scarcity. Cropping systems vary with altitude with intercropping predominant at lower altitudes while at higher altitudes, sole cropping is more practiced and the crops (predominantly cool season vegetables) grown are more for the market. Fallowing is less common in the highly populated Bafou village while it lasts for between 2 and 5 years in some parts of Fongo-Tongo and Baleveng villages. The general characteristics of the farm plot studied are given in Table 1. Soil samples were collected from the 17 farm plots included in the study and analysed using standard procedures.
Model description: NUTMON-Toolbox is software for monitoring nutrient flows and stock especially in tropical soils (Vlaming et al., 2001). The toolbox enables the assessment of trends based on the local knowledge on soil fertility management and the calculation of nutrient balances. The tool is made up of a structured questionnaire, a database and two models (for calculating nutrient flows and economic parameters). The tool calculates flows and balances of the macronutrients-N, P and K through independent assessment of major inputs and outputs using the following equation:
Net soil nutrient balance = Σ(nutrient input)-Σ(nutrient output) |
The components of the nutrient balance are:
| • | Nutrient inputs denoted as IN 1, IN2, IN3, IN4, IN5 and IN6 and representing, mineral fertilizer, organic inputs, atmospheric deposition, biological nitrogen fixation, sedimentation and deep capture, respectively |
| • | Nutrient outputs denoted as OUT 1, OUT2, OUT3, OUT4, OUT5 and OUT6 and representing, farm products, other organic outputs, leaching, gaseous losses, erosion and human excreta, respectively |
| • | Internal flows, which are consumption of external feeds, household waste, crop residues, grazing, animal manure and home consumption of farm products as shown in Fig. 2 |
 | |
| Fig. 2: | Typical nutrient flow within a farm in the Western Highlands of Cameroon |
Farmers’ interviews: The semi-structured questionnaire developed by Van-den-Bosch et al. (1998) was adapted to collect data from heads of households of the selected farm plots. Biophysical, socio-economic and farming system data were collected through a household interview. Farmers gave information on the different production compartments, the different land uses and their major farm products and destinations. Nutrient flows directly related to their way of farming were quantified through information from farmers and through direct measurements on the farm or in the household. The inflows investigated by asking farmers were: the quantities of mineral fertilizers (IN 1), organic input such as manure (IN 2a) and organic fertilizers (IN 2b), entering the farm annually. The outflows included the quantity of crops (OUT 1a) and animal products (OUT 1b) leaving the farm as gifts or sales. Outflows measured were crop residue (OUT 2a) and animal manure (OUT 2b) leaving the farm. Farmers generally gave quantities in their own units, such as bundles, bags and buckets, which were converted to standard metric amounts. For each farmer, a field survey allowed us to identify the different land uses, the number of plots under each land use. Areas under different land use systems were measured using a hand-held GPS (Global Positioning System).
Use of transfer functions: In this study the choice of the functions was based on studies conducted by Stoorvogel and Smaling (1990) on nutrient balances for sub-Saharan Africa. Wet atmospheric deposition was calculated from mean annual precipitation as follows:
| (1) |
| (2) |
| (3) |
where, p is the mean annual precipitation.
Biological nitrogen fixation (IN4) in production systems was estimated from the general equation:
| (4) |
IN4a is the symbiotically fixed and IN4b the non-symbiotically fixed nitrogen. It was assumed that 60% of the total N demand of leguminous crop (soybeans, groundnut and pulses) is supplied through symbiotic nitrogen fixation (Stoorvogel and Smaling, 1990):
| (5) |
OUT1 (N) is the N exported in the leguminous crop and FL3a, the quantity of N accumulated in crop residues.
The non-symbiotic nitrogen fixation was estimated from the function:
| (6) |
Sedimentation (IN5) takes place in naturally flooded irrigated areas, where salinisation and iodisation naturally occur. No crop was registered on flooded or irrigated areas in the study site. This input was thus considered negligible.
Deep capture (IN6) occurs in the presence of trees that exploit the soil layers below the normal root zone of crops. Intensive cultivation has eliminated such components in the system and trees and shrubs are virtually absent in the farm plots. This input was thus not considered in this study area.
Estimation of nutrient outflows not managed by farmers: Leaching below the root zone (OUT3). In tropical soils phosphorus is tightly bound to soil particles, and leaching involves only nitrogen and potassium. The quantity of N and K annually lost (kg ha-1 yr-1) was estimated from the transfer functions developed by Stoorvogel et al. (1993).
For N leaching the (Smaling, 1993) model was used:
| (7) |
| (8) |
| (9) |
| Where: | ||
| Ns | = | Amount of mineralized N in the upper 20 cm of the soil; the mineralization rate of the site was estimated at 3% (Nye and Greenland, 1960) |
| Nf | = | Amount of N applied with mineral and organic fertilizers |
| p | = | Annual precipitation (mm year-1) |
| c | = | Clay content of the topsoil (percent).For K leaching, the Smaling 1993 model was also used |
| (10) |
| (11) |
| (12) |
| Where: | ||
| Ke | = | Exchangeable K (cmol kg-1) |
| Kf | = | Amount of K applied with mineral and organic fertilizers |
| p | = | Annual precipitation (mm year-1) |
| c | = | Clay content of the topsoil (percent).OUT4 (gaseous losses) consists of two parts: gaseous N losses from the soil and gaseous N losses related with storage of organic inputs. Gaseous N losses from the soil are calculated as a function of the clay percentage and the precipitation |
| (13) |
| Where: | ||
| Ns | = | Mineralized N in the rootable zone (kg ha-1) |
| Nf | = | N applied with mineral and organic fertilizer (kg ha-1) |
| c | = | Clay content (percent) |
| P | = | mean annual precipitation (mm year-1).Gaseous losses for N were calculated as |
| (14) |
| Where: | ||
| N | = | Faseous losses (kg/ha/yr) |
| Soil N | = | Mineralizable N in the upper 20cm of the soil profile |
| Fert N | = | Mineral or organic fertilizer |
| Clay% | = | The clay content of the upper 20 cm of the soil profile |
| p | = | The mean annual precipitation |
Gaseous losses from animal dejections: (OUT 4b).
None of the farmers in the study area depended on animal production. As such animal dejections were not significant in the system. Gaseous losses from animal dejections were therefore, assumed negligible.
OUT5 (erosion) was calculated using the USLE. A hypothetical soil loss per Farm Section Unit (FSU) was calculated based on slope, slope length, rainfall, soil characteristics and the presence of soil conservation measures. For each Primary Production Unit (PPU) or crop activity, the hypothetical soil loss (in kilograms per hectare per year) was multiplied by a crop cover factor, the nutrient content of the soil and an enrichment factor.
OUT 6 represents human faeces. It was not considered in the evaluation owing to its absence in the production system as a source of nutrients.
Nutrient balance: The NUTMON software quantifies nutrient flows in three ways: through the use of primary data, estimates and assumptions. Nutrient balances were quantified using the in-built transfer functions, equations and assumed values.
To distinguish between primary data and estimates, two different balances were calculated:- the partial balance at farm level (IN1+IN2)-(OUT1+OUT2) made up solely of primary data and the full balance (ALL IN-ALL OUT) made up of a combination of the partial balance and the immissions (atmospheric deposition and nitrogen fixation) and emissions (leaching, gaseous losses, erosion losses and human excreta) from and to the environment.
The quantified economic flows reveal the profitability of farming activities (Vlaming et al., 2001). Economic performance indicators were calculated at both activity level (crop) and farm household levels. The main indicators at activity level were gross margins (gross return minus variable costs) and net cash flows (cash receipts minus cash payments) per unit area. At farm household level, net farm income (total gross margin minus fixed costs) and family earnings (net farm income plus off-farm income) were the important indicators.
Statistical analysis: Correlation analysis, means, standard deviations and standard errors were calculated using the SPSS version 13.
RESULTS
Description of the cropping system of sampled farmers based on interviews: The primary production units (PPUs) were comprised of sole cropping of vegetable crops and intercropping systems. The principal vegetable crops were cultivated on fields generally between one and five kilometers from the homestead. The crops included potato (Solanum tuberosum), cabbage (Brassica sp.), carrot Daucus carota), leeks (Allium porrum), onions (Allium cepa) and beetroot (Beta vulgaris). The intercropping systems were practised around the homes and a few kilometers from the homestead with different combinations of maize (Zea mays), beans (Phaseolus vulgaris), potato (Solanum tuberosum), yams (Dioscorea sp.), aroids (Xanthosoma sp. and Colocasia sp.) bananas and plantains (Musa sp). The intercropping systems identified from the sample of farmers were:
| • | Beans+maize+potato (BMP) |
| • | Beans+maize (BM) |
| • | Beans+maize+potato+yam (BMPY) |
| • | Maize+potato (MP) |
Livestock or Secondary Production Unit (SPU) activities were uncommon with the farmers included in the nutrient balance study.
The identified nutrient flows into the farms in the study site were mineral fertilizers mostly 20.10.10 and urea (IN 1), off-farm chicken dung (IN 2), atmospheric deposition (IN 3), biological nitrogen fixation (IN 4a) and non-symbiotic nitrogen fixation (IN 4b). The only source of on-farm organic input were crop residue left after harvest which were directly recycled into the farm by incorporation during land preparation. A few farmers made compost around their homes which was used in home-gardens. In some cases the crop residues were burned and the ash exploited as organic input. Outflows from the farm included, crop uptake (OUT 1), removal in crop residue (OUT 2), gaseous loss (OUT 4), and erosion losses (OUT 5).
Nutrient balance at crop activity (PPU) level: The quantified nutrient balance at crop activity level (PPUs) using NUTMON-Toolbox are presented in Table 2 for nitrogen, phosphorus and potassium, respectively.
The only positive full balances for nitrogen were observed with leeks (PPU 3) with a value of 151.95 kg/ha/yr, carrot (PPU 5) with a value of 552.56 kg/ha/yr and tomato (PPU 8) with a value of 382.54 kg/ha/yr. The highest negative full balance for nitrogen was observed with mixed intercropping of bean, maize and potato (PPU 9) with a value of -697.57 kg/ha/yr. All the intercropping systems showed high negative full balances for nitrogen ranging from -697.57 to -509.78 kg/ha/yr. For phosphorus, the highest positive full balance was observed with carrot (PPU 5) with a value of 256.87 kg/ha/yr and the lowest positive was observed with beetroot (PPU 11) with a value of 7.49 kg/ha/yr. The highest negative full balance for phosphorus was observed for green pepper (PPU 2) with a value of -42.23 kg/ha/yr. For potassium, the highest positive full balance of 124.15 kg/ha/yr was observed with tomato (PPU 8) and lowest positive full balance of was observed with the intercropping of beans, maize, potato and yams (PPU 11) with a value of 1.16 kg/ha/yr. The highest negative full balance of -138.68 kg/ha/yr was observed with cabbage (PPU 4). With the partial NPK balances, except for the mixed intercropping system of beans, maize, potato and yams, all the others were positive for nitrogen while the partial balances for phosphorus and potassium followed similar trends as the respective full balances except PPU 11 with respect to potassium.
Nutrient balance for the study area: With regards to the average results of the study site, the full balances were positive for potassium (30.80 kg/ha/yr) and phosphorus (28.61 kg/ha/yr) and negative for nitrogen (-183.71 kg/ha/yr) while the partial balances were positive for all three (Table 3).
Table 4 shows the yield and gross margin of the principal vegetable cash crops of the WHC.
There were great variations in the yield and gross margin data and three of the crops cultivated showed negative gross margin values namely green pepper (-5617.82 US$ ha-1), leeks (-3631.30 US$ ha-1) and onions (-2910.39 US$ ha-1).
Table 5 shows the statistical significant relationships between household economic and farm characteristics.
Farm N and K balances were negatively correlated with the farm slope and the farm P balance was negatively correlated with the net farm income. The only positive correlation recorded was between the farm K balance and the total farm area (Table 5).
| Table 2: | NUTMON-Toolbox generated results for the study area. Average nutrient balance for Nitrogen, Phosphorus and Potassium for the different principal production units (PPUs) in the study area |
 | |
| a IN1, IN2, IN3 and IN4 represent mineral fertilizer, organic inputs, atmospheric deposition, and biological nitrogen fixation, respectively, bOUT1, OUT2, OUT3, OUT4 and OUT5 represent farm products, other organic outputs, leaching, gaseous losses and erosion, respectively | |
| Table 3: | NUTMON-Toolbox generated average farm-level nutrient budget (kg/ha/yr) for the study area |
 | |
| Table 4: | Yield and gross margin of the principal vegetable cash crops in the study area |
 | |
| 11US$ (United States Dollar) is approximately 500 CFA (Colonies françaises d'Afrique ("French colonies of Africa") which is the local currency of the study area | |
| Table 5: | Main significant correlations (Pearson) of household economic and farm characteristics in the study area |
 | |
DISCUSSIONS
The nutrient balance results showed that adequate attention was given by the farmers in nutrient management of vegetable cash crops of the area. Similar results on market oriented crops were also noted by Surendran et al. (2005). However, De-Jager et al. (1998) found a more negative N and K balances for higher market oriented crops in Kenya. Negative full balances for all three nutrients were seen with green pepper, implying that the amount of nutrients applied in this system was sub-optimal. All three nutrients had positive balances with leek, carrot and tomato production. Such a situation needs to be checked because of the risk of environmental pollution, habitat destruction and risk to human health and welfare since excess nutrients are pollutants.
As the yield-determining nutrient in most farming systems, adequate, but not excessive, amounts of N are needed to sustain yields and contribute to the maintenance of soil organic matter (Goulding et al.,2008). The net negative nitrogen balance for the study site could be attributed to the high outflow of N through harvested products, crop residues, losses from manure, leaching and gaseous loses as reported by Kroeze et al. (2003). Similar results were observed by Ehabe et al. (2010) and Kanmegne et al. (2006) in the southern part of Cameroon on perennial and annual crops. Vos and van Der Putten (2000) proposed that negative N balance could be mitigated by increasing the N fertilizer rates for crops grown, use of slow N release fertilizers, and incorporation of organic manure to recycle nutrients. Nitrogen Use Efficiency can also be improved by applying the necessary nutrients in the correct amounts at the correct times (Krupnik et al., 2004). The nitrogen uptake of beans intercropping systems (BMP, BM, BMPY) was greatly influenced by atmospheric nitrogen fixation (IN4) of the beans component. Traditionally, legumes have been viewed as excellent sources of N in agriculture (Kinzig and Socolow, 1994).
Nitrogen and potassium balances were found to be negatively influenced by the steepness of the farm slope similar to the findings of Schwab et al. (1993). Increasing population has provoked farming on vulnerable areas like steep slopes in the WHC. Practices like terraces and contour ploughing can help remedy the situation.
Full and partial balances of P were positive. Similar results were found in the humid forest of Cameroon by Ehabe et al. (2010) while Kanmegne et al. (2006) found partial and total negative balances for P in the humid forest zone of southern Cameroon. This positive balance was mainly due to the optimal use of P fertilizers and absence of pathways of losses of P other than crop uptake (OUT 1) and loss in crop residues (OUT 2). Use of P solubilizing (Phospho-bacteria) and mobilizing Vesicular Abruscular Mycorrhizae (VAM) microorganisms as biofertilizers could improve the utilization of native soil P in such situations of P fertility buildup in soil (Debnath and Basak, 1986). The popular view that P is strongly held in soils has resulted in the build-up of excessive P levels in some soils, resulting in enhanced leaching (Heckrath et al., 1995). Even where soil P levels are at the optimum, the loss by erosion of small amounts of P adsorbed on sediments or in solution can trigger the eutrophication of freshwaters (Leinweber et al., 2002).
In this study, the household net farm income was negatively related to the soil phosphorus balance. This result is different from those of De-Jager et al. 1998 who found that household net farm income showed no relation with the nutrient balance in three districts in Kenya.
Full and partial balances for K were also positive indicating absence of deficiency in the study area. Similar results were found in the humid forest of Cameroon by Ehabe et al. (2010) while Kanmegne et al. (2006) found partial and total negative balances for K in their study of smallholder production systems in the humid forest zone of southern Cameroon. Crop uptake of K is usually as much as N uptake and sometimes higher, as in the case of roots and tubers. There appear to be no health or environmental problems associated with K leaching and there are no gaseous emissions (Goulding et al. 2008). However, over fertilization with potassium can induce a magnesium deficiency and also cause a loss of soil structure (Goulding and Annis, 1998). While the total farm area cultivated was positively correlated with the K balance in this study, De-Jager et al. (1998) found in their study that the cultivated area had a negative correlation with the level of nutrients leaving the farm through agricultural products sold.
The yields of the principal vegetable cash crops of the study area showed very high variations and the negative gross margins of green pepper, leeks and onions indicated that either they were not profitable or the cropping practices were not adequate. The negative gross margin of green pepper could be linked to the fact the cropping practices resulted to negative balances in all the three nutrients studied. Generally one of the causes of low profit obtained by the farmers is due to widespread market imperfections and improving the relationship between farmers and buyers could contribute to a better economic situation of the farmers (Schipmann and Qaim, 2011).
CONCLUSION AND RECOMMENDATIONS
Resource flows and nutrient balances from this study show that soil nitrogen depletion is a major problem in the study area. Nutrient mining is more intense in the intercropping production system of the smallholder farmers in WHC but the inclusion of legume crops in the intercropping system alleviates the situation. Harvesting of crops for food and for sale and soil erosion are the most important sources of nutrient mining in the crop production systems. Therefore attempts to correct the imbalance need to address these and other socio-economic factors. Given the high costs of fertilizers, the recycling of kitchen residues, animal dejections and/or human faeces, and intensified use of legume as intercrops could significantly modify the nutrient balance and the sustainability of the systems. There exist findings that support the fact that intercropping enhances sustainable plant production (Ledgard, 2001; Aggarwal et al., 1992). There is also good evidence that adding organic matter and fertilizers together improves NUE, as nutrients are held by the microbial biomass (Turner and Haygarth, 2001). In a study conducted by Olesen et al. (2004), cover crops reduced fertilizer N requirement by 27 kg ha-1 and increased NUE from 42 to 52%; however, nitrate leaching increased by 14 kg ha-1.
The magnitude of nutrient mining as a result of crop harvests in Africa is huge. It has been shown that about 100 kg P and 450 kg K per hectare have been lost during the past years from approximately 100 million ha of cultivated land in Africa which is the fundamental biophysical reason for the declining food production in smallholder farms (Sanchez, 1976, 1995; Stoorvogel et al.,1993). Studies have shown that leguminous trees in alley cropping systems can produce up to 20 t/ha/yr dry matter of prunings, containing as much as 358 kg N, 28 kg P, 232 kg K, 144 kg Ca, and 60 kg Mg (Young, 1989; Szott et al., 1991; Bowen, 1984), more than enough to meet most crop requirements. There exist many types of soil enriching species in the WHC such as Tithonia diversifolia, Arachis glabrata, Cajanus cajans, Tephrosia sp, Sesbania sp, Leucaena sp, Calliandra sp and Crotalaria sp which can be used as organic inputs and also to improve the structure of the soil.
This study is one of the first attempts to create a database on nutrient balance studies in the WHC which is a useful guide to policy makers, researchers, extension specialists and farmers alike in dealing with nutrient management.
ACKNOWLEDGMENTS
This study was made possible by funding from Volkswagen foundation. The authors wish to thank Maarten van’t Zelfde of the Institute for Environmental Sciences (CML), Leiden, for producing the map of the research site. We are very grateful to the extension workers of the Menoua Division who participated in the data collection and the household members who provided the useful data for the study.
REFERENCES
- Bationo, A., F. Lompo and S. Koala, 1998. Research on nutrient flows and balances in west Africa: State-of-the-art. Agric. Ecosyst. Environ., 71: 19-35.
CrossRef - Deugd, M., N. Roling and E.M.A. Smaling, 1998. A new praxeology for integrated nutrient management, facilitating innovation with and by farmers. Agric. Ecosyst. Environ., 71: 269-283.
CrossRef - Ehabe, E.E., N.L. Bidzanga, C.M. Mba, J.N. Njukeng, I. de Barros and F. Enjalric, 2010. Nutrient flows in perennial crop-based farming systems in the humid forests of Cameroon. Am. J. Plant Sci., 1: 38-46.
Direct Link - Galloway, J.N., 1998. The global nitrogen cycle: Changes and consequences. J. Environ. Pollut., 102: 15-24.
Direct Link - Goulding, K., S. Jarvis and A. Whitmore, 2008. Optimizing nutrient management for farm systems. Philos Trans. R. Soc. Lond B Biol. Sci., 363: 667-680.
Direct Link - Heckrath, G., P.C. Brookes, P.R. Poulton and K.W.T. Goulding, 1995. Phosphorus leaching from soils containing different phosphorus concentrations in the broadbalk experiment. J. Environ. Qual., 24: 904-910.
CrossRefDirect Link - Kanmegne, J., E.M.A. Smaling, L. Brussaard, A. Gansop-Kouomegne and A. Boukong, 2006. Nutrient flows in smallholder production systems in the humid forest zone of southern Cameroon. Nutr. Cycl. Agroecosyst., 76: 233-248.
CrossRef - Kroeze, C., R. Aerts, N. van Breemen, D. van Dam and P. Hofschreuder et al., 2003. Uncertainties in the fate of nitrogen I: An overview of sources of uncertainty illustrated with a Dutch case study. Nutrient Cycling Agroecosyst., 66: 43-69.
CrossRef - Krupnik, T.J., J. Six, J.K. Ladha, M.J. Paine and C. Van Kessel, 2004. An Assessment of Fertilizer Nitrogen Recovery Efficiency by Grain Crops. In: Agriculture And The Nitrogen Cycle: Assessing The Impacts of Fertilizer Use on Food Production and the Environment, Mosier, A.R. and J.J.K. Syers (Eds.). Island Press, Washington, DC., USA., pp: 193-207.
- Ledgard, S.F., 2001. Nitrogen cycling in low input legume-based agriculture, with emphasis on legume/grass pastures. Plant Soil, 228: 43-59.
CrossRef - Molua, L.E., 2002. Climate variability, vulnerability and effectiveness of farm-level adaptation options: The challenges and implications for food security in Southwestern Cameroon. Environ. Dev. Econ., 7: 529-545.
Direct Link - Oenema, O., H. Kros and W. de Vries, 2003. Approaches and uncertainties in nutrient budgets: Implications for nutrient management and environmental policies. Eur. J. Agron., 20: 3-16.
CrossRef - Olesen, J.E., P. Sorensen, I.K. Thomsen, J. Eriksen, A.G. Thomsen and J. Berntsen, 2004. Integrated Nitrogen Input Systems in Denmark. In: Agriculture and the Nitrogen Cycle: Assessing the Impacts of Fertilizer use on Food Production and the Environment, Mosier, A.R. and J.J.K. Syers (Eds.). Ch. 9. Island Press, Washington, DC., pp: 129-140.
- Schipmann, C. and M. Qaim, 2011. Supply chain differentiation, contract agriculture and farmers marketing preferences: The case of sweet pepper in Thailand. Food Policy, 36: 667-677.
CrossRef - Smaling, E.M.A., L.O. Fresco and A. de Jager, 1996. Classifying monitoring and improving soil nutrient stocks and flows in Africa agriculture. AMBIO: J. Human Environ., 25: 492-496.
Direct Link - Stoorvogel, J.J., E.M.A. Smaling and B.H. Janssen, 1993. Calculating soil nutrient balances in Africa at different scales. I. Supra-national scale. Nutr. Cycl. Agroecosyst., 35: 227-235.
CrossRefDirect Link - Smalling, E.M.A. and A.R. Braun, 1996. Soil fertility research in sub-Saharan Africa: New dimensions, new challenges. Commun. Soil Sci. Anal., 24: 365-386.
Direct Link - Smil, V., 2000. Phosphorus in the environment: Natural flows and human interferences. Ann. Rev. Energy Environ., 25: 53-88.
CrossRefDirect Link - Surendran, U., V. Murugappan, A. Bhaskaran and R. Jagadeeswaran, 2005. Nutrient budgeting using NUTMON - Toolbox in an irrigated farm of semi arid tropical region in India: A micro and meso level modeling study. World J. Agric. Sci., 1: 89-97.
Direct Link - Szott, L.T., E.C.M. Fernandes and P.A. Sanchez, 1991. Soil-plant interactions in agroforestry systems. For. Ecol. Manage., 45: 127-152.
CrossRef - Tchabi, A., D. Coyne, F. Hountondji, L. Lawouin, A. Wiemken and F. Oehl, 2008. Arbuscular mycorrhizal fungal communities in sub-Saharan savannas of Benin West Africa as affected by agricultural land use intensity and ecological zone. Mycorrhiza, 18: 181-195.
CrossRefPubMedDirect Link - Turner, B.L. and P.M. Haygarth, 2001. Biogeochemistry: Phosphorus solubilization in rewetted soils. Nature, 411: 258-258.
CrossRef - Van der Pol, F., 1992. Soil Mining. An Unseen Contributor to Farm Income in Southern Mali. Bulletin Royal Tropical Institute, Amsterdam, Pages: 48.
Direct Link - Vos, J. and P.E.L. van Der Putten, 2000. Nutrient cycling in a cropping system with potato, spring wheat sugar beet oats and nitrogen catch crops. I. Input and off take of nitrogen phosphorus and potassium. Nutr. Cycling Agroecosyst., 56: 87-97.
CrossRefDirect Link - Wortmann, C.S., M. Fischler, F. Alifugani and C.K. Kaizzi, 1998. Accomplishments of participatory research for systems improvement in Iganga district Uganda 1993 to 1997. Network on Bean Research in Africa, Occasional Publications Series, No. 27, CIAT, Kampala, Uganda. http://ciat-library.ciat.cgiar.org/articulos_ciat/op27_part_research.pdf.