
S. M. Matar
Department of Bioprocess Development, Mubarak City for Scientific Research and Technology Applications, New Borg El-Arab, Alexandria, Egypt
S.A. El-Kazzaz
Department of Plant Pathology, College of Agriculture, University of Alexandria, Egypt
E. E. Wagih
Department of Plant Pathology, College of Agriculture, University of Alexandria, Egypt
A.I. El-Diwany
National Research Center, Dokki, Cairo, Egypt
M. A. El-Saadani
Mubarak City for Scientific Research and Technology Applications, New Borg El-Arab, Alexandria, Egypt
E. E. Hafez
Department of Plant Molecular Pathology, Arid Lands Research Institute, Mubarak City for Scientific Research and Technology Applications, New Borg El-Arab, Alexandria, Egypt
H. E. Moustafa
Department of Bioprocess Development, Mubarak City for Scientific Research and Technology Applications, New Borg El-Arab, Alexandria, Egypt
H.E. Abd-Elsalam
Department of Environmental Biotechnology, Mubarak City for Scientific Research and Technology Applications, New Borg El-Arab, Alexandria, Egypt
G.A. Abo-Zaid
Department of Bioprocess Development, Mubarak City for Scientific Research and Technology Applications, New Borg El-Arab, Alexandria, Egypt
E. A. Serour
Department of Protein Research, Mubarak City for Scientific Research and Technology Applications, New Borg El-Arab, Alexandria, Egypt


ABSTRACT
Fourteen Bacillus subtilis isolates (B1 to B14) obtained from different Egyptian sites had different antagonistic and inhibitory effect against six fungal isolates belonging to four different genera, Rhizoctonia solani, Helminthosporium sp., Alternaria sp. and Fusarium oxysporum. Random Amplified Polymorphic DNA (RAPD), differential display technique and partial sequencing of 16S rRNA gene were used for characterization of isolates. While RAPD technology, using 4 different random 20-mer primers, revealed different levels of molecular variation among twelve out of the fourteen isolates tested, the remaining two isolates B3 and B5, demonstrated identical profiles. Because of the high degree of homology (93%) between isolates B4 and B7 and the no variation observed between isolates B3 and B5, the differential display technique was used to test the reliability of these results. Isolate B7 was selected for batch cultivation in bioreactor, the biomass achieved was 3.2 g L-1. Inhibitory activity of supernatant was increased near the end of the stationary phase. The activity reached its highest value of 1.7 cm in death phase.
PDF Abstract XML References Citation
How to cite this article
S. M. Matar, S.A. El-Kazzaz, E. E. Wagih, A.I. El-Diwany, M. A. El-Saadani, E. E. Hafez, H. E. Moustafa, H.E. Abd-Elsalam, G.A. Abo-Zaid and E. A. Serour, 2009. Molecular Characterization and Batch Fermentation of Bacillus subtilis as Biocontrol Agent, II. Biotechnology, 8: 35-43.
DOI: 10.3923/biotech.2009.35.43
URL: https://scialert.net/abstract/?doi=biotech.2009.35.43
DOI: 10.3923/biotech.2009.35.43
URL: https://scialert.net/abstract/?doi=biotech.2009.35.43
INTRODUCTION
The Random Amplified Polymorphic DNA (RAPD) which is a Polymerase Chain Reaction (PCR)-based technique in which amplification of random DNA segments with single primers of arbitrary nucleotide sequence (Williams et al., 1990; Hilton et al., 1997) is conducted and used as powerful tool for genetic studies involving molecular genetic diversity of microorganisms. A robust RAPD-PCR procedure for large-scale typing of B. cereus was developed by Nilsson et al. (1998). It is based on a simple DNA preparation, involving only freezing and boiling of cells in water with active carbon. By using a computerized for data collection and processing, an efficient system for handling RAPD patterns for large scale investigation was achieved. The procedure was highly discriminatory for B. cereus strains and was found to give reproducible classification of RAPD fingerprints for five reference strains. Istock et al. (2001) analyzed the geographical distribution and structure of B. subtilis genomic lineages using RAPD fingerprints. Six major genomic lineages separating at 9-18% similarity were found. One hundred and twenty-six strains of B. thuringiensis representing 57 serovars were allocated to 58 genomic types using random amplified polymorphic DNA (RAPD)-PCR patterns (Gaviria and Priest, 2003), also Levy et al. (2006) used the RAPD technique to distinguish between seven Bacillus species. Differential display is a molecular biology technique that can distinguish between genes that are up- or down regulated. Initially described by Liang and Pardee (1992), differential display encompasses several reverse transcription polymerase chain reaction (RT-PCR) techniques that can produce a large number of cDNA fragments from cellular RNA. First, anchored 3` poly-T primers are used to create cDNAs corresponding to all possible mRNA species. Next, specific gene fragments are amplified by use of random 5` primers.
Fislage et al. (1997) developed a primer set for a prokaryotic differential display of mRNA in the Enterobacteriaceae group. The technique of mRNA differential display was used to identify simultaneously two metabolic genes involved in the degradation of cyclohexanone in a new halotolerant Brevibacterium isolate (Brzostowicz et al., 2000). Chia et al. (2001) analyzed differential gene expression of Streptococcus mutans in response to environmental stress by RNA fingerprinting using arbitrarily primed PCR with a panel of 11 mer primers designed for differential display in Enterobacteriaceae. In a batch process, all substrates are much available in the initial medium and none is supplied extra during the process. The process is stopped after the substrate is converted and the whole batch is harvested together (Sonnleitner, 1998; Wirtz, 2002). A batch growth is a non-steady state process; that is the content of the bioreactor changes with time. The nutrients and the inoculum are added to the bioreactor at the beginning of the batch operation and air is supplied continuously. After a short lag time, B. thuringiensis cells begin the exponential growth; the carbon source is oxidized and owing to organic acids accumulation, the pH drops dramatically. The biomass concentration and the cell count increases as the carbon source decreases. The oxygen demand increases during the exponential stage and there are no spores present in the bioreactor (Avignone-Rossa and Mignone, 1995). The production of biocontrol agent of B. subtilis R14 was evaluated in a batch bioreactor (Luna et al., 2002). Batch operation has been used for comparison with other modes of growth as a reference. Liu et al. (1994) for example compared the results obtained in a batch growth with a fed-batch growth of B. thuringiensis subspecies kurstaki. The maximum biomass concentration obtained in batch growth was 5.9 g dry weight mL-1 whereas the maximum biomass concentration was 53.7 g dry weight mL-1 in fed-batch growth.
The objective of this study was for molecular characterization of bacterial isolates which have an antagonistic and inhibitory effect against certain plant pathogenic fungi and study the behavior of B. subtilis isolate B7 during batch cultivation in bioreactor.
MATERIALS AND METHODS
Bacterial and fungal isolates: Fourteen B. subtilis isolates were isolated in 2002-2003 from different locations in Egypt (El-Malaha, El-Amria, El-Nobaria, Abo-Homos and El-Sharkia) and identified according to the morphological, biochemical and physiological tests recommended by Sneath et al. (1986) and Collee et al. (1996). Six fungal isolates belonging to four different genera were isolated in 2002-2003 from different hosts and area in Egypt, R. solani, Helminthosporium sp., Alternaria sp. and Fusarium oxysporum.
Antagonistic and inhibitory effect of B. subtilis isolates (in vitro): Antagonistic effect of fourteen B. subtilis isolates and inhibitory effect of supernatant fluid were performed against all fungal isolates according to Toure et al. (2004) and Chitarra et al. (2003). The data obtained were statistically analyzed using the Statistical Analysis System (SAS).
Genotypic characterization
DNA extraction protocol: Total DNA was extracted from B. subtilis isolates according to Istock et al. (2001).
Random Amplified Polymorphic DNA (RAPD): Four 20-mer arbitrary primers were used for RAPD analysis (A1A13, A9B7, A1 and A7) (Abdel Ghany and Zaki, 2003). Sequences of all primers are shown in Table 1. For RAPD analysis, PCR amplification was carried out in a total volume 25 μL containing 2.5 μL 10x buffer, 2 μL 25 mM MgCl2, 2 μL 2.5 mM dNTPs, 1 μL 10 pmol primer, 1 μL 50 ng of bacterial genomic DNA and 0.2 μL (5 U μL-1) Taq DNA polymerase (Promega, Germany). PCR amplification was performed in a thermal cycler (Eppendorf, Germany) programmed for one cycle at 95°C for 5 min followed by 34 cycles each with 30 sec at 95°C for denaturation, 1 min at 45°C for annealing and 2 min at 72°C for elongation. Reaction mixture was then incubated at 72°C for 10 min for final extension (Istock et al., 2001).
Differential display analysis: Total RNA was extracted from B. subtilis isolates using TRI-reagent (Chin et al., 2000). Reverse transcription reactions were performed using oligo dT primer (5`-TTTTTTTTTTTTTTT-3`). Each 25 μL reaction mixture contained 2.5 μL 5x buffer with MgCl2, 2.5 μL 2.5 mM dNTPs, 1 μL 10 pmol primer, 2.5 μL RNA and 0.2 μL (5 U μL-1) reverse transcriptase (Promega, Germany). PCR amplification was performed in a thermal cycler (Eppendorf, Germany) programmed at 95°C for 5 min, 42°C for 1 h, 72°C for 10 min and a soak at 4°C (Chin et al., 2000).
| Table 1: | Sequence of all primers used in this study |
 | |
Three primers were used in the differential display analysis one of them is specific for 16S rRNA gene (P0) but the other were arbitrary in sequence (P1 and P2). Sequence of primers is shown in Table 1. The reaction mixture for differential display PCR was carried out in a total volume 25 μL containing 2.5 μL 10x buffer with MgCl2, 2 μL 2.5 mM dNTPs, 1 μL 10 pmol primer, 1.5 μL cDNA and 0.2 μL (5 U μL-1) Taq DNA polymerase (Promega, Germany). PCR amplification was performed in a thermal cycler (Eppendorf, Germany) programmed for one cycle at 95°C for 5 min, then 34 cycles as follows: 30 sec at 95°C for denaturation, 1 min at 45°C for annealing and 2 min at 72°C for elongation. Reaction was then incubated at 72°C for 10 min for final extension (Chin et al., 2000).
Amplification of 16S rRNA gene: The full length (1550 bp) of 16S rRNA gene was amplified for all B. subtilis isolates by using two universal primers (P0 and P6) (Sow et al., 2005). Sequence of primers is illustrated in Table 1. PCR amplification was carried out in a total volume 50 μL containing 5 μL 10x buffer, 4 μL 25 mM MgCl2, 4 μL 2.5 mM dNTPs, 2 μL 10 pmol forward primer, 2 μL 10 pmol reverse primer, 2 μL 50 ng of bacterial genomic DNA and 0.4 μL (5 U μL-1) Taq DNA polymerase (Promega, Germany). PCR amplification was performed in a thermal cycler (Eppendorf, Germany) programmed for one cycle at 95°C for 5 min followed by 34 cycles each with 45 sec at 95°C for denaturation, 1 min at 50°C for annealing and 2 min at 72°C for elongation. Reaction mixture was then incubated at 72°C for 10 min for final extension (Sambrook et al., 1989).
Sequencing of 16S rRNA gene and the accession number: QIAquick PCR purification kit (Qiagen, Germany) was used to purify the amplified products of 16S rRNA gene.
The amplified product (1550 bp) of 16S rRNA was sequenced by the use of a Big Dye terminator cycle sequencing kit. Sequencing products were purified using Centri-Sep spin columns and were resolved on an ABI PRISM model 310 automated DNA sequencer at the Agriculture Genetic Engineering Research Institute (AGERI) in Egypt.
Fermentation experiments
Bioreactor: Batch and fed-batch cultivations were performed in a 3 L bench-top bioreactor (Bioflow III, New Brunswick, N J, USA) equipped with two 6-bladed disc-turbine impeller and four baffles and connected to a digital control unit. The process was automated through a computer aided data bioprocessing system AFS-BioCommand multi-process management program. The set points for temperature and pH value were 30°C and 7, respectively and pH was controlled by automatic feeding of 2N NaOH. Compressed air was supplied initially at 0.5-1.0 VVM (air volume per broth volume per minute) through sterile filter. It was manually controlled in parallel with agitation speed (150-900 rpm) to maintain the dissolved oxygen level above 20%. Dissolved oxygen and pH values were determined on-line using METTLER TOLEDO electrodes. Antifoam A (Sigma) was used for eliminating foaming.
Batch fermentation: Batch cultivation was initiated in a bioreactor using a volume of 1900 mL of fresh number 3 medium of which each 1 L contained 10 g peptone, 10 g glucose, 1 g KH2PO4 and 0.5 g MgSO4. 7H2O in distilled water and a pH of 6.8 (Asaka and Shoda, 1996) which was then inoculated with 100 mL of shake flask pre-cultured seeds which had previously been prepared as follows: a single colony of B. subtilis B7 (Abo-Homos) which was selected from fourteen isolates had antagonistic effect against all tested fungi, but showed more antagonistic effect against Alternaria sp. (Matar et al., 2008(I)) was inoculated into a 500 mL Erlenmeyer flask containing 100 mL of No. 3 medium and cultured overnight at 30°C with constant shaking at 200 rpm. During the time of cultivation, several samples of culture were taken and cell number was determined by measuring of optical density (OD) at 550 nm. Glucose level was estimated by enzymatic (GOD-PAD) colorimetric kit (Diamond Diagnostic, Egypt) and the inhibitory activity assay of supernatant fluid was performed against Alternaria sp. according to Chitarra method (Chitarra et al., 2003). Also, 10 mL of cultivated broth was separated overtime to apply the dry test method.
RESULTS
Data of antagonistic and inhibitory effect of B. subtilis isolates (in vitro) was explained by Matar et al. (2008(I)). When Random Amplified Polymorphic DNA (RAPD) technique was used to molecularly differentiate among the 14 B. subtilis isolates, using four 20-mer arbitrary primers (Table 1), clear differences among twelve isolates on the bases of amplified product band patterns observed with each primer (Fig. 1, 2). Notably, high similarity (93%) was observed between B4 (El-Nobaria) and B7 (Abo-Homos) and also between B8 (El-Malaha) and B9 (El-Malaha). Exceptionally, isolates B3 (El-Malaha) and B5 (El-Amria) gave identical band patterns with all the four primers used. Results indicated that 256 amplicons were produced by all primers. The number of amplified products produced by each primer varied from 46 with primer A1A13 to 75 with primer A9B7. However, primer A1A13 and A7 failed to show any amplified products with isolate B9 (El-Malaha).
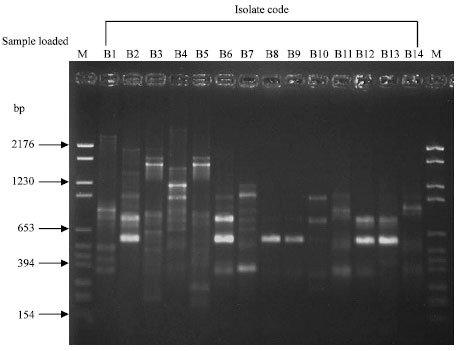 | |
| Fig. 1: | RAPD-PCR patterns of Bacillus subtilis isolates with primer A9B7. Lanes on both sides of the gel labeled M are loaded with PBR 328 Mix DNA marker. B1 to B14 are the fourteen Bacillus subtilis isolates investigated. Isolates B1, B3, B8 and B9 are those of El-Malaha; B5 and B6 are of El-Amria; B4, B10, B11 and B12 are of El-Nobaria; B7, B13 and B14 are from Abo-Homos; B2 is that isolated from El-Sharkia |
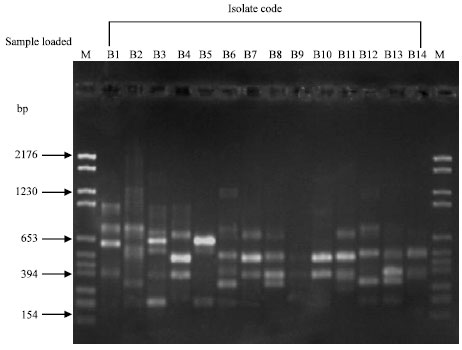 | |
| Fig. 2: | RAPD-PCR patterns of Bacillus subtilis isolates with primer A1. Lanes on both sides of the gel labeled M are loaded with PBR 328 Mix DNA marker. B1 to B14 are the fourteen Bacillus subtilis isolates investigated. Isolates B1, B3, B8 and B9 are those of El-Malaha; B5 and B6 are of El-Amria; B4, B10, B11 and B12 are of El-Nobaria; B7, B13 and B14 are from Abo-Homos; B2 is that isolated from El-Sharkia |
The RAPD band patterns resulting from the use of the four primers were analyzed using UPGMA method to construct a similarity matrix and to generate a dendrogram indicating the relationship between the fourteen tested isolates of B. subtilis.
 | |
| Fig. 3: | Dendrogram obtained by clustering (UPGMA method) based on the band pattern obtained by the RAPD-PCR analysis of fourteen Bacillus subtilis isolates from different location according to Jaccard similarity |
The presence or absence of any particular DNA bands was the only parameter considered in the computer analysis. The dendrogram generated to show linkage distance (Fig. 3) indicated that the fourteen B. subtilis isolates were classified into two main Clusters (Cluster I and Cluster II). Cluster I represented only one group which included the two B. subtilis isolates B3 (EL-Malaha) and B5 (El-Amria). Cluster II split into two Sub-clusters: Sub-cluster 1 that divided further into two Groups: Group 1 which included isolate B2 (El-Sharkia) and Group 2 which included B6 (El-Amria), whereas Sub-cluster 2 divided into two Groups: Group 1 included B1 (El-Malaha) and Group 2 divided into two Sub-groups: Sub-group 1 contained B11 (El-Nobaria), B4 (El-Nobaria) and B7 (Abo-Homos) and Sub-group 2 contained B10 (El-Nobaria), B12 (El-Nobaria), B14 (Abo-Homos), B13 (Abo-Homos), B8 (El-Malaha) and B9 (El-Malaha), respectively.
The results obtained when the differential display technique was applied to B. subtilis isolates B3 (El-Malaha) and B5 (El-Amria), which could not be differentiated when analyzed by the RAPD-PCR, using the primer P0 of the 16S rRNA gene revealed clear differences. While, three fragments differing in molecular size, 637, 1083 and 1767 bp were shown with isolate B3 (El-Malaha) but not shown with B5 (El-Amria). Two fragments of a size of 763 and 860 bp were appeared with B5 (El-Amria) but not with B3 (El-Malaha). Similarity results were obtained (Fig. 4) where isolate B4 (El-Nobaria) and B7 (Abo-Homos), which showed high percentage of similarity when exposed to RAPD analysis, were tested with the same primer (P0). While only one fragment of 860 bp was observed with isolate B4 (El-Nobaria) but not with B7 (Abo-Homos), four fragments differing in molecular size, 2361, 2457, 3398 and 3910 bp were detected with B7 but not with B4.
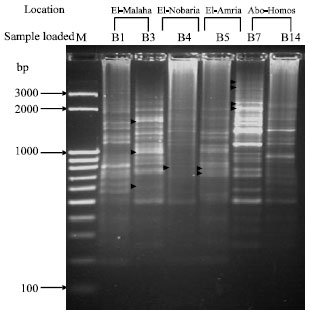 | |
| Fig. 4: | Differential display RT-PCR for six Bacillus subtilis isolates using primer P0. The lane labeled M at the left-hand side of the gel was loaded with M25-3 k bp ladder; the other lanes were loaded with B1 and B3 (El-Malaha), B4 (El-Nobaria), B5 (El-Amria), B7 and B14 (Abo-Homos). Arrows within the gel point out polymorphic bands |
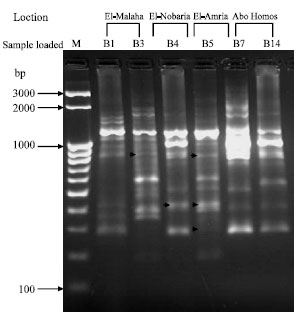 | |
| Fig. 5: | Differential display RT-PCR for six Bacillus subtilis isolates using primer P1. The lane labeled M at the left-hand side of the gel was loaded with M25-3 k bp ladder; the other lanes were loaded with B1 and B3 (El-Malaha), B4 (El-Nobaria), B5 (El-Amria), B7 and B14 (Abo-Homos). Arrows within the gel point out polymorphic bands |
Supportive results of polymorphism were observed (Fig. 5) when the arbitrary primer (P1) was used as, one fragment of a size of 980 bp was shown with isolate B3 (El-Malaha) but not with B5 (El-Amria). Three fragments of 295, 435 and 948 bp were appeared with B5 but not with B3. One fragment of 430 bp was evident with B4 (El-Nobaria) but not with B7 (Abo-Homos).
| Table 2: | The accession No. and isolate code of 16S rRNA gene of Bacillus subtilis isolates in the GenBank |
 | |
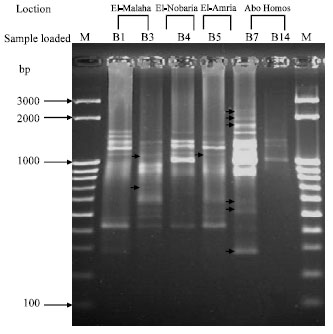 | |
| Fig. 6: | Differential display RT-PCR for six Bacillus subtilis isolates using the arbitrary primer P2. The Lanes lablelled M at both sides of the gel were loaded with M25-3 k bp ladder; the other lanes were loaded with B1 and B3 (El-Malaha), B4 (El-Nobaria), B5 (El-Amria), B7 and B14 (Abo-Homos). Arrows within the gel point out polymorphic bands |
When differential display analysis with the arbitrary primer P2 was conducted (Fig. 6), two fragments of a size of 741 and 1186 bp were observed with B3 (El-Malaha), but not with B5 (El-Amria) and only one fragment of 1199 bp was detected with B5 with no corresponding band with B3. Likewise, the same primer gave six fragments (286, 522, 596, 1856, 2094 and 2335 bp) with B7 but these fragments were not generated with B4.
Approximately 1550 bp of the 16S rRNA gene was amplified for all the fourteen B. subtilis isolates using universal primers (Table 2). Consequently, the obtained amplicon was later subjected to sequencing analysis.
 | |
| Fig. 7: | Biomass, glucose concentration and inhibitory activity of culture supernatant as a function of time for batch cultivation of Bacillus subtilis isolate B7 |
When the purified product (1550 bp) of the 16S rRNA gene was subjected to sequencing using ABI PRISM model 310 automated DNA sequencer, the following partial sequence was obtained for B. subtilis isolates B1 (El-Malaha), B4 (El-Nobaria), B7 (Abo-Homos), B8 (El-Malaha), B10 (El-Nobaria), B11 (El-Nobaria) and B14 (Abo-Homos) (Table 2).
Search in databases to identify the bacteria was achieved in BLAST search at the National Center for Biotechnology Information site (http://www.ncbi.nlm.nih.gov). The search revealed that these sequences were identical to that of B. subtilis.
Bacterial isolates (B1, B4, B7, B8, B10, B11 and B14) were identified according to partial sequence of 16S rRNA gene as B. subtilis and scored in GenBank with accession No. (EF150883, EF150884, EF583053, EF583054, EF583055, EF583056 and EF150885) (Table 2).
Batch cultivation of B. subtilis isolate B7 was carried out in 3 L bench top bioreactor (Bioflow III, New Brunswich, NJ, USA) at a constant temperature of 30°C. Figure 7 shows biomass, concentration of consumed glucose and inhibitory activity of supernatant of isolate B7 plotted against the time. Cells were grown directly after the lag phase which lasted for about 2 h. Cell mass was then increased exponentially over time with a constant specific growth rate, μ = 0.3 h-1 within the exponential phase. The behavior in this phase allows to calculate the yield coefficient YX/S (0.45 g cells g glucose). During this phase, the specific growth rate of 0.3 h-1 was determined from the logarithmic relationship shown in Fig. 8. In the Fig. 8, the values of the ln X (values of X was obtained by using the correlation coefficient δ, 0.42 calculated from the linear relationship between dry mass weight and optical density) was presented by a straight line on a semi-logarithm plot versus time. The biomass achieved was 3.2 g L-1. Inhibitory activity of supernatant was increased near the end of the stationary phase. The activity reached its highest value of 1.7 cm in death phase.
 | |
| Fig. 8: | ln biomass (X) in g L-1 as a function of time in the exponential growth phase of batch cultivation of Bacillus subtilis isolate B7 |
Modeling of batch fermentation: The most common culture system is the batch culture, due to its simplicity and low cost. This is a closed system in which there is no input or output of materials. The microbial population cell density increases constantly until exhaustion of some limiting factor, while other nutrient components of the culture medium decrease over time. Any products produced by the cells during growth also increase in concentration in the culture medium.
In batch culture, it was important to calculate growth yield for B. subtilis during cultivation on glucose. Yield coefficient was calculated based on the amount of glucose consumed (Shuler and Kargi, 1992). The following equation was used to calculate growth yield (YX/S).
(1) |
where, X and X0 are biomass concentrations (g L-1) at measuring time t and initial time t0, respectively. S and S0 are the consumed amounts of glucose (g L-1) at the same times mentioned previously.
In logarithmic growth phase, cell mass density increases exponentially with time t and specific growth rate μ (h-1) is independent of nutrient concentration. According to Shuler and Kargi (1992), the exponential growth rate is first order.
(2) |
by integration of Eq. 2 yields
(3) |
The exponential growth is characterized by a straight line on a semi logarithm plot of ln X versus time.
DISCUSSION
Molecular techniques, such as RAPD-PCR, are powerful tools for obtaining data related to the genomic diversity that exists among the strains belonging to a bacterial species (genetic diversity). Istock et al. (2001) used RAPD-PCR for studying geographical diversity of genomic lineages in B. subtilis and Drake et al. (1996) used single primer G1, could distinguish 16 commercial strains of Lactobacillus helveticus by RAPD-PCR profiling. One hundred and twenty-six strains of B. thuringiensis representing 57 serovars were allocated to 58 genomic types using random amplified polymorphic DNA (RAPD)-PCR patterns (Gaviria and Priest, 2003). The fourteen B. subtilis isolates obtained in this study from different areas in Egypt could be differentiated using random amplified polymorphic DNA technique and it was possible to categorize them in two main Clusters, Cluster I which included one group with two B. subtilis isolates, B3 and B5 (similarity 100%) and Cluster II which encompassed four groups containing twelve B. subtilis isolates.
Differential display is a molecular biology technique that can distinguish between genes that are up- or down regulated. The failure of RAPD-PCR to show any variation between B. subtilis isolates B3 (El-Malaha) and B5 (El-Amria), acsside the high similarity percentage between B4 (El-Nobaria) and B7 (Abo-Homos) it demonstrated, differential display technique was performed for obtaining more confirmative results and to possibly differentiate between a members of each pair (B3, B5 and B4, B7). Differentiation was possible using a specific primer to the housekeeping gene, 16S rRNA. When differential display analysis with the arbitrary primer P2 was conducted. This was evident as the two fragment of a size of 741 and 1186 bp which were observed with B3 (El-Malaha) were not found with B5 (El-Amria) and the only one fragment of 1199 bp which was shown with B5 was not detectable with B3. Polymorphism reached its maximum when the same primer (P2) was used to analyze the pair of isolates B4 and B7. This was evident when the six fragments seizing 286, 522, 596, 1856, 2094 and 2335 bp which were obtained with B7 were not present with B4.
The sequence of the 16S rRNA gene has been widely used as a molecular clock to estimate relationships among bacteria (phylogeny), but more recently it has also become important as a means to identify an unknown bacterium to the genus or species level (Sacchi et al., 2002). The sequencing of the 16S rRNA and the alignment with sequences present in the GenBank database resulted in the final identification of the studied isolates. The sequencing of 16S rRNA has also successfully been used for identification of B. subtilis, B. anthracis and B. cereus in other studies (Ash et al., 1991; Ash and Collins, 1992; Green et al., 1999; Siefert et al., 2000).
In batch culture, the lag phase is characterized by a negligible increase in the biomass concentration which lasted for a bout 2 h. The exponential phase is characterized by a sharp exponential increase in the biomass concentration, cell mass was increased exponentially over time with a constant specific growth rate 0.3 h-1, the overall biomass yield was 0.45 g cell/g glucose. At the stationary phase, the growth rate was zero (no cell division), these due to the depletion of substrate, oxygen insufficiency, accumulation of inhibitory metabolites such as acetic acid and also due to the beginning of the sporulation process by B. subtilis. Finally during the death phase the cell growth had a negative growth. The growth process is divided into two main stages: vegetative stage and sporulative stage. A B. subtilis cell is in its vegetative stage if it is capable of dividing. On the other hand, a cell is in sporulative stage if the cell stops its division and uses the available energy to form a spore.
Unlike the growth phases, the metabolic stages cannot be identified by a change in the biomass concentration with time. The metabolic stages might, however, be identified by the cell morphology, the cell oxygen consumption and the change in the pH of the medium. Regarding the morphology of a vegetative B. subtilis cell it can be characterized on the basis of cell structure and the absence of a spore. In this respect, during the vegetative stage, the cells consume the substrates and require high amounts of oxygen and several acids such as acetic acid are produced. As a result, the pH decreases in the liquid medium.
Concerning sporulation, the shift from vegetative to sporulation stage occurs when the nutrients are depleted. In this case, the acids produced during the vegetative stage are already oxidized and the cells oxygen demand is very low. Therefore, the pH remains constant.
REFERENCES
- Abel Ghany, A.A. and E.A. Zaki, 2003. DNA sequences of RAPD fragments in the Egyptian cotton Gossypium barbadense. Afr. J. Biotechnol., 2: 129-132.
Direct Link - Asaka, O. and M. Shoda, 1996. Biocontrol of Rhizoctonia solani damping-off of tomato with Bacillus subtilis RB14. Applied Environ. Microbiol., 62: 4081-4085.
Direct Link - Brzostowicz, P.C., K.L. Gibson, S.M. Thomas, M.S. Blasko and P.E. Rouviere, 2000. Simultaneous identification of two cyclohexanone oxidation genes from an environmental Brevibacterium isolate using mRNA differential display. J. Bacteriol., 182: 4241-4248.
Direct Link - Chia, J., Y. Lee, P. Huang and J. Chen, 2001. Identification of stress-responsive genes in Streptococcus mutans by differential display reverse transcription-PCR. Infection Immunity, 69: 2493-2501.
Direct Link - Chin, L.S., S.K. Singh, Q. Wang and S.F. Murray, 2000. Identification of Okadaic-acid-induced genes by mRNA differential display in glioma cells. J. Biomed. Sci., 7: 152-159.
Direct Link - Chitarra, G.S., P. Breeuwer, M.J. Nout, A.C. van Aelst , F.M. Rombouts and T. Abee, 2003. An antifungal compound produced by Bacillus subtilis YM 10-20 inhibits germination of Penicillium roqueforti conidiospores. J. Appl. Microbiol., 94: 159-166.
CrossRefDirect Link - Drake, M.A., C.L. Small, K.D. Spence and B.G. Swanson, 1996. Differentiation of Lactobacillus helveticus strains using molecular typing methods. Food Res. Int., 29: 451-455.
Direct Link - Gaviria, R.A.M. and F.G. Priest, 2003. Molecular typing of Bacillus thuringiensis serovars by RAPD-PCR. Syst. Applied Microbiol., 26: 254-261.
Direct Link - Hilton, A.C., J.G. Banks and C.W. Penn, 1997. Optimization of RAPD for fingerprinting Salmonella. Lett. Applied Microbiol., 24: 243-284.
CrossRefPubMedDirect Link - Istock, C.A., N. Ferguson, N.L. Istock and K.E. Duncan, 2001. Geographical diversity of genomic lineages in Bacillus subtilis (Ehrenberg) Cohn sensu lato. Org. Divers. Evol., 1: 179-191.
CrossRefDirect Link - Levy, H., M. Fisher, N. Ariel, Z. Altboum and D. Kobiler, 2006. Identification of strain specific markers in Bacillus anthracis by random amplification of polymorphic DNA. FEMS Microbiol. Lett., 244: 199-205.
Direct Link - Liang, P. and A.B. Pardee, 1992. Differential display of eukaryotic messenger RNA by means of the polymerase chain reaction. Science, 257: 967-971.
CrossRefPubMedDirect Link - Luna, C.L., R.L.R. Mariano and A.M. Souto-Major, 2002. Production of a biocontrol agent for crucifers black rot disease. Brazilian J. Chem. Eng., 19: 133-140.
Direct Link - Nilsson, J., B. Svensson, K. Ekelund and A. Christiansson, 1998. A RAPD-PCR method for large-scale typing of Bacillus cereus. Lett. Applied Microbiol., 27: 168-172.
Direct Link - Sacchi, C.T., A.M. Whitney, L.W. Mayer, R. Morey and A. Steigerwalt et al., 2002. Sequencing of 16S rRNA gene: A rapid tool for identification of Bacillus anthracis. Emerg. Infect. Dis., 8: 1117-1123.
Direct Link - Sambrook, J., E.F. Fritsch and T.A. Maniatis, 1989. Molecular Cloning: A Laboratory Manual. 2nd Edn., Cold Spring Harbor Laboratory Press, Cold Spring Harbor, New York, USA., ISBN-13: 9780879695774, Pages: 397.
Direct Link - Siefert, J.L., M. Larios-Sanz, L.K. Nakamura, R.A. Slepecky and J.H. Paul et al., 2000. Phylogeny of marine Bacillus isolates from the gulf of Mexico. Curr. Microbiol., 41: 84-88.
Direct Link - Sow, D.M., R.D. Dauphin, D. Roblain, A.T. Guiro and P. Thonart, 2005. Polyphasic identification of a new thermotolerant species of lactic acid bacteria isolated from chicken faeces. Afr. J. Biotechnol., 4: 409-421.
Direct Link - Toure, Y., M. Ongena, P. Jacques, A. Guiro and P. Thonart, 2004. Role of lipopeptides produced by Bacillus subtilis GA1 in the reduction of grey mould disease caused by Botrytis cinerea on apple. J. Applied Microbiol., 96: 1151-1160.
Direct Link - Williams, J.G.K., A.R. Kubelik, K.J. Livak, J.A. Rafalski and S.V. Tingey, 1990. DNA polymorphisms amplified by arbitrary primers are useful as genetic markers. Nucleic Acids Res., 18: 6531-6535.
CrossRefPubMedDirect Link - Wirtz, K.W., 2002. A generic model for changes in microbial kinetic coefficients. J. Biotechnol., 97: 147-162.
Direct Link