
P. Patel
Food Biotechnology Laboratory, Department of Home Science, Sardar Patel University, Vallabh Vidyanagar-388120, Gujarat, India
T. Parekh
Food Biotechnology Laboratory, Department of Home Science, Sardar Patel University, Vallabh Vidyanagar-388120, Gujarat, India
R. Subhash
Food Biotechnology Laboratory, Department of Home Science, Sardar Patel University, Vallabh Vidyanagar-388120, Gujarat, India
Biotechnology
Year: 2008 | Volume: 7 | Issue: 4 | Page No.: 769-774


ABSTRACT
The purpose of this study was to develop a chocolate mousse having probiotic and prebiotic ingredients added and verify the perspectives of the product with regard to potential for consumer health benefits and sensory acceptance. Probiotic and synbiotic chocolate mousse supplemented with Lactobacillus paracasei subsp. paracasei (P) or together with the prebiotic ingredient inulin (S), were prepared, as well as control mousse (C). L. paracasei count and total count were carried out during storage at 4°C for upto 28 days and sensory preferences were also tested. Storage trials showed that viability of the probiotic was retained over 28 days and no significant contaminants were observed. Prebiotic inulin did not showed interference in the viability of L. paracasei. Addition of probiotic and prebiotic ingredients did not affect the sensorial preference of the product.
PDF Abstract XML References Citation
How to cite this article
P. Patel, T. Parekh and R. Subhash, 2008. Development of Probiotic and Synbiotic Chocolate Mousse: A Functional Food. Biotechnology, 7: 769-774.
DOI: 10.3923/biotech.2008.769.774
URL: https://scialert.net/abstract/?doi=biotech.2008.769.774
DOI: 10.3923/biotech.2008.769.774
URL: https://scialert.net/abstract/?doi=biotech.2008.769.774
INTRODUCTION
Production of functional foods is being recognized as the number one global food biotechnology industry as changing trends in population demography, consumer affluence, increased education, life expectancy and improved healthcare give rise to a rapidly emerging diet and health conscious consumer clientele (Belem, 1999; Childs, 1999; Dillard and German, 2000). The term Functional Food was first introduced in Japan in the mid-1980s and refers to processed food containing ingredients that aid specific bodily functions in addition to being nutritious (Swinbanks and O`Brien, 1993).
Probiotics are defined as selected, viable microbial dietary supplements that, when introduced in sufficient quantities, beneficially affect human organism through their effects in the intestinal tract (Zimmer and Gibson, 1998; Sanders, 1998). They may play an important role in helping the body protect itself from infection, especially along the colonized mucosal surfaces of the gastrointestinal tract (Sanders, 2003).
Probiotic bacteria beneficially affect human health by improving the gut microbiota balance and the defenses against pathogens. Additional health benefits attributed to probiotics are the stimulation of the immune system, blood cholesterol reduction, vitamin synthesis, anti-carcinogenesis and anti-bacterial activities (Heenan et al., 2004). Two other important criteria to determine the efficacy and the success of the product containing probiotics are the acceptance of the product by the consumers and the survival of probiotic microorganisms during its production (Heenan et al., 2004). In general, the food industry has applied the recommended level of 106 cfu g-1 at the time of consumption for Lactobacillus acidophilus, bifidobacteria and other probiotic bacteria (Boylston et al., 2004).
A prebiotic can be defined as a not digestible food ingredient that beneficially affects the human body, selectively stimulating the increase and activity of one or a limited group of colon bacteria. This concept involves certain dietary compounds resistant to digestive enzyme hydrolysis and/or that are not absorbed in the superior portion of gastrointestinal tract, including the small bowel. In fact, these compounds need to get to the large bowel, where the greater part of the gut microbiota is located and stimulate the growth of some beneficial microorganisms in the gut (Roberfroid, 2002). Inulin is an oligosaccharide extracted from commonly consumed plants like onions, asparagus root, wheat, banana, Chinese chives, garlic, honey, oat, pine and chicory. It is officially recognized as a natural food ingredient and is classified as a dietary fibre in most European countries (Roberfroid, 1999). The term synbiotic is used when a product contains both probiotic and prebiotic ingredients. The synergism is attained in vivo by the ingestion of lactobacilli on one hand and by the promotion of indigenous bifidobacteria on the other hand. Thus, a product containing inuline or oligofructose and probiotic bifidobacteria or L. paracasei, for example, would fulfil the definition. Synbiotic products have not been intensively studies to date (Bielecka et al., 2002). Roberfroid (2002) suggested that these products can improve the survival of bacteria when they pass into the upper part of the gastrointestinal tract and produce greater effects in the large bowel. It is not known if the individual advantages might be additive or even synergistic (Bielecka et al., 2002).
Aerated dairy desserts have shown a great market potential as a function of consumer behaviour, interested in lighter and healthier relish products. Mousse is an aerated dessert with stabilized foamy structure that, although traditionally home-made, is nowadays produces on an industrial scale and is gaining space in the dessert market. The most popular mousse flavour is chocolate, followed by orange, lemon and strawberry. The industrial production of aerated dairy dessert is delicate, requiring knowledge about the formation and stabilization of foam, the use of functional ingredients.
The present study was carried out to develop a chocolate mousse to which probiotic and prebiotic ingredients were added and to verify the perspectives of the product with regard to potential for consumer health benefits and to sensorial acceptance.
MATERIALS AND METHODS
Procurement of ingredients and chemicals: The present study was conducted at Food Biotechnology Laboratory, Sardar Patel University, Vallabh Vidyanagar during December 2007 to April 2008. The following commercial ingredients were employed for the production of chocolate mousse: Whole milk cream (25% fat, Amul, India), Cocoa powder (Cadbury, India), Chocolate powder (Cadbury, India), Unflavoured gelatin powder (Blue bird, India), emulsifying agent (SUN-BIRD, India), Sugar (Retail shop, Anand, India), Skimmed milk powder (Sagar, Amul, India), Double toned milk (Amul, India), MRS broth (Hi-media). Inulin was supplied by Sigma-Aldrich (Germany).
Bacterial strain and culture condition: Lactobacillus paracasei subsp. paracasei NCDC 022 was obtained from National Collection of Dairy Cultures (NCDC), Karnal, India. The culture was maintained by activating in sterile MRS broth and grown for 24 h at 37°C under aerobic conditions and for long term storage; strain was kept at-20°C in 15% glycerol. Prior to use, strain was activated 4 times in 14% sterilized skim milk.
Preparation and production of chocolate mousse: Three pilot-scale chocolate mousse products, denoted control (C), probiotic (P) and synbiotic (S) were produced. The potentially probiotic microorganism L. paracasei subsp. Paracasei NCDC 22 was added to product P. whereas L. paracasei subsp. Paracasei plus the prebiotic ingredient inulin were added to product S and neither the probiotic nor the prebiotic ingredient were added to product C. Table 1 shows the list of ingredients and amounts used for Control, Probiotic and Prebiotic chocolate mousse production. The procedure for preparation of chocolate mousse was followed according to the method given by Aragon-Alegro et al. (2007). All ingredients, except the emulsifying agent are mixed well. The mixture is heated upto 80-85°C in a water bath. Immediately, the mixture is cooled to 40°C in an ice bath with continuous stirring. To cool the mixture, the emulsifying agent is added and blended with a hand blender at 14°C in an ice bath for incorporation of air. The chocolate mousse was ready to be packaged in covered plastic cup. The packaged mousse was stored at 4°C for up to 28 days. Each lot of chocolate mousse was produced in amounts to obtain 800 g of the final product. Chocolate mousse taken for analysis was the fresh product (day 0) and the stored product after 4, 7, 14, 21 and 28 days of storage. At each sampling day, microbiological analysis and physicochemical analysis was carried out apart from sensory evaluation.
| Table 1: | List of ingredients and amounts used for chocolate mousse production |
 | |
| (Source: Aragon-Alegro et al., 2007) C: control, P: probiotic, S: synbiotic | |
Physico-chemical analysis: The pH values of mousses were determined with a digital pH meter. Titrable acidity was measured according to the method of AOAC (1984) and expressed in terms of mL/100 g.
Microbiological analysis: Microbiological analysis was carried out for all trials of chocolate mousse studied (C, P and S). At each sampling day, 10 g samples were collected aseptically and blended with 90 mL of 0.1% sterile peptone water and submitted to serial dilutions.
Total plate count, coliform count, E. coli count and yeast and mould count was carried out according to Bacteriological Analytical Manual (1998). Nutrient agar media was used for total plate count. Violet Red Bile Agar (VRBA) was used for the enumeration of coliforms and Eosine Methylene Blue (EMB) agar was used for the enumeration of E. coli, whereas enumeration of yeast and moulds were carried out on Potato Dextrose Agar (PDA). After incubation time, the colonies were counted and the results were expressed as colony forming units per gram of product (cfu g-1).
L. paracasei count was carried out according to Aragon-Alegro et al. (2007) on DeMan-Rogosa-Sharpe agar (MRS agar) acidified to pH 5.4 with acetic acid. Anaerobic incubation was carried out at 37°C for 3 days. After this time, the colonies were counted and the results were expressed as colony forming units per gram of product (cfu g-1).
Sensory analysis: Comparison of chocolate mousse samples from products C, P and S was also conducted by means of sensory evaluation, employing a Randomized Complete Block Design, using Preference-Ranking test (Lawless and Heymann, 1999). Sensory evaluation of the mousses was carried out at the Department of Home Science on 0 day, 4th day and 7th day of storage by 6 consumers (panelists) of the faculty staff and students, which were selected based on their interest and chocolate consuming habits. Samples were presented in white plastic cups and the panel was asked to evaluate the three-digit coded samples of the three different trials of mousse(C, P and S all of them prepared on the same day), using a score from 1 (preferred sample) to 3 (least preferred sample), based on over all impression. The samples were divided into six blocks, with three repetitions for each one. This blocking was essential to avoid a tendency to confer lower or higher grades for samples tasted first.
Acceptability of inulin level in the products: This was performed to check the acceptable higher concentrations of inulin in chocolate mousse preparations. Chocolate mousse was prepared with 9, 11, 13 and 15% concentrations of inulin. Acceptable higher concentrations were determined by means of Sensory Evaluation, employing a Hedonic Scale Ranking Test. A 9-point hedonic scale test (1 = extremely dislike, 9 = extremely like) was used to evaluate sensory attributes for color, appearance, flavor, taste and overall acceptance. Sensory Evaluation of the freshly prepared mousses was carried out at the Department of Home Science, at 0 day by 6 consumers (panelists) of the faculty staff and students.
The physiochemical and microbiological analysis was carried out as previously mentioned in the study, i.e., at 0 day and on the 7th day as a part of the storage study.
Statistical analysis: Data was subjected to Analysis of Variance (ANOVA) using Statistical SPSS for Windows 10.0. Differences between variables were tested for significance by using a one ways analysis of variance procedure, Duncan, using a level of significance p≤0.05.
RESULTS AND DISCUSSION
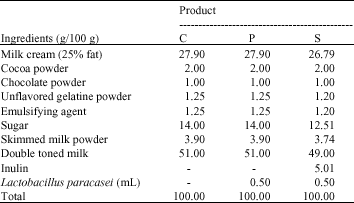
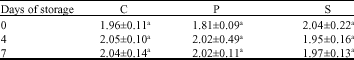
Table 2 shows the mean pH values of the control and experimental chocolate mousse during storage. pH value of freshly prepared chocolate mousse was found to be 6.57 for the control (C) and the two experimental products. Storage period was 0-28 days at refrigerator temperature. During the storage period there were no significant difference between control and experimental products of chocolate mousse. pH values showed a fall from 6.57 on 0 day to 6.40-6.43 on the 14th day considering all the three products. No significant differences (p≤0.05) were observed.
From the 14th day onwards, the control product showed a lesser fall in pH compared to the two experimental products both of which registered a greater fall. On the 28th day, control showed a slightly higher pH compared to the probiotic and synbiotic products both of which showed nearly similar values. Since both the experimental products had probiotic microorganisms L. paracasei and their activity has led to a drop in the pH which is not seen in the control product. On 0, 4th and 7th day, between the three products no significant difference (p≤0.05) was observed.
According to Beresford et al. (2001), the optimal pH for the growth of the most common bacteria is near to neutral and this growth is suppressed in pH values below 5.0. Thus the decrease in pH values in all the three products was not sufficient to impair the survival of probiotic micro-organisms present in the chocolate mousse.
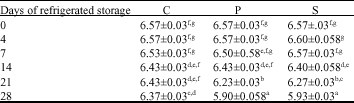
Table 3 shows the mean titrable acidity values evaluated during the storage of the control and experimental chocolate mousse products. Titrable acidity showed a value of 0.27 on 0 day for all the three products. The titrable acidity did not show any change in value for any of the three products until the 7th day, indicating that the chocolate mousse, whether control or experimental, retained it`s freshness for a minimum period of seven days without any difficulty. Thus no significant differences (p≤0.05) were observed between the three products or for each product as days of storage increased up to the 7th day.
Comparing the titrable acidity from the 14th day onwards, there was a significant rise in titrable acidity in each product as the days of storage increased. Similarly the two experimental products showed slightly higher acidity compared to the control from the 14th day onwards. On the 28th day again both experimental products showed significantly higher (p≤0.05) titrable acidity compared to control. It is seen that titratable acidity of the products increased during 28 days of the storage period, probably due to the presence of L. paracasei (Aragon-Alegro et al., 2007).
| Table 2: | pH values of control, probiotic and synbiotic chocolate mousse products during 28 days of storage period |
 | |
Mean of three trials±SEM. Values carrying the same superscript are not different from each other. * indicates significant difference at p≤0.05, C: Control; P: Probiotic; S: Synbiotic | |
| Table 3: | Titratable acidity of control, probiotic and synbiotic chocolate mousse products during 28 days of storage |
 | |
| Mean of three trials±SEM; Values carrying the same superscript are not different from each other; * Indicates significant difference at p≤0.05; C: Control; P: Probiotic; S: Synbiotic | |
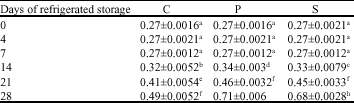
Table 4 shows the mean values of total count and viability of L. paracasei in the control and two experi-mental products. For total count, there was no growth on 0 day for control, while the experimental products showed values of 5.05x10⁷ and 4.95x10⁷ cfu g-1, respectively for P and S, on 0 day. Control product showed zero count of bacteria until the 7th day. The total count did not show much change in values for both the experimental products until the 7th day, indicating that the experimental chocolate mousse retained it`s freshness for a minimum period of seven days without any difficulty, thus no significant differences (p≤0.05) were observed between the two experimental products as days of storage increased up to the 7th day. Comparing the total count from the 14th day onwards, there was a significant rise in total count as the days of storage increased for both the experimental products, although the counts did not show any significant difference on the 14th day. Significant differences were observed between the two experimental products, the inulin added synbiotic product showing higher values from the 21st day onwards, indicating the beneficial synbiotic effect from the 21st day onwards.
Meanwhile, from the 14th day onwards the control also showed the appearance of bacteria, as per the total count results. The control values were lower than the two experimental products, on the 14th, 21st and 28th day, showing significant differences for the 21st day and 28th day.
| Table 4: | Microbiological counts of Total count and L. paracasei of control and experimental chocolate mousse products |
 | |
| Mean of three trials±SEM; Values carrying the same superscript are not different from each other; * Indicates significant difference at p≤0.05; C: Control; P: Probiotic; S: Synbiotic; results expressed in cfu/g | |
L. paracasei count also showed a similar trend as that for total count. The control product showed zero count of L. paracasei as expected from 0 day to the 28th day. In the two experimental products the counts showed an increasing trend as the days of storage progressed. In the probiotic product, a significant increase in the count was observed on the 28th day compared to the previous days of storage. In the synbiotic product, the L. paracasei count was slightly low on 0 day which continued to show an increase (none significantly) as the day of storage increased. A significant increase was noted from the 21st day onwards.
Comparing the counts in both the experimental products it is seen that the synbiotic product showed higher counts indicating that inulin promoted an increase in the count of L. paracasei. Between the two products a significant difference (p≤0.05) was observed on the 21st and 28th day. Administration of inulin to human volunteers on a defined diet has been reported to result in increased numbers of probiotic bifidobacteria and reduced bacteroides, clostridial and fusobacterial populations in feces (Gibson et al., 1995; Kleesen et al., 1997).
According to Boylston et al. (2004), the recommended levels of probiotic microorganisms in food at the time of consumption is 106 cfu g-1, to have a beneficial effect on consumer health. This criterion is fulfilled in the chocolate mousse developed in the present study as a potential vehicle for L. paracasei.
Aragon-Alegro et al. (2007) monitored chocolate mousse products similar to the present study that is control, probiotic and synbiotic products for 28 days to assess the population of the probiotic L. paracasei as well as contaminants, during storage at 4°C and reported that the probiotic was still viable after 28 days, maintaining population levels about seven log cfu per gram and reported that L. paracasei increased slightly in probiotic chocolate mousses during 21 days of storage. Similar result was found in our study. Total count and L. paracasei count increased in the probiotic as well as in the synbiotic chocolate mousse product during 14 days of storage. Vinderola et al. (2002) evaluated the suitability of Argeatinean fresco cheese as a food carrier for probiotic cultures. Their study demonstrated that this cheese may used as a vehicle for probiotic bacteria. The cultures bifidobacteria, L. acidophilus and L. casei survived satisfactorily until the 60th day. In the present study, viability of L. paracasei increased from 3.9x10⁷ to 1.6x10⁹ cfu g-1 on the 28th day in the probiotic chocolate mousse during 21 days of storage at refrigerator temperature.
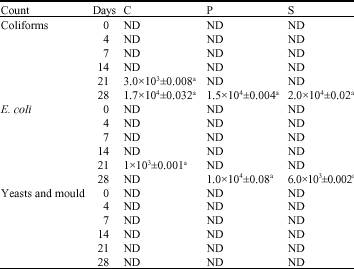
Table 5 shows the population of the contaminants namely coliforms, E. coli and Yeast and Mold during the storage period for the different products of chocolate mousse. Coliforms and E. coli were detected only after 21 days product C, values were 3x10³ and 1x10³ cfu g-1, respectively.
Upto 21 days of storage both coliform and E. coli were not detected in the experimental products P and S. On the 28th day of storage for coliforms and E. coli in product P; values were 1.5x10⁴ and 1x10⁴ cfu g-1, respectively; and 2.0x10⁴ and 6x10³ cfu g-1 for coliform and E. coli for respectively, for product S. Yeasts and mold were undetected throughout the storage period for all the three products.
Coliforms and E. coli count for all the three products indicates that the product has been prepared with high quality raw ingredients and that almost care has been taken during the preparation of mousse. Further all the three products show a high shelf life upto 28 days of storage.
Aragon-Alegro et al. (2007) noted that the growth of yeasts and moulds might limit the shelf life of the developed product chocolate mousse. In their study growth was detected after 14 days for both the control and probiotic mousses. However, growth for the synbiotic mousse was not observed until 21 days of storage in their research, whereas in our study the results showed that coliform and E. coli were not detected until 28 days of storage in both the experimental products, while Yeast and Mold were not detected at all during the storage study.
Table 6 shows the mean sensory evaluation scores evaluated for the fresh and stored, control and experimental chocolate mousse samples. Sensory scores indicated no significant differences in preference between fresh samples (0 day) of mousse even though the synbiotic product was considered the most preferred product of chocolate mousse on the basis of a slightly higher score. The scores on the storage of the products indicated a decline for both control and probiotic products and an increase in acceptability for the synbiotic product, although no significant differences (p≤0.05) were observed. The results indicate that compared to the control and the probiotic product, synbiotic product showed higher acceptability as days of storage increased.
| Table 5: | Microbiological counts of contaminant population of control and experimental chocolate mousse products |
 | |
| Mean of three trials±SEM; Values carrying the same superscript are not different from each other; * Indicates significant difference at p≤0.05; C: Control; P: Probiotic; S: Synbiotic; results expressed in cfu g-1 | |
| Table 6: | Sensory evaluation of fresh and stored control and experimental chocolate mousse products |
 | |
| Mean of six panelists±SEM; Scale of preference ranged from 1 to 3 (1-most liked; 2-moderately liked; 3-least liked); Values carrying the same superscript are not different from each other; *Indicates no significant difference; C-control; P-probiotic; S-synbiotic | |
| Table 7: | Sensory evaluation synbiotic chocolate mousse products prepared incorporating inulin at higher levels |
 | |
| Mean of six panelists±SEM; Scale of preference ranged from 1 to 9, (1-like extremely to 9 dislike extremely); Values carrying the same superscript are not significantly different from each other; * Indicates significant difference at p≤0.05 | |
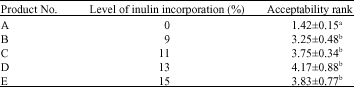
Acceptability of inulin level: Table 7 shows the mean sensory scores for freshly prepared synbiotic chocolate mousse incorporating inulin at higher levels. The results showed no significant differences between the four experimental products namely B, C, D and E which showed a range from 3.25 to 4.17. Product B (9% inulin) was more acceptable with a mean score of 3.25 than the other synbioitc products but product C (11% inulin) also showed nearer scores i.e., 3.75. Product A product without inulin showed significantly higher acceptability. Again, increasing the inulin levels to 13% decreased the acceptability.
CONCLUSION
The present study showed successful incorporation of L. paracasei and inulin in chocolate mousse. Inulin did not interfere with the viability of L. paracasei. The present investigation can be further expanded by using different probiotic and prebiotic sources like probiotic strains L. burgaricus, L. casei, L. acidophilus or bifidobacterim and for prebiotic source soya-oligofructosaccharide, galacto-oligosaccharides, xylo-oligosaccharides may be used.
REFERENCES
- Aragon-Alegro, L.C., J.H.A. Alegro, H.R. Cardarelli, M.C. Chiu and S.M.I. Saad, 2007. Potentially probiotic and synbiotic chocolate mousse. LWT-Food Sci. Technol., 40: 669-675.
CrossRef - Belem, M.A.F., 1999. Application of biotechnology in the product development of nutraceuticals in Canada. Trends Food Sci. Technol., 10: 101-106.
CrossRef - Beresford, T.P., N.A. Fitzsimons, N.L. Brennan and T.M. Cogan, 2001. Recent advances in cheese microbiology. Int. Dairy J., 11: 259-274.
CrossRefDirect Link - Bielecka, M., E. Biedrzycka and A. Majkowska, 2002. Selection of probiotics and prebiotics for synbiotics and confirmation of their in vivo effectiveness. Food Res. Int., 35: 125-131.
CrossRefDirect Link - Boylston, T.D., C.G. Vinderola, H.B. Ghoddusi and J.A. Reinheimer, 2004. Incorporation of bifidobacteria into cheeses: Challenges and rewards. Int. Dairy J., 14: 375-387.
CrossRefDirect Link - Childs, N.M., 1999. Nutraceutical industry trends. J. Nutr. Funct. Med. Foods, 2: 73-85.
CrossRefDirect Link - Dillard, C.J. and J.B. German, 2000. Phytochemicals: Nutraceuticals and human health. J. Sci. Food Agric., 80: 1744-1756.
CrossRefDirect Link - Gibson, G.R., E. Beatty, X. Wang and J.H. Cummings, 1995. Selective stimulation of bifidobacteria in the human colon by oligofructose and inulin. Gastroenteology, 108: 975-982.
PubMedDirect Link - Heenan, C.M., M.C. Adams, R.W. Hosken and G.H. Fleet, 2004. Survival and sensory acceptability of probiotic microorganisms in a nonfermented frozen vegetarian dessert. LWT-Food Sci. Technol., 37: 461-466.
CrossRefDirect Link - Kleesen, B., B. Sykura, H.J. Zunft and M. Blaut, 1997. Effects of inulin and lactose on fecal microflora, microbial activity and bowel habit in elderly constipated persons. Am. J. Clin. Nutr., 65: 1397-1402.
Direct Link - Roberfroid, M.B., 1999. Concepts in functional foods: The case of inulin and Oligofructose. J. Nutr., 129: 1398S-1401S.
CrossRefPubMedDirect Link - Sanders, M.E., 2003. Probiotics: Considerations for human health. Nutr. Rev., 61: 91-99.
CrossRefPubMedDirect Link - Sanders, M.E., 1998. Overview of functional foods: Emphasis on probiotic bacteria. Int. Dairy J., 8: 341-347.
CrossRef - Swinbanks, D. and J. O’Brien, 1993. Japan explores the boundary between food and medicine. Nature, 364: 180-180.
CrossRef - Vinderola, C.G., G.A. Costa, S. Regenhardt and J.A. Reinheimer, 2002. Influence of compounds associated with fermented dairy products on the growth of lactic acid starter and probiotic bacteria. Int. Dairy J., 12: 579-589.
CrossRef - Zimmer, C.J. and G.R. Gibson, 1998. An overview of probiotics, prebiotics and synbiotics in the functional food concept: Perspectives and future strategies. Int. Dairy J., 8: 473-479.
CrossRefDirect Link