
Dina Maizana
School of Electrical System Engineering, Universiti Malaysia Perlis (UniMAP), P.O. Box 77, d/a Pejabat Pos Besar, 01007 Kangar Perlis, Malaysia
Asian Journal of Scientific Research
Year: 2013 | Volume: 6 | Issue: 1 | Page No.: 122-128


ABSTRACT
The study of eddy current loss has done much research and this research is to study the influence of eddy current which cause higher energy loss at higher frequencies of magnetization. This paper is about analyses of eddy current loss in 100 kVA 3 phase distribution transformer assembled with the mix 60°-0° T-joint and mitred lap corner joint with stagger yoke of 5 mm. The loss has been measured using no load test with variable frequency. The eddy current loss rises to be 39.1% when the transformer core is energized at flux density of 1.5 T and frequency of 55 Hz. increase of the frequency will cause the increase of power loss in the transformer core. It caused not all the flux flowing into the middle limb or other limb at difference instant in time of transformer core because there is still flux left in the area of butt-joint and the core loss that produced at the frequency more than 50 Hz will known as classical eddy current loss.
PDF Abstract XML References Citation
Received: April 02, 2012;
Accepted: August 07, 2012;
Published: October 06, 2012
How to cite this article
Dina Maizana, 2013. Analyze Eddy Current Loss in the Three Phase 100 kVA Transformer Core with the Mix 60°-0° T-joint Core. Asian Journal of Scientific Research, 6: 122-128.
DOI: 10.3923/ajsr.2013.122.128
URL: https://scialert.net/abstract/?doi=ajsr.2013.122.128
DOI: 10.3923/ajsr.2013.122.128
URL: https://scialert.net/abstract/?doi=ajsr.2013.122.128
INTRODUCTION
Hysteresis and eddy current losses include the no-load loss (Olivares-Galvan et al., 2010). The influences of eddy currents cause higher energy loss at higher frequencies of magnetisation which is visible in the increased width of the B-H loop. The eddy currents contribution to the power loss can be calculated as follow:
| (1) |
where, k is constant which is depend on the material, Bpeak is peak flux density [T], f is frequency, [Hz].
As it can be seen from Eq. 1 the eddy current component of power loss is proportional to the frequency supply. Therefore, the magnetic core of transformer has the power loss and reaches high values at higher frequencies (Leite et al., 2012). Investigation even with the use of a transformer core model of ferromagnetic material shows the core loss increased with increasing frequency (Chandrasena et al., 2006).
Hysteresis loss cannot be as easily estimated as the eddy current loss but at very low magnetising frequency the eddy currents become negligible and only the hysteresis component is present. This allows using a method of separating the power loss into eddy current and hysteresis component which is thought to be linearly, is one on frequency as shown in Fig. 1 (Zurek, 2005).
However, as it is shown in Fig. 1, the calculated eddy current loss added to the hysteresis loss obtained by low frequency measurements does not result in the total measured power loss.
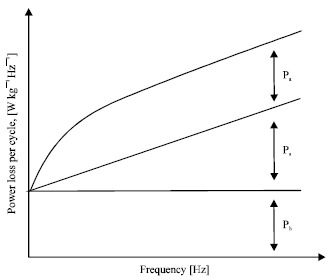 | |
| Fig. 1: | The concept of separating the power loss into hysteresis and eddy currents components, Ph: Hysteresis loss, Pe: Eddy current loss, Pa: Anomalous loss (excess loss), (Zurek, 2005) |
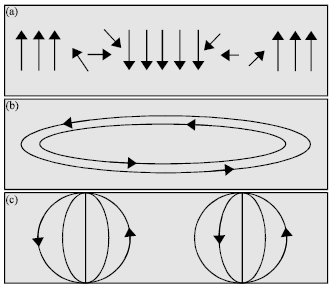 | |
| Fig. 2(a-c): | Summary of core loss mechanism, (a) Hysteresis losses, (b) Classical eddy current losses and (c) Excess losses (Mthombeni, 2006) |
The difference has been named as anomalous loss or excess loss. Therefore, the equation for total power loss can be written as (Zurek, 2005):
| (2) |
where, Ptot is total power loss, Ph is hysteresis loss, Pe is eddy current loss, Pa is anomalous loss.
Eddy current loss in the transformer can also be influenced by the input signal (Mayuri et al., 2010; Liu et al., 2008; Yao et al., 2007). In which the eddy current loss to the input through the PWM inverter is 1.196 times larger than the eddy current losses with sinusoidal supply (Mayuri et al., 2010). While in the classical eddy current loss in the frequency of 50, 100 Hz and induction 1.3 and 1.5 T obtained eddy current loss reduction component ranges 40% in the low-frequency magnetization (Yao et al., 2007).
According to Mthombeni (2006) as shown in Fig. 2 summarizes the three core loss mechanism. Domain walls are shown moving towards lamination edge, at speed v, the applied field intensity is coming out of the page and the middle domain is growing. For classical eddy current models overestimate losses at higher frequency.
Eddy currents are minimized in transformer cores by using thin laminations of electrical steel which reduces associated classical eddy current losses which in turn are strongly dependent on the steel thickness. In a perfectly assembled core, the eddy current paths are restricted to individual laminations (Mazurek et al., 2010). Effect of the plate thickness on eddy current loss also can investigated by EC sensor coil method (Le Bhan, 2003).
Grain oriented steel sheet used in transformer cores is covered on both sides with a thin inorganic coating, applied onto the glass film layer that forms during annealing. A number of standard test procedures are available to assure the quality of this surface insulation (Schulz et al., 2010).
The behaviour of this investigation was to analyze the eddy current loss of the transformer core built from electrical steel (M5) with 3% silicon iron assembled with the mix 60°-0° T-joint and mitred lap corner joint with stagger yoke of 5 mm by using no load test with sinusoidal input signal.
MATERIALS AND METHODS
The main apparatus consists of a model cores three-phase 100 kVA transformer assembled with three limbs core with T-joint cutting angle the mix 60°-0° assembled from CRGO (M5 grades) 3% Si-Fe material. The core has 550x580 mm with the limbs and yokes 100 mm wide as shown in Fig. 3. The experimental cores assembled with the mix 60°-0° T-joint, mitred overlap corner joints with staggered yoke and overlap length is 5 mm as shown in Fig. 4 and assembled from 0.3 mm thick laminations of M5 grain-oriented silicon iron (CRGO). Associated instruments are used to measure fundamental and third content of the power loss (Maizana, 2011).
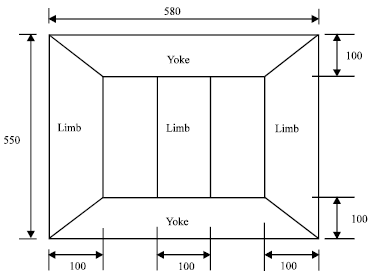 | |
| Fig. 3: | Dimension (mm) of 100 kVA transformer model |
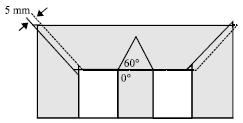 | |
| Fig. 4: | Transformer core type with the mix 60°-0° T-joint |
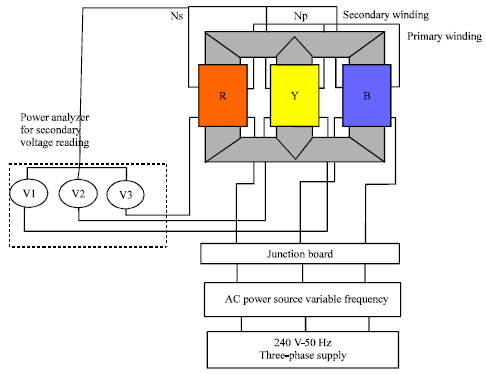 | |
| Fig. 5: | Diagrams of the methods that used to measure the eddy current losses, Ns: Secondary winding turns, Np: Primary winding turns, R: Red colour cable, R: Yellow colour cable, B: Blue colour cable and V1, V2, V3: Voltmeter |
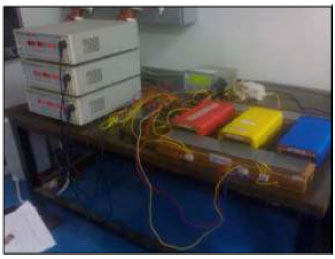 | |
| Fig. 6: | The actual circuit |
The testing process is done by using the no-load test frame. The no-load test frame consisting of three windings for each three phase core is designed in order not only to avoid introducing stress to the laminations but also to keep the magnetism exactly constant in all limbs of the cores. Each winding only extends along 85% on each limb to enable the stagger length of the three phase core to be varied. An extra softwood base 200 mm high is used to raise the overall height of the core, to minimize the effect of the stray flux on the localized measurements. The core could be energized 1-1.8 T at 50 Hz with less than 1.5% third harmonic distortion and also with variable frequency at 1.5 T and the power loss is measured with repeatability better than ±1% using a three phase power analyzer as shown in Fig. 5 and the actual circuit is shown in Fig. 6.
RESULTS AND DISCUSSION
From the measurement results obtained some data such as the loss of the core for each different frequency. Data presented in graph form such the following shows that picture. Signal input to this study similar to that used in the study by Mayuri et al. (2010).
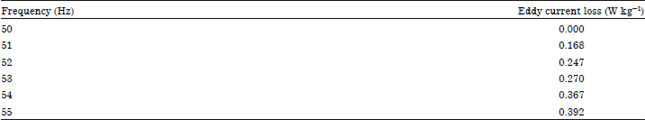
Figure 7 shows the variation of overall power loss with flux density in the three phase cores. The core with adjusted at frequency of 50 Hz has lowest loss over the complete range of flux density. This situation also applies to the investigation conducted by the Yao et al. (2007). At this frequency, the loss that occurs in the transformer core is assumed as hysteresis loss only. The result of this investigation shows the core loss is 1.508 W kg-1. Figure 8 is shown the variation of power loss with frequency in the three phase core. The graph shows that the losses will increases with increases of the frequency. The loss that produces in this investigation is classical eddy current. As shown in concept by Zurek (2005). The eddy current loss is rise to be 39.1% at frequency of 55 Hz, flux density of 1.5 T. The variation of eddy current loss that obtains from measurement as indicated in Table 1.
| Table 1: | Eddy current losses refer frequency |
 | |
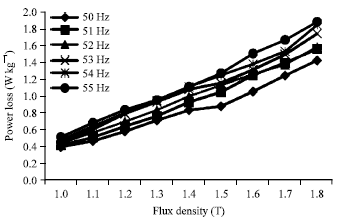 | |
| Fig. 7: | The variation of overall power loss with flux density at different frequencies |
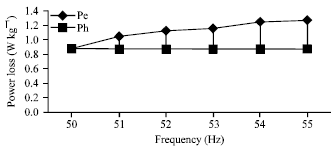 | |
| Fig. 8: | The variation of hysteresis loss (Ph) and eddy current loss (Pe) with frequencies at 1.5 T flux density |
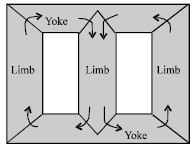 | |
| Fig. 9: | The flux flow in transformer core |
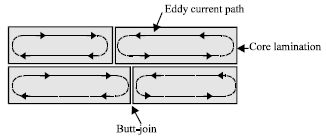 | |
| Fig. 10: | The flux flow in core lamination |
Where frequency supply increases more than 50 Hz, these will makes eddy current loss increase and at the same time as showed in Eq. 2, the flows of flux through the lamination plate also increase as showed in Fig. 8. During the investigation, there is a lot of thing regarded to the eddy current losses can be explain clearly. The results obtained show the variation of the value is dependent on the variable flux density and frequency respectively as showed in Eq. 1. For example, the flow of the flux at the joint and what happen to the movement of flux when the value of flux density and frequency increased. Since there are air gap among the joint, the movement of flux stuck on the joint and this will makes the flux flows to the other lamination. In this condition not all the flux flowing towards into the middle limb or other limb at difference instant in time of transformer core because there is still flux left in the area of butt-joint as showed in Fig. 9. The flux will be circulated in the area as showed in Fig. 10. The circulating flux then will present hot spot on the joint and it is known as eddy current. These phenomena occurred due to the laminate as described by Mthombeni (2006) and Mazurek et al. (2010).
CONCLUSION
From the result of this investigation is found that the smallest power loss of transformer core at the core when adjusted in frequency of 50 Hz which are the rotational fluxes make large contributions to the total power loss in three phase transformer core.
With increase of the frequency will cause the increase of power loss in the transformer core. It caused not all the flux flowing towards into the middle limb or other limb at difference instant in time of transformer core because there is still flux left in the area of butt-joint and the core loss that produced at the frequency more than 50 Hz will know as classical eddy current loss.
REFERENCES
- Olivares-Galvan, J.C., R. Escarela-Perez, F. De Leon, E. Campero-Littlewood and C. Aviles Cruz, 2010. Separation of core losses in distribution transformers using experimental methods. Can. J. Electr. Comput. Eng., 35: 33-39.
CrossRef - Mazurek, R., P. Marketos, A. Moses and J.N. Vincent, 2010. Effect of artificial burrs on the total power loss of a three-phase transformer core. IEEE Trans. Magn., 46: 638-641.
CrossRef - Schulz, C.A., D. Roger, S. Duchesne and J.N. Vincent, 2010. Experimental characterization of interlamination shorts in transformer cores. IEEE Trans. Magn., 46: 614-617.
CrossRef - Le Bhan, Y., 2003. Study on the transformer equivalent circuit of eddy current nondestructive evaluation. NDT&E Int., 36: 297-302.
CrossRef - Chandrasena, W., P.G. McLaren, U.D. Annakkage, R.P. Jayasinghe, D. Muthumuni and E. Dirks, 2006. Simulation of hysteresis and eddy current effects in a power transformer. Electr. Power Syst. Res., 76: 634-641.
CrossRef - Mayuri, R., N.R. Sinnou and K. Ilango, 2010. Eddy current loss modelling in transformer iron losses operated by PWM inverter. Proceedings of the Joint International Conference on Power Electronics, Drives and Energy Systems, December 20-23, 2010, New Delhi, India, pp: 1-5.
CrossRef - Liu, R., C.C. Mi and D.W. Gao, 2008. Modeling of Eddy-current loss of electrical machines and transformers operated by pulsewidth-modulated inverters. IEEE Trans. Magn., 44: 2021-2028.
CrossRef - Yao, X.G., A.J. Moses, J. Sagarduy and F.J. Anayi, 2007. Influence of switching frequency on Eddy-current losses in a three-phase, three-limb transformer core subjected to PWM voltage excitation. Proceedings of the International Conference on Power Engineering, Energy and Electrical Drives, April 12-14, 2007, Setubal, Portugal, pp: 324-329.
CrossRef