
S. Dinesh
Science and Technology Research Institute for Defence, KD Malaya Pangkalan TLDM, 32100 Lumut, Perak, Malaysia
Asian Journal of Scientific Research
Year: 2008 | Volume: 1 | Issue: 4 | Page No.: 310-323


ABSTRACT
The characterization of three important hydrological features, drainage networks, ridge networks and watersheds, is essential in the study of the geomorphological organization of a given terrain. In this study, mathematical thinning based algorithms to extract these three hydrological features from Digital Elevation Models (DEMs) are developed. First, the fundamental mathematical morphological operators, in particular morphological thinning based operators, are discussed. Drainage networks, ridge networks and watersheds are extracted using skeletonization by morphological thinning, exoskeletonization by morphological thinning and skeletonization by influence zone, respectively. The effectiveness of the proposed algorithms is tested by implementing them on a simulated DEM and the photogrammetrically generated DEM of Lake Mary. The proposed algorithms are able to operate effectively on flat areas in DEMs and produce complete and connected outputs. The accuracy of the extracted hydrological features is validated by gauging their conformity with Hack`s law. A log-log plot of the length of the longest stream in each extracted catchment against the corresponding catchment area is drawn. A power law relationship is observed between the two parameters. This power law relationship has a computed scaling exponent of 0.73, which is slightly higher than the standard value of 0.60 provided by Hack`s law. This deviation indicates that raw extraction of hydrological features from DEMs is not sufficient to produce highly accurate hydrological features due to errors in DEMs and the results obtained need to be complemented with data from other GIS data captures, such as ground survey maps and Landsat Thematic Mapper images.
PDF Abstract XML References Citation
How to cite this article
S. Dinesh, 2008. Extraction of Hydrological Features from Digital Elevation Models Using Morphological Thinning
. Asian Journal of Scientific Research, 1: 310-323.
DOI: 10.3923/ajsr.2008.310.323
URL: https://scialert.net/abstract/?doi=ajsr.2008.310.323
DOI: 10.3923/ajsr.2008.310.323
URL: https://scialert.net/abstract/?doi=ajsr.2008.310.323
INTRODUCTION
A Digital Elevation Model (DEM) is a set of points defined in a three-dimensional Cartesian space (X, Y, Z) that approximates a real surface. The X-and Y-axes may be expressed as geographic coordinates (i.e., longitude and latitude), whereas the Z-axis represents the altitude above sea level. It is a digital file consisting of the terrain elevations for ground positions at regularly spaced horizontal intervals. DEMs can be generated directly through photogrammetric processing of stereo-photos or satellite imagery such as stereoscopic SPOT images, or indirectly from the interpolation of scattered point elevation data, of contour lines, or of Triangular Irregular Networks (TINs). DEMs are essential for many aspects of terrain and environmental modelling because of their simple data structure and widespread availability and they lend themselves to many GIS processes and operations (Goodchild and Kemp, 1990; USGS, 1997; Li et al., 2005).
Three important hydrological features that can be extracted from DEMs are drainage networks, ridge networks and watersheds. The characterization of these three features is essential in the study of the geomorphologic organization of a given terrain.
The drainage network for a section of a terrain is the interconnected pattern of dry gullies formed by water erosion along with the main rivers and streams that always contain water. It can be defined as all the channels in which water would naturally flow or collect if water were poured on the terrain from a giant pitcher (Monkhouse, 1965; Seemuller, 1989; Rodríguez-Iturbe and Rinaldo, 1997; Subramanya, 2006). As drainage networks represent a fundamental concept in earth science, drainage network extraction, the science of computing the flows of water over a given landscape (Curkendall et al., 2003), has received growing attention from earth scientists and terrain analysts.
As the drainage networks flow, they perform the triple function of erosion, transport and deposition and in doing so, they modify the surface features of their catchments. They wear away the surface of the land, eroding valleys with distinctive features and leaving residual hills and ridges or interfluves between them (Monkhouse, 1965; Schumm, 1977; Dunne, 1978; Rodríguez-Iturbe and Rinaldo, 1997). Ridges are parts of the original landmass that have been eroded the least and often correspond with watersheds, forming the boundaries of drainage basins (Mark, 1979, 1981, 1988).
A catchment is the topographic area from which all water runoffs finally reach one single given point, known as the pit. Watersheds refer to the topographic barriers that divide catchments from each other (Monkhouse, 1965; Band, 1986; Rodríguez-Iturbe and Rinaldo, 1997; Subramanya, 2006). Watersheds play an important role in hydrological modelling and many hydrogeological processes, such as soil erosion, mass movements, sediment transport and land cover changes, are strongly linked to this spatial reference unit.
A number of algorithms have been developed to perform the automated extraction hydrological features from DEMs. Extensive reviews of these algorithms are provided in Douglas (1986), Moore et al. (1991), Tribe (1992), Bertolo (2000) and Pike (2002). These algorithms can be classified into two categories; local morphology based and flow directional based.
In the local morphology approach, points belonging to hydrological features are defined from local morphologies. For example, drainage pixels are considered as pixels that have a concave curvature coefficient that is higher than a given threshold, while ridge and watershed pixels are considered as pixels that have a convex curvature coefficient that is higher than a given threshold (Johnston and Rosenfeld, 1975; Peucker and Douglas, 1975; Torikawa and Fukumara, 1978; Band, 1986; Soille and Ansoult, 1990; Vincent and Soille, 1991; Meisels et al., 1995; Sagar et al., 2000, 2003; Tay et al., 2005). The disadvantage of this approach is there that is no absolute threshold to discriminate hydrological pixels from other pixels, resulting in the extracted hydrological features being disconnected. Significant postprocessing steps need to be taken to connect the extracted features and to remove irrelevant pixels.
In the flow directional approach, a flow of water is simulated over the topographic surface. It is assumed that channels form where the overland flow carrying capacity is sufficiently large. The thresholding of the contributing drainage area (area of the terrain whose corresponding grid nodes have a downstream going through the considered point) is used as the basis to perform the identification of hydrological features (Mark, 1983, 1984; O`Callaghan and Mark, 1984; Marks et al., 1984; Jenson and Domingue, 1988; Fairfield and Leymarie, 1991; Freeman, 1991; Wichel et al., 1992; Costa-Cabral and Burges, 1994; Soille and Gratin, 1994; Tarboton, 1997; Soille et al., 2003; Colombo et al., 2007). The disadvantage of this approach is that it is unable to operate effectively on flat areas (areas containing pixels of equal elevation) in DEMs, where flow routing is unable to occur. A number of drainage enforcement algorithms have been developed to determine flow direction in flat areas of DEMs (Jenson and Domingue, 1988; Hutchinson, 1989; Tribe, 1992; Soille and Gratin, 1994; Saunders and Maidment, 1995; Garbrecht and Martz, 1997; Martz and Garbrecht, 1998; Mackay and Band, 1998; Turcotte et al., 2001; Soille et al., 2003). However, drainage enforcement is a computationally expensive operation that can cause the formation of artifacts such as double streams and meanders (Soille et al., 2003).
In this study, mathematical morphological based algorithms to extract the drainage networks, ridge networks and watersheds from DEMs are proposed. The effectiveness of the proposed algorithms is tested by implementing them on a simulated DEM and the photogrammetrically generated DEM of Lake Mary. The accuracy of the extracted hydrological features is validated by gauging their conformity with Hack`s law.
MATHEMATICAL MORPHOLOGY
Mathematical morphology is a branch if image processing that deals with the extraction of image components that are useful for representational and descriptional purposes. Mathematical morphology has a well developed mathematical structure that is based on set theoretic concepts. The effects of the basic morphological operations can be given simple and intuitive interpretations using geometric terms of shape, size and location. Mathematical morphology is well suited to the processing of elevation data because in morphology, any image is viewed as a topographic surface, the gray level of a pixel standing for its elevation (Soille and Ansoult, 1990). The fundamental mathematical morphological operators are explained in Matheron (1975), Serra (1982) and Soille (2003). Morphological operators generally require two inputs; the input image A, which can be in binary or grayscale form and the kernel B, which is used to determine the precise effect of the operator.
Dilation sets the pixel values within the kernel to the maximum value of the pixel neighbourhood. The dilation operation is expressed as:
A | (1) |
Erosion sets the pixels values within the kernel to the minimum value of the kernel. Erosion is the dual operator of dilation:
AӨB)⊂ (Ac | (2) |
An opening (Eq. 3) is defined as an erosion followed by a dilation using the same kernel for both operations. Grayscale opening is used to darken small bright areas and to reduce sharp peaks in images. A closing (Eq. 4) is defined as a dilation followed by an erosion using the same kernel for both operations. Grayscale closing is used to brighten small dark areas and to fill valleys in images
A°B= (AӨB) | (3) |
A •B = (A | (4) |
Morphological reconstruction allows for the isolation of certain features within an image based on the manipulation of a mask image, X and a marker image, Y. It is founded on the concept of geodesic transformations, where dilations or erosion of a marker image are performed until stability is achieved (represented by a mask image) (Vincent, 1993).
The geodesic dilation δG used in the reconstruction process is performed through iteration of elementary geodesic dilations δ(1) until stability is achieved.
δG(Y) = δ(1)(Y) o δ`(1) (Y) o δ(1) (Y)...until stability | (5) |
The elementary dilation process is performed using standard dilation of size one followed by an intersection.
δ(1)(Y) = Y | (6) |
The operation in equation 6 is used for elementary dilation in binary reconstruction. In grayscale reconstruction, the intersection in the equation is replaced with a pointwise minimum (Vincent, 1993).
The hit-miss operator is used to perform shape detection. The hit-miss operation is expressed as:
A | (7) |
| Where: | ||
B | = | (B1, B2) |
B1 | = | C |
B2 | = | (W-C) |
B1 is the set formed from elements of B associated with an object. B2 is the set of elements of S associated with the background. C is the shape to be detected surrounded by a small window, W (Serra, 1982).
Thinning is used to remove selected foreground pixels from binary images. Thinning is implemented by first using the hit-miss operator to detect the regions that are to be extracted. Those regions are then subtracted from the original image (Jang and Chin, 1990). In this study, thinning is used to perform skeletonization. The thinning operation is expressed as:
A | (8) |
skeleton is a one pixel thick line representation of an object that goes through the middle of the object and preserves the homotopy of the object. Skeletonization is the process of reducing foreground regions in a binary image to a skeleton, while discarding the remaining foreground pixels. The resultant skeleton is used for the computation of length and direction, or for the detection of special topological structures such as end points and triple points (Hilditch, 1969; Rosenfeld, 1970; Bookstein, 1979; Piper, 1985; Smith, 1987; Meyer, 1988, 1989; Jang and Chin, 1990; Ji and Piper, 1992; Lam et al., 1992; Soille, 2003).
A basic formulation for skeletonization is based on the work of Lantuéjoul (1978, 1980). The skeleton subset is defined by:
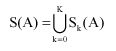
Sk(A) = {(AӨkB)-[(AӨkB) °B]} k = 0,1,1..K | (9) |
here, K is the largest value of k before the set Sk(A) becomes empty and B is chosen to approximate a circular disc, that is, convex, bounded and symmetric. The skeleton, S(A) is then the union of the skeleton subsets:
 | (10) |
The disadvantage of Lantuéjoul skeletonization is that it can cause the formation of disconnected skeletons that fail to preserve the homotopy of the respective objects. An alternative approach to skeletonization is using morphological thinning. Skeletonization by morphological thinning is defined as successive removal of outer layers of pixels from an object while retaining any pixels whose removal would alter the connectivity or shorten the legs of the skeleton. The process is converged or completed when no further pixels can be removed without altering the connectivity or shortening the skeletal legs (Jang and Chin, 1990).
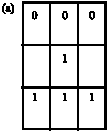
| Fig. 1: | The kernels used to implement skeletonization by morphological thinning |
 | |
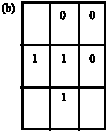
| Fig. 2: | The kernel used to implement pruning |
Skeletonization by morphological thinning is performed using the kernels in Fig. 1. At each iteration, the image is first thinned by the kernel in Fig. 1a, then by the kernel in Fig. 1b and then with the remaining six 90° rotations of the two kernels. The process is repeated in cyclic fashion until convergence (Fisher et al., 1994).
Thinning and skeletonization algorithms tend to leave parasitic components, known as spurs, which need to be cleaned up by postprocessing. The spur removal process is known as pruning (Fisher et al., 1994). One iteration of pruning is implemented by performing thinning using the kernel shown in Fig. 2 and its remaining seven 45° rotations.
A skeleton by influence zone (SKIZ) is a skeletal structure that divides an image into regions, each of which contains just one of the distinct objects in the image. The boundaries are drawn such that all points within a particular boundary are closer to the binary object contained within that boundary than to any other. The SKIZ diagram is also known as the Voronoi diagram (Fisher et al., 1994).
The computation of the SKIZ of an image is done by first determining the exoskeleton of the image (the skeleton of the background) by performing skeletonization on the inverted image and then pruning the exoskeleton until convergence to remove all branches except those forming closed loops, or that intersect the boundary (Fisher et al., 1994).
THE APPLICATION OF MORPHOLOGICAL THINNING TO PERFORM THE EXTRACTION OF DRAINAGE NETWORKS, RIDGE NETWORKS AND WATERSHEDS FROM DEMS
The regions of elevations in DEMs contain several angular points which are known as crenulations. Crenulations are flowpaths of the streamline and they indicate the presence of drainage networks. The positions of crenulations in the sequential elevation contours determine the complex drainage networks. The number of drainage branching orders depends on the overall structure of the basin. The drainage networks of the lower order stream will bifurcate and the drainage networks of the next higher order will be formed. After flowing a certain distance, the two first order streams join to form a second order stream segment with a flowpath that is another crenulation wider that of the preceding order stream. The widths of the crenulations of the contours of higher elevation are smaller than those of the lower elevation contours. It means that there are fewer higher order crenulations than there are lower order crenulations. The union of all possible crenulations in the maximum of contours produces an aggregate of drainage network (Gilbert, 1909; Howard, 1994; Rodríguez-Iturbe and Rinaldo, 1997; Sagar et al., 2000, 2003; Tay et al., 2005).
The isolation of crenulations and its aggregation to extract drainage networks from a DEM is performed in Sagar and Murthy (2000) and implementing Lantuéjoul skeletonization on the DEM. The disadvantage of this approach is that it generates disconnected drainage networks. This problem can be solved by using skeletonization by morphological thinning.
Ridges represent the part the landscape where there is the least geomorphological activity. Netherless, ridge networks often have a total length similar to the drainage networks (Mark, 1979, 1981, 1988). The drainage network flows between the ridges and the ridge network corresponds to the drainage network (Monkhouse, 1965; Schumm, 1977; Dunne, 1978; Rodríguez-Iturbe and Rinaldo, 1997). The ridge network of a DEM can be extracted by performing exoskeletonization by morphological thinning on the DEM.
The watersheds are the closed arc of ridge networks (Mark, 1979, 1981, 1988; Soille and Ansoult, 1990). Watershed extraction is implemented by pruning the extracted ridge networks until convergence. Alternatively, watershed extraction can also be implemented by performing skeletonization by influence zone on the DEM.
CASE STUDY
Case Study 1: A Simulated DEM
Simulated DEMs (also known as transcendentally generated DEMs) are often used in DEM research due to the unavailability of high resolution DEM data with all crenulations in the spatially distributed elevation regions (Sagar and Murthy, 2000; Sagar et al., 2000). Simulated DEMs contain large amounts of flat areas Hence, they can be used to show that the proposed hydrological feature extraction algorithms can be used to operate on DEMs containing large amount of flat areas.
The binary fractal image in Fig. 3a is decomposed into Topologically Prominent Regions (TPRs) that are assumed to represent characteristics such as elevation egions and crenulations. The simulated DEM (Fig. 3b) is formed by assigning elevation tags to the TPRs.
The drainage network (Fig. 3c), ridge network (Fig. 3d) and watersheds (Fig. 3d) of the generated simulated DEM are extracted. The extracted hydrological features are complete and connected, showing that the proposed algorithms are able to operate of the flat areas on the DEMs.
Case Study 2: The Photogrammetrically Generated DEM of Lake Mary
The DEM in Fig. 4a shows the area of Lake Mary, San Francisco, USA. The DEM was downloaded from the USGS Terraweb website (http://terraweb.wr.usgs.gov). The DEM was generated by digitally mosaicking elevation data for fifteen different quadrangles to cover the same area covered by Landsat TM images. These data were colour coded to show the elevation range from 4700 to 9900 feet; pixels with elevation values below 4700 feet (purple) are black and pixels with values greater than 9900 feet (red) are white. The real time interactive colour coding of the DEM data shows both the direction of surface water runoff and the basin that it is related to within the same image. This information helps determine where the surface water runoff from different locations ends up in relation to the various fractures, faults and drainage.
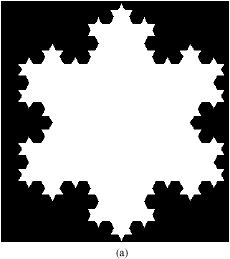
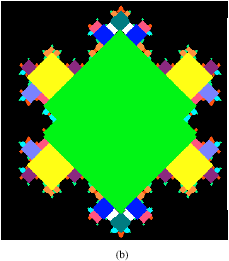
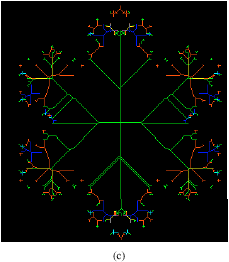
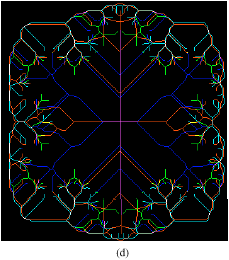
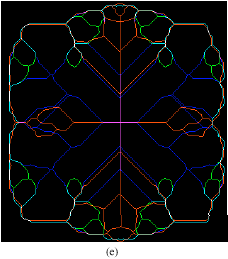
| Fig. 3: | Extraction of hydrological features from a simulated DEM. (a) A binary fractal image, (b) The generated simulated DEM. (c), (d) and (e) The corresponding drainage networks, ridge networks and watersheds of the DEM |
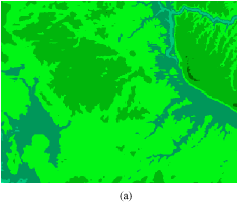
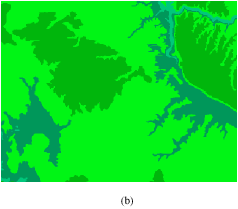
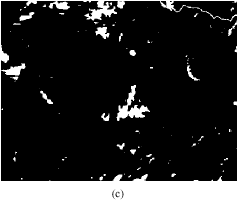
| Fig. 4: | Implementation of morphological smoothing by reconstruction of the DEM of Lake Mary (a) The DEM of Lake Mary (b) The smoothed DEM and (c) Mask of pixels modified during the smoothing process |
The interpolation process in the photogrammetry process can cause the formation of errors in the form of spurious peaks and pits. The formation of these errors is typical for many linear interpolation methods, whether bi-linear, or weighted-distance based. Spurious peaks and pits do not correspond to real landscape features and they cause errors in features extracted from DEMs. Hence, the removal of spurious peaks and pits from DEMs, known as DEM smoothing, is an important preprocessing step in DEM analysis. A number of smoothing operators have been employed to implement DEM smoothing, including mean smoothing (Mark, 1983, 1984; O`Callaghan and Mark, 1984), Gaussian blurring (Seemuller, 1989; Lee et al., 1992), Kalman filtering (Wang, 1998) and the á Trous wavelet ransform (John et al., 2002). However, the conventional DEM smoothing operators have several disadvantages:
| • | When the kernel straddles an edge, it will interpolate new values for pixels on the edge and so will blur that edge (Fisher et al., 1994). In DEM processing, edges represent crenulations, which are used to extract hydrological features from DEMs. The blurring of edges causes the unnecessary loss of information in the form of crenulations and hence, results in errors in the extracted hydrological features. |
| • | They operate with the assumption that DEMs contain equal number of spurious peaks and pits. However, since the noise (mean error in elevation) to signal (elevation) ratio in DEMs in higher in the lower elevation regions than in the higher elevation regions, DEMs actually contain more spurious pits than spurious peaks, Hence, conventional DEM smoothing methods cause the unnecessary loss of information in the form of real peaks. |
| • | They alter all elevation values, including the pixels which are not marked as spurious peaks or pits. |
In this study, DEM smoothing is implemented using the morphological smoothing by reconstruction algorithm proposed by Dinesh (2006, 2007):
Step 1: Performing Opening on the Original Image
This step removes the spurious peaks of the DEM. However, the valley enlargement effect of opening also causes the formation of larger peaks.
Step 2: Performing Morphological Reconstruction on the Opened Image
Morphological reconstruction is performed using the opened image as the marker and the original image as the mask. This step is performed to avoid the valley enlargement caused by the opening operation.
Step 3: Performing Closing on the Opened Reconstructed Image
This step removes the spurious pits of the DEM. However, the valley narrowing effect of closing causes the formation of larger pits.
Step 4: Performing Morphological Reconstruction on the Closed Image
Morphological reconstruction is performed using the closed DEM as the marker and the opened reconstructed image as the mask. This step is performed to avoid the valley filling effect caused by the closing operation. The resultant DEM obtained from this process is known as a smoothed DEM.
Morphological smoothing by reconstruction is implemented on the DEM of Lake Mary using a size 3 disk kernel to obtain a smoothed DEM (Fig. 4b). The mask of pixels modified during the smoothing process is shown in Fig. 4c.
The proposed hydrological feature extraction algorithms are implemented on the smoothed DEM. The extracted drainage network (Fig. 5a) has a length of 9,973 pixels, while the extracted ridge network (Fig. 5b) has a length of 8,618 pixels. The extracted watersheds (Fig. 5c) partition the DEM into 103 catchments of varying shapes and sizes (Fig. 5d).
The accuracy of the extracted hydrological features can be validated by gauging their conformity with Hack`s law (Hack, 1957; Gray, 1961; Muller, 1973; Mesa and Gupta, 1987; Rigon et al., 1996; Rodríguez-Iturbe and Rinaldo, 1997). According to Hack`s law, there exists a power law relationship between the length of the longest stream for each catchment L and the corresponding catchment area S:
L~Sh | (11) |
| Where, h ≈ 0.60. | |
For each extracted catchment, the length of the longest stream L and the corresponding catchment area S are computed. A log-log plot of L against S is drawn (Fig. 6). A power law relationship is observed between the two parameters. The scaling exponent of this power law relationship is computed to be 0.73, which is slightly higher than the standard value of 0.60 provided by Hack`s law.
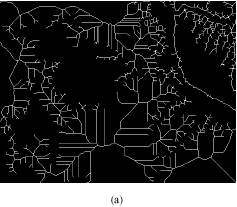
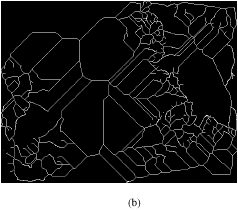
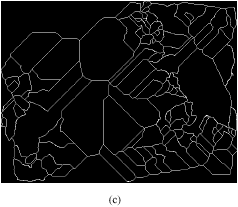
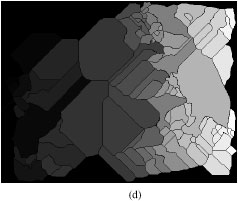
| Fig. 5: | Extraction of hydrological features from the smoothed DEM of Lake Mary. (a) The corresponding drainage networks, (b) ridge networks, (c) watersheds and (d) catchments of the DEM |
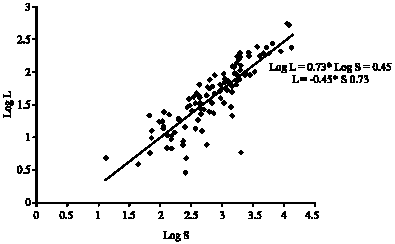 | |
| Fig. 6: | Log-log plot of the length of the longest stream for each catchment L against the corresponding catchment area S |
This deviation occurs due to errors in the DEM which are caused by poor correlation between stereophoto images, buildings and trees on the terrain surface and inconsistencies in the DEM surface generation process. This indicates that raw extraction of hydrological features from DEMs is not sufficient to obtain highly accurate hydrological features and the results obtained need to be complemented with data from other Geographical Information Systems (GIS) data captures, such as ground survey maps (which are able to provide accurate surface representation for small areas) and Landsat Thematic Mapper images.
CONCLUSION
In this study, morphological thinning based algorithms were developed to implement the extraction of drainage networks, ridge networks and watersheds from DEMs. The proposed algorithms are able to operate effectively on flat areas in DEMs and produce complete and connected outputs. The accuracy of the extracted hydrological features was validated by gauging their conformity with Hack`s law. The power law relationship derived between the length of longest stream for each extracted catchment and the corresponding catchment area has a computed scaling exponent of 0.73, which is slightly higher than the standard value of 0.60 provided by Hack`s law. This deviation indicates that raw extraction of hydrological features from DEMs is not sufficient to produce highly accurate hydrological features due to errors in DEMs and the results obtained need to be complemented with data from other GIS data captures, such as ground survey maps and Landsat Thematic Mapper images. Work is currently being carried out to develop integrated hydrological feature algorithms that incorporate these data captures.
ACKNOWLEDGMENTS
The author is grateful to four anonymous reviewers for their valuable comments which have helped strengthen this study.
REFERENCES
- Band, L.E., 1986. Topographic partitions of watersheds with digital elevation models. Water Resour. Res., 22: 15-24.
CrossRef - Bookstein, F.L., 1979. The line-skeleton. Comput. Graph. Image Process., 11: 123-137.
CrossRefDirect Link - Colombo, R., J.V. Vogt, P. Soille, M.L. Paracchini and A. de Jager, 2007. Deriving river networks and catchments at the European scale from medium resolution digital elevation data. CATENA, 70: 296-305.
CrossRef - Costa-Cabral, M.C. and S.J. Burges, 1994. Digital elevation model networks (DEMON): A model of flow over hillslopes for computation of contributing and dispersal areas. Water Resour. Res., 30: 1681-1692.
CrossRef - Curkendall, D.W., E.J. Fielding, T.H. Cheng and J.M. Pohl, 2003. A computational-grid based system for continental drainage network extraction using SRTM digital elevation models. Proceedings of the International Conference on Parallel Processing Workshops (ICPPW), October 6-9, 2003, Pasadena, CA., pp: 181-190.
Direct Link - Dinesh, S., 2007. The effect of morphological smoothening by reconstruction on the extraction of peaks and pits from digital elevation models. Patt. Recog. Lett., 28: 1400-1406.
CrossRef - Douglas, D.H., 1986. Experiments to locate ridges and channels to create a new type of digital elevation model. Cartographica: Int. J. Geogr. Inform. Geovisualiz., 23: 26-61.
CrossRefDirect Link - Fairfield, J. and P. Laymarie, 1991. Drainage networks from grid digital elevation models. Water Resour. Res., 27: 709-717.
CrossRef - Freeman, T.G., 1991. Calculating catchment area with divergent flow based on a regular grid. Comput. Geosci., 17: 413-422.
CrossRef - Garbrecht, J. and L. Martz, 1997. The assignment of drainage direction over flat surfaces in raster digital elevation models. J. Hydrol., 193: 204-213.
CrossRef - Gray, D.M., 1961. Interrelationships of watershed characteristics. J. Geophys. Res., 66: 1215-1233.
CrossRef - Howard, A.D., 1994. A detachment-limited model of drainage basin evolution. Water Resour. Res., 30: 2261-2285.
CrossRef - Hutchinson, M., 1989. A new procedure for gridding elevation and stream line data with automatic removal of spurious pits. J. Hydrol., 106: 211-232.
CrossRef - Jang, B.K. and R.T. Chin, 1990. Analysis of thinning algorithms using mathematical morphology. Trans. Patt. Anal. Machine Intel., 12: 541-551.
CrossRef - Jenson, S.K. and J.O. Domingue, 1988. Extracting topographic structures from digital elevation data for geographic information system analysis. Am. Soc. Photogrammetry Remote Sensing, 11: 1593-1600.
Direct Link - Ji, L. and J. Piper, 1992. Fast homotopy-preserving skeletons using mathematical morphology. IEEE Trans. Patt. Anal. Machine Intel., 14: 653-664.
CrossRef - Johnston, E.G. and A. Rosenfeld, 1975. Digital detection of pits, peaks, ridges and ravines. IEEE Trans. Syst. Man Cybern., 5: 472-480.
CrossRefDirect Link - Lam, L., S.W. Lee and C.Y. Suen, 1992. Thinning methodologies: A comprehensive survey. IEEE Trans. Pattern Anal. Machine Intel., 14: 869-885.
CrossRef - Lantuéjoul, C., 1980. Skeletonization in Quantitative Metallography. In: Issues of Digital Image Processing, Haralick, R.M. and J.C. Simon (Eds.). Sijthoff and Neordhoff, Groningen, The Netherlands.
CrossRef - Lee, J., P.K. Snyder and P.F. Fisher, 1992. Modeling the effect of data errors on feature extraction from digital elevation models. Photogramm. Eng. Remote Sens., 58: 1461-1467.
Direct Link - Mackay, S.D. and L.E. Band, 1998. Extraction and representation of nested catchment areas from digital elevation models in lake-dominated topography. Water Resour. Res., 34: 897-901.
CrossRef - Mark, D.M., 1979. Topology of ridge patterns: Randomness and constraints. Geol. Soc. Am. Bull., Part 1, 90: 164-172.
CrossRef - Mark, D.M., 1981. Topology of ridge patterns: Possible physical interpretation of the minimum spanning tree postulate. Geology, 9: 370-372.
CrossRef - Mark, D.M., 1984. Automated detection of drainage networks from digital elevation models. Cartographica: Int. J. Geogr. Inform. Geovisualiz., 21: 168-178.
CrossRefDirect Link - Martz and Garbrecht, 1998. The treatment of flat areas and depressions in automated drainage analysis of raster digital elevation models. Hydrol. Process., 12: 843-855.
CrossRef - Meisels, A., S. Raizman and A. Karnieli, 1995. Skeletonizing a DEM into a drainage network. Comput. Geosci., 21: 187-196.
CrossRef - Mesa, O.J. and V.K. Gupta, 1987. On the main channel length-area relationships for channel networks. Water Resour. Res., 23: 2119-2122.
CrossRef - Moore, I.D., R.B. Grayson and A.R. Ladson, 1991. Digital terrain modelling: A review of hydrological, geomorphological and biological applications. Hydrol. Processes, 5: 3-30.
CrossRef - Muller, J.E., 1973. Re-evaluation of the relationship of master streams and drainage basins. Reply Geol. Soc. Am. Bull., 84: 3127-3130.
CrossRef - O'Callaghan, J.F. and D.M. Mark, 1984. The extraction of drainage networks from digital elevation models. Comput. Vision, Graphics Image Process., 28: 323-344.
CrossRef - Peucker, T.K. and D.H. Douglas, 1975. Detection of surface specific points by local parallel processing of discrete terrain elevation data. Comput. Graphics Image Process., 4: 375-387.
CrossRef - Piper, J., 1985. Efficient implementation of Skeletonization using interval coding. Patt. Recog. Lett., 3: 389-397.
CrossRef - Rigon, R., I. Rodríguez-Iturbe, A. Giacometti, A. Maritan, D. Tarboton and A. Rinaldo, 1996. On Hack's law. Water Resour. Res., 32: 3367-3374.
CrossRef - Sagar, B.S.D. and K.S.R. Murthy, 2000. Generation of fractal landscape using nonlinear mathematical morphological transformations. Fractals, 8: 267-272.
CrossRef - Sagar, B.S.D., M. Venu and D. Srivinas, 2000. Morphological operators to extract channel networks from digital elevation models. Int. J. Remote Sensing, 21: 21-29.
CrossRef - Sagar, B.S.D., M.B.R. Murthy, C.B. Rao and B. Raj, 2003. Morphological approach to extract ridge-valley connectivity networks from digital elevation models (DEMs). Int. J. Remote Sensing, 24: 573-581.
CrossRef - Seemuller, W.W., 1989. The extraction of ordered vector drainage networks from elevation data. Comput. Vision, Graphics Image Process., 47: 45-48.
CrossRef - Smith, R.W., 1987. Computer processing of line images: A survey. Pattern Recognition, 20: 7-15.
CrossRef - Soille, P. and M.M. Ansoult, 1990. Automated basin delineation from digital elevation models using mathematical morphology. Signal Process., 20: 171-182.
CrossRef - Soille, P. and C. Gratin, 1994. An efficient algorithm for drainage network extraction on DEMs. J. Visual Commun. Image Represent., 5: 181-189.
CrossRef - Soille, P., J. Vogt and R. Colombo, 2003. Carving and adaptive drainage enforcement of grid digital elevation models. Water Resour. Res., 39: 1366-1366.
CrossRef - Tarboton, D., 1997. A new method for the determination of flow directions and upslope areas in grid digital elevation models. Water Resour. Res., 33: 309-319.
CrossRef - Tay, L.T., B.S.D. Sagar and H.T. Chuah, 2005. Analysis of geophysical networks derived from multiscale digital elevation models: A morphological approach. IEEE Geosci. Remote Sensing Lett., 2: 399-403.
CrossRef - Toriwaki, J.I. and T. Fukumura, 1978. Extraction of structural information from grey pictures. Comput. Graphics Image Process., 7: 30-51.
CrossRefDirect Link - Tribe, A., 1992. Automated recognition of valley lines and drainage networks from digital grid elevation models: A review and a new method. J. Hydrol., 139: 263-293.
Direct Link - Turcotte, R., J.P. Fortin, A. Rousseau, N. Massicotte and J.P. Villeneuve, 2001. Determination of the drainage structure of a watershed using a digital elevation model and a digital river and lake network. J. Hydrol., 240: 225-242.
CrossRef - Vincent, L. and P. Soille, 1991. Watersheds in digital spaces: An efficient algorithm based on immersion simulations. IEEE Trans. Pattern Anal. Mach. Intell., 13: 583-598.
CrossRef - Vincent, L., 1993. Morphological reconstruction in image analysis: Applications and efficient algorithms. IEEE Trans. Image Process., 2: 176-201.
CrossRef - Wang, P., 1998. Applying two dimensional Kalman filtering for digital terrain modelling. Photogrammetric Eng. Remote Sens., 32: 649-656.
Direct Link