
Midrar- ul-Haq
Not Available
Riaz A. Khattak
Not Available
Haji Khan Puno
Not Available
M. Saleem Saif
Not Available
Kazi Suleman Memon
Not Available
Nabi Bux Sial
Not Available
Asian Journal of Plant Sciences
Year: 2005 | Volume: 4 | Issue: 2 | Page No.: 159-163


ABSTRACT
This study presents heavy metals accumulation in potentially contaminated soils of NWFP. Forty samples from each depth 0-20 and 20-40 cm were collected from soils receiving industrial effluents as irrigation water and eight samples (four samples from each depth) were collected from soils irrigated with tubewell waters considered as background soil. All the soil samples were analysed for heavy metals concentrations. The mean values of Cd, Cr, Ni and Pb in effluent irrigated soils were 0.12, 0.28, 5.64 and 6.30 mg kg-1 at 0-20 cm soil depth and 0.06, 0.18, 3.34 and 4.66 mg kg-1 in soil samples collected from 20-40 cm soil depth, respectively. However, the background soil values for Cd, Cr, Ni and Pb were 0.06, 0.12, 0.98 and 2.12 mg kg-1 at 0-20 cm soil depth and 0.04, 0.10, 0.25 and 1.66 mg kg-1 at 20-40 cm soil depth, respectively. The results showed that the concentrations of heavy metals were significantly higher in soils irrigated with effluents and the levels of these metals further increased in the surface soils as compared to sub-surface soils. The observation suggested strong impact of industrial effluents on accumulation of heavy metals in soils to levels considered above normal.
PDF Abstract XML References Citation
How to cite this article
Midrar- ul-Haq, Riaz A. Khattak, Haji Khan Puno, M. Saleem Saif, Kazi Suleman Memon and Nabi Bux Sial, 2005. Heavy Metals Accumulation in Potentially Contaminated Soils of NWFP. Asian Journal of Plant Sciences, 4: 159-163.
DOI: 10.3923/ajps.2005.159.163
URL: https://scialert.net/abstract/?doi=ajps.2005.159.163
DOI: 10.3923/ajps.2005.159.163
URL: https://scialert.net/abstract/?doi=ajps.2005.159.163
INTRODUCTION
Heavy metals is the term applied to a large group of elements with an atomic density greater than 6 g cm-3[1]. These metals are also called trace elements as they occur in concentrations of less than 1% in the rocks of the earth’s crust, a primary source of these metals. Metals occur naturally in soils, usually at relatively low concentrations, as a result of the weathering and other pedogenic processes acting on the rock fragments on which the soil develop. Besides weathering of rocks other major sources of metals to soils are metalliferous mining and smelting, agricultural materials (e.g chemical fertilizers and pesticides), sewage sludge, effluent irrigation, fossil fuel combustion and metallurgical industries[2].
Soil contamination arises at the site of the industrial installation and its vicinity in many industrial processes by the process itself, or the intermediate storage of products, or has arisen owing to the often careless disposal of waste products in the past[3]. The industrial wastewater contains harmful substances including heavy metals. The long term use of sewage or effluents for irrigation purposes may result in accumulation of heavy metals in soils and crops to such an extent that may become toxic to plants and causing deterioration[4]. In Pakistan, like in any other developing countries, the untreated domestic and industrial wastewaters are discharged into various water sources directly or indirectly. According to Memon[5], 3% of the industries in Pakistan treat their waste materials while the rest of the industries discharge their effluents as untreated. In the province of NWFP Kabul River acts as a flowing sink for the various industrial and domestic wastewater[6]. The continuous use of industrial waste water and Kabul River water for irrigation in Amangarh and Pirsabak can cause the accumulation of heavy metals in soils to such an extent which will have adverse effects on plants, animals and human health. The results of this study show heavy metals (Cd, Cr, Ni and Pb) accumulation in possibly contaminated soils of Amangarh and Pirsabak, NWFP-Pakistan. The build up of these elements during 2000-2001 was also investigated.
MATERIALS AND METHODS
The composite soil samples were collected in polythene bags from two depths (0-20 and 20-40 cm) with the help of stainless steel auger. The criteria for selection of the sampling sites were based on the possible contamination due to irrigation with industrial wastes waters. A total of 80 soil samples (40 samples from each depth) were collected from area irrigated with industrial effluents (including 16 samples from Amangarh Industrial Area and 64 from Pirsabak, NWFP). However, 8 samples (four samples from each depth) were taken from soils irrigated with tubewell waters considered as background samples.
The samples were collected both in summer and winter seasons of the years 2000 and 2001. The soil samples brought to the laboratory were air dried, sieved (<2 mm) and extracted with AB-DTPA[7] and analysed for Cd, Cr, Ni and Pb by atomic absorption spectrophotometer (Perkin Elmer, Model No. 2380). The significance of results were tested by t-test (p<0.05) as described by Steel and Torrie[8].
RESULTS AND DISCUSSION
To evaluate the effect of year, season and sampling depth, analysis of variance using 23 factorial RCBD was applied on the data for the concentrations of heavy metals (Cd, Cr, Ni and Pb) in soil samples collected from various sites of NWFP during summer and winter seasons of the years 2000-2001. The ANOVA showed significant variations within the given sites of sampling as evident from the level of probability and co-efficient of variations, which ranged from 57.51-136.06% (Table 1). This observation is understandable as soil samples were collected from diverse locations (Table 5).
AB-DTPA extractable heavy metals concentrations
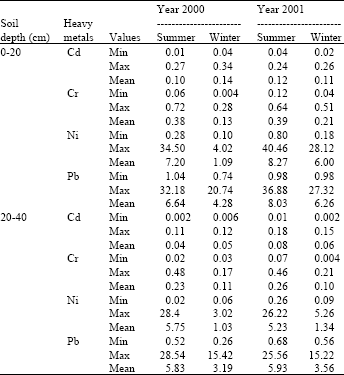
Cadmium: The concentrations of Cd, varied between 0.01 to 0.27 mg kg-1 in surface soils (0-20 cm) and from 0.002 to 0.11 mg kg-1 in subsurface (20-40 cm) with the mean values of 0.10 and 0.04 mg kg-1, respectively in summer 2000 (Table 2). During the winter 2000, Cd ranged from 0.04 to 0.34 in surface and 0.006 to 0.12 mg kg-1 in sub-surface soil samples having mean values of 0.14 and 0.05 mg kg-1, respectively.
Similarly, in summer 2001, Cd ranged from 0.04 to 0.24 with the mean value of 0.12 mg kg-1 in surface soils while 0.01 to 0.18 with the mean value of 0.08 mg kg-1 in sub-soils. The Cd during winter 2001, varied between 0.02 to 0.26 and 0.002 to 0.15 with the average values of 0.11 and 0.06 mg kg-1 in surface and subsurface soil samples, respectively. The data showed reverse trend as compared to other elements and the Cd tended to increase in winter as compared to summer which might be due to high input from different industrial activities during winter season. The Cd decreased with increasing soil depth.
The overall mean value of Cd in effluent irrigated soil samples was 0.12 mg kg-1 against the background value of 0.06 mg kg-1 for 0-20 cm soil depth while 0.06 mg kg-1 against 0.04 mg kg-1 for 20-40 cm soil depth (Table 3).
The analysis of variance showed that Cd was significantly (p<0.001) higher in surface soils than sub-surface soils (Table 1).
| Table 1: | ANOVA showing the effect of year, season and sampling depth on the concentrations of heavy metals (Cd, Cr, Ni, Pb) at the given level of probability |
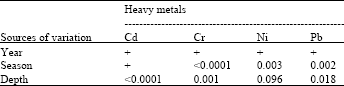 | |
| + p>0.15 | |
| Table 2: | Concentration of heavy metals (mg kg-1) in effluent irrigated soil samples collected from various sites of NWFP during summer and winter seasons of the years 2000 and 2001 |
 | |
| Table 3: | Comparison of the average values (mg kg-1) of heavy metals in effluent and tube well irrigated (background) soil samples collected from various sites of NWFP Province |
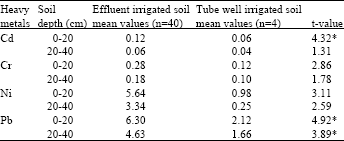 | |
| * Tube well irrigated soil values are significantly lower than the mean values of effluent irrigated soils at p<0.05. | |
The t-test comparison showed that Cd in effluent irrigated soil samples is significantly (p<0.05) higher than that in tube well irrigated soil samples (Table 3). This increased Cd accumulation can be ascribed to the effect of effluents from different industries carrying Cd to the soil in irrigation as well as the indiscriminate use of commercial fertilizers. The higher values in the surface soils suggest contamination of soil.
Khattak and Rehman[6] reported AB-DTPA ext. Cd, which ranged from 0.01-0.09 mg kg-1 for Pirsabak soils and 0.03-0.05 mg kg-1 for soils of Amangarh Industrial Area, Nowshera. Wazir[9] reported Cd concentration of 0.06 to 0.14 mg kg-1 in soils within the proximity of Peshawar, which is presumably influenced by automobiles emission dust fall. The results presented in (Table 2) are quite high than those reported by Khattak and Rehman[6] and Wazir[9], which shows that with the passage of time the Cd tended to increase.
Chromium: The concentration of chromium (Cr), in summer 2000, ranged from 0.06 to 0.72 and 0.02 to 0.48 with the average values of 0.38 and 0.23 mg kg-1 for 0-20 and 20-40 cm soil depth, respectively. The ranges of Cr observed during the winter 2000 for surface and subsurface soil samples were 0.004 to 0.28 and 0.03 to 0.17 with the mean values of 0.13 and 0.11 mg kg-1, respectively (Table 2).
Similarly, the observed range of Cr during summer 2001 was 0.12 to 0.64 with the average value of 0.39 mg kg-1 for 0-20 cm and 0.07 to 0.46 with the average value of 0.26 mg kg-1 for 20-40 cm soil depth. During the winter 2001, the Cr ranged from 0.04 to 0.51 with the mean concentration of 0.21 mg kg-1 and from 0.004 to 0.21 with the average value of 0.10 mg kg-1 in surface and subsurface soil samples, respectively (Table 2).
The grand mean concentrations of Cr in effluent irrigated soil samples were 0.28 and 0.18 mg kg-1 in surface and sub surface soil samples, respectively. While, the mean values of Cr in tube well irrigated soil samples were 0.12 and 0.10 mg kg-1 for the given respective soil surfaces (Table 3). The Cr increased in summer as compared to winter and decreased with depth.
The analysis of variance showed that difference in season and sampling depth has significantly affected Cr at p<0.001 and 0.01, respectively (Table 1). According to t-test comparison, Cr in effluent and tube well irrigated soil samples differed non-significantly (Table 3).
The observed values of Cr in effluent irrigated soils were higher than those in tubewell irrigated soils and lower than those reported by Tjell and Hovmand[10], Aaby and Jacobson[11], Aichberger[12] and Czarnowska and Majchrzak[13]. According to Tjell and Hovmand[10] and Aaby and Jacobsen[11] the Cr concentration in surface soils of Denmark ranged from 1.8-10 mg kg-1 while Aichberger[12] observed Cr concentration ranging from 1.4-3.5 mg kg-1 in surface soils of Australia. However, Czarnowska and Majchrzak[13] reported Cr concentration in the range of 4-28 mg kg-1 in soils of Kabacki Forest, Poland.
Nickel: The nickel concentrations (Ni), varied between 0.28 to 34.50 in surface soils and from 0.02 to 28.4 mg kg-1 in subsurface with the mean values of 7.20 and 5.75 mg kg-1, respectively during summer 2000 (Table 2). While in winter 2000, Ni ranged from 0.10 to 4.02 in surface and 0.06 to 3.02 mg kg-1 in sub-surface soil samples having mean values of 1.09 and 1.03 mg kg-1, respectively.
Similarly, in summer 2001, Ni ranged from 0.80 to 40.46 with the mean concentration of 8.27 mg kg-1 in surface soils while 0.26 to 26.22 with the mean concentration of 5.23 mg kg-1 in sub-soils. During winter 2001, the Ni declined and ranged from 0.18 to 28.12 and 0.09 to 5.26 with the average of 6.0 and 1.34 mg kg-1 in surface and subsurface soil samples, respectively (Table 2). The data showed that Ni was lower in winter than that in summer and similar trend was observed when subsurface soils were compared with surface soils.
The overall mean value of Ni in effluent irrigated soil samples was 5.64 mg kg-1 against the background value of 0.98 mg kg-1 in surface soils while 3.34 mg kg-1 against 0.25 mg kg-1 in subsurface soils (Table 3).
The analysis of variance showed that difference in season and sampling depth has significantly affected Ni at p<0.01 and 0.1, respectively (Table 1). Although the Ni in effluent irrigated soils is quite high as compared to tube well irrigated soils but the t-test comparison showed no significant difference between Ni in effluent and tube well irrigated soils (Table 3) which might be due to its low concentration in effluent irrigated soils during winter 2000 (Table 2).
Khattak and Rehman[6] reported AB-DTPA extractable Ni concentration as 0.63 mg kg-1 in soils of Amangarh Industrial Area, Nowshehra and 0.51-1.35 mg kg-1 in soils of Pirsabak Farm. They also predicted Ni build up in soil with time because of the Associated Ghee Industries, which is the main source of Ni. Ikramullah[14] reported average Ni concentration ranging from 1.49-2.62 mg kg-1 in industrial wastewater irrigated soils. The results of this study showed a high concentration of Ni than those reported by the above investigators.
Pratt et al.[15] reported that normal Ni level in soil is between 0.005 to 0.05 mg kg-1. The reported mean values of Ni presented in Table 2 are higher than those reported for normal soil. Kabata-Pendias and Pendias[16] reported that Ni, recently has become a serious pollutant due to increase combustion of coal, oil and application of sludge. Ni in sewage sludge that is present mainly in organic forms readily available to plants and is, therefore, very toxic to plants.
Lead: In summer 2000, the concentration of Pb ranged from 1.04 to 32.18 and 0.52 to 28.54 with the average values of 6.64 and 5.83 mg kg-1 in surface and subsurface soil samples, respectively.
| Table 4: | Relationship of pH and organic matter content with soil heavy metals |
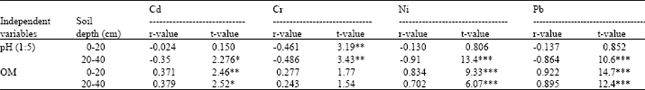 | |
| *, **,*** Significant at p<0.05, 0.01 and 0.001, respectively | |
During the winter 2000, Pb ranged from 0.74 to 20.74 in surface and 0.26 to 15.42 mg kg-1 in subsurface soil samples having mean concentrations of 4.28 and 3.19 mg kg-1, respectively (Table 2).
Similarly, Pb ranged from 0.98 to 36.88 with the average value of 8.03 mg kg-1 in surface soils and 0.68 to 25.56 having mean value of 5.93 mg kg-1 in subsurface soils, during summer 2001. However, in winter 2001, Pb varied between 0.98 to 27.32 and 0.56 to 15.22 mg kg-1 with the average values of 6.26 and 3.56 mg kg-1 in surface and subsurface soil samples, respectively (Table 2). The data showed that Pb tended to increase in summer as compared to winter and decrease with depth.
The grand mean concentrations of Pb in effluent irrigated soil samples were 6.30 and 4.63 mg kg-1 in surface and subsurface soil samples, respectively. While, the mean values in tube well irrigated soil samples were 2.12 and 1.66 mg kg-1 for the given soil surfaces (Table 3) respectively.
The analysis of variance showed that Pb is significantly affected by the difference in season and sampling depth at p<0.01 and 0.05, respectively (Table 1). According to t-test comparison, Pb in effluent irrigated soils is significantly higher than that in tube well irrigated soils at p<0.05 (Table 3).
According to Czarnowska[18] Pb concentration in contaminated surface soils of Poland ranged from 17-165 mg kg-1 while Czarnowska and Majchrzak[13] reported Pb concentration ranging from 4-16 mg kg-1 in soils of Kabacki Forest, Poland. Khattak and Rehman[6] reported AB-DTPA ext. Pb, which ranged from 3.33-5.60 mg kg-1 in soils of Industrial Area Amangarh and 0.49-2.05 mg kg-1 in soils of Pirsabak Farm. Wazir[9] reported Pb concentration ranging from 2.05-26.4 mg kg-1 in contaminated soils within the proximity of Peshawar City. Khattak et al.[17] reported Pb concentration, which ranged from 1.5-10.0 mg kg-1 in soils within the proximity of Abbottabad. The average results presented in Table 2 are in agreement with those reported by Khattak and Rehman[6], Khattak et al.[17]. While, the maximum values observed in soil of Amangarh Industrial Area, Nowshehra (NWFP) are quite high and can be compared with those reported for contaminated soils[9,18].
An effort was also made to study the correlation between physiochemical properties and soil heavy metals. The pH of surface soil showed negative and non-significant correlation with Cd, Ni and Pb while significant correlation with Cr.
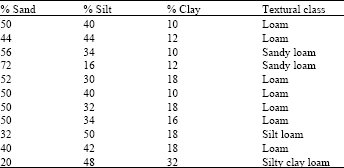
| Table 5: | Textural class of the soil samples collected from various sites of NWFP province |
 | |
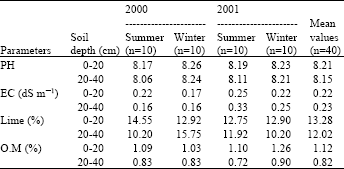
| Table 6: | Average values of soil physico chemical properties of different soil samples collected form various sites of NWFP Province during different seasons of the years 2000 and 2001 |
 | |
However, this correlation was negative and significant for all selected metals at 20-40 cm soil depth. The organic matter content showed positive and significant correlation with Cd, Ni and Pb while non-significant with Cr at both depths (Table 4).
The variations in soil physico chemical properties and their correlation with heavy metals (Cd, Cr, Ni and Pb) may be due to variations in composition of effluents water used for irrigation. The data for Cr, Ni and Pb showed that the concentrations of these metals tended to increase in summer as compared to winter and decreased with depth (Table 6). Such variations can be associated with changes in temperature, pH, microbial activities and variations in climatic conditions (rainfall) and as well as effluents input. As surface soils are more exposed to industrial effluents and other site related complex factors so, it contains higher concentrations of heavy metals than subsurface soils.
So, on the basis of results, it can be concluded that the soils of Amangarh Industrial Area, Nowshehra (NWFP) contained higher concentrations of heavy metals than those considered normal (background soil). The heavy metals build up in soils to phytotoxic level may take place due to continuous use of industrial and domestic wastewater for irrigation.
REFERENCES
- Khan, M., 2000. Effect of metals contamination on soil microbial diversity, enzymatic activity, organic matter decomposition and nitrogen mineralisation (A Review). Pak. J. Biol. Sci., 3: 1950-1956.
CrossRefDirect Link - Havlin, J.L. and P.N. Soltanpour, 1981. Evaluation of the NH4HCO3-DTPA soil test for iron and zinc. Soil Sci. Soc. Am. J., 45: 70-75.
Direct Link - Steel, R.G.D. and J.H. Torrie, 1980. Principles and Procedures of Statistics: A Biometrical Approach. 2nd Edn., McGraw Hill Book Co., New York, USA., ISBN-13: 9780070609266, Pages: 633.
Direct Link