
Hossein Ramshini
Not Available
Mohammad Reza Naghavi
Not Available
Hoshang Alizadeh
Not Available
Asian Journal of Plant Sciences
Year: 2005 | Volume: 4 | Issue: 2 | Page No.: 123-127


ABSTRACT
In this study the molecular variation of 21 bread wheat cultivars/lines was assessed using RAPD markers. With 17 primers 213 bands were scored among which 188 were polymorphic. The mean number of bands was 12.5 for each primer. In this research the analyses were done on two groups of bands: total bands and sharp bands. The similarity matrices and dendrograms were obtained using different algorithms. For sharp bands Simple Matching (SM) coefficient led to higher co-phenetic correlation, but for total bands the correlations were higher for Dice and Jaccard's coefficients. For both groups of bands UPGMA was the best method of clustering. The clusters of total bands and sharp bands have a low correlation with each other. The big decrease from the co-phenetic correlations of total bands to those of sharp bands shows that these two kinds of bands may be different from each other. Choosing the sharp bands did not lead to better results. So we recommend that all bands be scored. The PCO analysis could not classify cultivars in definite clusters.
PDF Abstract XML References Citation
How to cite this article
Hossein Ramshini, Mohammad Reza Naghavi and Hoshang Alizadeh, 2005. Comparison of Genetic Diversity Based on Total and Sharp Bands of RAPD Data in Wheat. Asian Journal of Plant Sciences, 4: 123-127.
DOI: 10.3923/ajps.2005.123.127
URL: https://scialert.net/abstract/?doi=ajps.2005.123.127
DOI: 10.3923/ajps.2005.123.127
URL: https://scialert.net/abstract/?doi=ajps.2005.123.127
INTRODUCTION
Genetic diversity is the basis for the genetic improvement. Evaluation of Genetic diversity levels among adapted, elite germplasm can provide predictive estimates of genetic variation among segregating progeny for pure line cultivar development[1] and may estimate the degree of heterosis in progeny of some parental combinations[2,3].
Different methods have been used to assess genetic diversity. This information can be obtained from pedigree analysis, morphological traits or using molecular markers[4]. Molecular markers provide the best estimate of genetic diversity since they are independent of the confounding effects of environmental factors. Assays based on the Polymerase Chain Reaction (PCR) are considered to meet both the technical and genetic requirements for the characterization of plant and animal genetic resources[5]. In recent years, several molecular assays have been applied to assess genetic diversity among wheat cultivars[6-8]. These molecular methods are different in principle, application, type, amount of polymorphism detected and in task and time requirements.
Random Amplified Polymorphic DNA (RAPD) markers represent amplification products from a Polymerase Chain Reaction (PCR), utilizing arbitrary primers and genomic DNA[9]. RAPD markers have been demonstrated to be useful for the studies of taxonomic identities, systematic relationships, population genetic structures, species hybridization and parentage identifications[10]. Many researchers have used RAPD markers for classifying genotypes based on their similarity to each other. Using RAPD combined with PAGE electrophoresis all bands can be approximately divided in two different groups: sharp bands and faint bands. This can be explained that a specific fragment, present in two individuals, can be amplified in one genetic background but not in another due to competition from other unlinked sites or it may be amplified less than others which lead to different band intensities[11]. Now the question is that are these two kinds of bands different from each other naturally? If they are different, we expect different results after analyzing the data obtained from sharp bands and from total bands. So the objectives of this study were to compare the two groups of markers for classifying genotypes and other analysis.
MATERIALS AND METHODS
Nineteen Iranian bread wheat cultivars (Tajan, Golestan, Sardari, Ghods, Ghafghaz, Azar2, Bolani, Alvand, Tabasi, Roshan, Bezostaya, Falat, Mahdavi, Zarin, Shoaleh, Navid, Omid, Niknezhad and Iniea) and two lines (Shain and Line518) were selected for this study. All of these samples were obtained from Seed and Plant Improvement Institute, Karaj, Iran. Fresh leaves of each sample were used for DNA extraction based on miniprep protocol[12]. DNA quality was verified by electrophoresis on agarose gel 1%. DNA samples were diluted to a concentration of 5 g μL-1 for using in the polymerase chain reaction.
A total of 17 10-mer oligonucleotides from UBC (University of British Colombia) series were selected according to the number and consistency of amplified fragments (Table 1). PCR reactions were carried out in a 25 μL reaction containing 1 unit of Taq polymerase, 5 ng of template DNA, 0.2 μM of primer, 2 μM of each dATP, dCTP, dGTP and dTTP and 2.5 μL of 10X PCR reaction buffer. Amplifications were performed in a DNA thermo-cycler (Perkin-Elmer) programmed for 45 consecutive cycles each consisting of 1 min at 92°C, 1 min at 37°C and 2 min at 72°C. Following amplification, the samples were subjected to electrophoresis in 6% acrylamide gels in TAE buffer running at 200 v for 2.5 h. The gels were stained using ethidum bromide and viewed under ultra-violet light.
RAPD bands behave as dominant markers and were scored for the presence (1) or absence (0) of homologous bands for all cultivars\lines. Estimates of similarity were based on three different measures: Nei and Li's coefficient[13]: Sij= 2a/(2a+b+c), where, Sij is the similarity between two individuals, I and j, a is the number of bands present in both I and j, b is the number of bands present in j and absent in I and c is the number of bands present in j and absent in I; this is also known as the Dice coefficient. Jaccard's coefficient[14]: Sij= a/a+b+c and the Simple Matching (SM) coefficient: Sij= a+d/a+b+c+d where, d is the number of bands absent from both I and j. The matrices of similarity were then analysed using various clustering methods, UPGMA (Unweighted pair group method) WPGMA (weighted pair group method), compete linkage and single linkage using the software NTSYS-pc. The dendrograms were created with TREE program of NTSYS and the goodness of each cluster was assessed by calculating co-phenetic correlations. For measuring the correlations between the clusters resulted from sharp bands with those of total bands, their co-phenetic matrices were subjected to co-phenetic correlation in NTSYS. Principle Coordinate Analysis (PCO) based on genetic similarity matrices was preformed using the DECENTER and EIGEN algorithms of the NTSYS-pc software package.
RESULTS
Initial screening of about 46 primers resulted in the identification of 17 primers which yielded informative polymorphic products resolvable by gel electrophoresis (Table 1).
| Table 1: | 10mer primers and the number of bands which are amplified by them |
 | |
 | |
| Fig. 1: | The banding pattern of primer UBC129 on samples number 1-12 |
Usually, products below 100 bp or above 3 kb gave non-reproducible bands, hence most of the scored products were in the range of 130-1350 bp. A total of 213 bands wee screened (average of 11 bands per primer) among which 188 were polymorphic (88%). Figure 1 shows an example of such a typical RAPD pattern using the UBC129 primer. Polymorphic fragments were distributed across the entire size range with the major proportion being between 150-1000 bp. Forty five sharp bands were found among all 188 polymorphic bands. All analyses were done for 45 sharp bands and total bands. The dendrograms constructed using three different similarity matrices (Dice, Jaccard and SM) and four different clustering methods (UPGMA, WPGMA, complete linkage and single linkage) for both sharp bands and total bands and then the co-phenetic correlation values produced by each coefficient compared (Table 2).
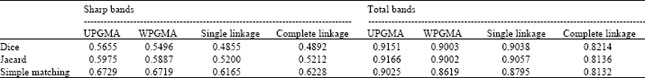
| Table 2: | Co-phenetic correlations for clusters obtained from different similarity matrices and clustering methods |
 | |
 | |
| Fig. 2: | Dendrograms of 21 wheat cultivars/lines obtained using total bands (up) and sharp (down) bands of RAPD data |
For both sharp bands and total bands the UPGMA technique gave consistently higher co-phenetic correlation scores, where, r>0.9 indicates a very good fit; r= 0.9-0.8 indicates good fit and r<0.8 indicates a poor fit. For sharp bands SM coefficient of similarity gave consistently higher co-phenetic correlation values than either Dice or Jaccard's coefficients, whereas for total bands, Dice and Jaccard's coefficients resulted to higher co-phenetic correlations. In previous studies Jaccard's coefficients has been reported to lead to higher co-phenetic correlations[15]. As for both groups of bands UPGMA was the best method of clustering and because for sharp bands SM led to higher co-phenetic correlation, so we constricted two dendrograms using UPGMA and SM coefficient for two groups of bands. Dendrograms of sharp band were completely different from that of total bands. In the dendrogram of total bands, it is not easy to classify varieties in separate groups but in sharp bands dendrogram four main clusters appear which are almost identical in all analysis.
 | |
| Fig. 3: | Patterns of relationships among 21 wheat cultivars\lines by Principle Coordinate Analysis (PCO) for total bands (up) and sharp bands (down) of RAPD data |
In total bands dendrogram, cultivar Navid is completely separated from other genotypes where as in the dendrogram of sharp bands, this cultivar is classified along with Bolani and Line518 in fourth cluster (Fig. 2). For sharp bands 24.97% of total variation is represented on the x and y axes and the next 14.83% on the z axes (Fig. 3). In other words a 3-D plot represents about 40% of total variation. In previous studies 3-d plots has represented about 50% of total variation[15]. For total bands 21.8% of total variation is represented on x and y axes and the next 7.2% on z axis, which totally represented about 29% of total variation. Again for both sharp bands and total bands, it is impossible to classify genotypes in distinct groups. Of course in total bands plot, cultivar Navid is obviously separated from other cultivars\lines.
Considering PCO plots, there is a big difference in configuration of cultivars\lines between sharp bands and total bands.
| Table 3: | Correlations between co-phenetic matrices of sharp bands and total bands which are obtained from different methods of clustering with different similarity matrices |
 | |
| ** and * significant at 1 and 5%, respectively | |
For showing this difference between the results of these two groups of bands clearly, we constructed co-phenetic matrices for all dendrograms for both groups of bands. Then using NTSYs correlations of these matrices between two groups of bands were calculated. This way has been used for comparing dendrograms resulted from different ways or from different markers. For example Powell et al.[5] and Belaj et al.[16] have used this way for comparing the results of different markers (RFLP, RAPD, SSR and AFLP). Using permutation test, most of the correlations were significant at 0.05 or 0.01 level. However the scores were from 0.41 to 0.009, which are relatively low (Table 3).
DISCUSSION
The RAPD technique has been found to be a useful and robust tool for detecting genetic diversity and determining genetic relationships within and among triticum species. In this study our main purpose was to compare the results of sharp bands with those of total bands. Because the cultivars/lines which were used in this study all are most cultivating ones and there is no distinct grouping among them, so we did not expect obvious groups among these cultivars\lines. It means that these genotypes are very similar to each other. Previous studies about marker analysis of hexaploid wheat showed that molecular markers can distinguish different kinds of wheat from each other. For example Barret and Kidwell[17] could separate spring cultivars from winter ones and hard red cultivars from soft red ones.
Some of RAPD bands are sharper than others. One explanation for this phenomenon is that sharp bands are the results of amplification of more than one locus. Since wheat is a hexaploid species, this may be true. Dendrograms which are constructed from sharp bands are very different from those of total bands. This difference is also present in PCO plots that show these two groups of bands may be different from each other naturally. Although co-phenetic correlations of sharp bands are significant but they are lower than those of total bands. So it is more reasonable to use total bands for cluster analysis instead of sharp bands. The number of sharp bands used for analysis was 45. Although it is low, but it is not unusual and for example Fahima et al.[10] with 48 polymorphic RAPD bands, (carried out data analysis). However it may be the low number of bands which had led to low co-phenetic correlations. For testing this hypothesis a subset of 45 bands randomly were selected from total bands and co-phenetic correlations were calculated (results are not shown). The low number of bands slightly reduced the co-phenetic correlations but they were much higher than those from sharp bands.
As a conclusion we can state that sharp bands are naturally different from faint bands and results show that using total bands for cluster analysis is better than using just sharp bands.
ACKNOWLEDGMENTS
The authors would like to thank the University of Tehran for financial support of this research project.
REFERENCES
- Manjarrez-Sandoval, P., T.E. Carter, D.M. Webb Jr. and J.W. Burton, 1997. RFLP genetic similarity estimates and coefficient of parentage as genetic variance predictors for soybean yield. Crop Sci., 37: 698-703.
Direct Link - Cox, T.S. and J.P. Murphy, 1990. The effect of parental divergence on F2 heterosis in winter wheat crosses. Theor. Applied Genet., 79: 241-250.
CrossRef - Pejic, I., P. Ajmone-Marsan, M. Morgante, V. Kozumplick, P. Castiglioni, G. Taramino and M. Motto, 1998. Comparative analysis of genetic similarity among maize inbred lines detected by RFLPs, RAPDs, SSRs and AFLPs. Theor. Applied Genet., 97: 1248-1255.
CrossRefDirect Link - Powell, W., M. Morgante, C. Andre, M. Hanafey, J. Vogel, S. Tingey and A. Rafalski, 1996. The comparison of RFLP, RAPD, AFLP and SSR (microsatellite) markers for germplasm analysis. Mol. Breed., 2: 225-238.
CrossRefDirect Link - Chen, H.B., J.M. Martin, M. Lavin and L.E. Talbert, 1994. Genetic diversity in hard red spring wheat based on sequence-tagged site PCR markers. Crop Sci., 34: 1629-1634.
Direct Link - Sun, G., M. Bond, H. Nass, R. Martin and Z. Dong, 2003. RAPD polymorphisms in spring wheat cultivars and lines with different level of Fusarium resistance. Theor. Applied Genet., 106: 1059-1067.
CrossRefDirect Link - Fahima, T., G.L. Sun, A. Beharav, T. Krugman, A. Beiles and E. Nevo, 1999. RAPD polymorphism of wild emmer wheat populations, Triticum dicoccoides, in Israel. Theor. Appl. Genet., 98: 434-447.
CrossRefDirect Link - Dellaporta, S.L., J. Wood and J.B. Hicks, 1983. A plant DNA minipreparation: Version II. Plant Mol. Biol. Rep., 1: 19-21.
CrossRefDirect Link - Nei, M. and W.H. Li, 1979. Mathematical model for studying genetic variation in terms of restriction endonucleases. Proc. Natl. Acad. Sci. USA., 76: 5269-5273.
CrossRefPubMedDirect Link - Jaccard, P., 1908. Nouvelles recherches sur la distribution florale. Bull. Soc. Vaud. Sci. Nat., 44: 223-270.
CrossRefDirect Link - Mace, E.S., R.N. Lester and C.G. Gebhardt, 1999. AFLP analysis of genetic relationships among the cultivated eggplant, Solanummelongena L. and wild relatives (Solanaceae). Theor. Applied Genet., 99: 626-633.
CrossRefDirect Link - Belaj, A., Z. Satovic, G. Cipriani, L. Baldoni, R.Testolin, L. Rallo and I. Trujillo, 2003. Comparative study of the discriminating capacity of RAPD, AFLP and SSR markers and of their effectiveness in establishing genetic relationships in olive. Theor. Applied Genet., 107: 736-744.
CrossRefPubMedDirect Link - Barrett, B.A. and K.K. Kidwell, 1998. AFLP-based genetic diversity assessment among wheat cultivars from the Pacific Northwest. Crop Sci., 38: 1261-1271.
CrossRefDirect Link