
Bikash C. Sarker
Not Available
Michihiro Hara
Not Available
Asian Journal of Plant Sciences
Year: 2004 | Volume: 3 | Issue: 1 | Page No.: 132-139


ABSTRACT
The response of periodic drought stress on transpiring leaf surface area, soil water absorbing area, evapotranspiration rate (ET), root hydraulic conductance (Rh) and apparent fruit yield efficiency (AFYE) of eggplant were studied for two successive years in the glasshouse condition. The soil moisture stress was imposed during 84-days growing period as no stress i.e., control (T0), periodic short-term stress (T1), periodic long-term stress (T2) and prolonged stress (T3), respectively. The result showed that stress greatly restricted ET as per its intensity and duration along with the ratio of transpiring surface area and soil water absorbing surface area. The weekly ET rate of well watered plant showed highest during 8th week (mid of reproductive stage) of growing period in both year while T1 and T2 varied due to their stress intensification, duration of re-stress and recovery. Cumulative evapotranspiration (CET) of T1, T2 and T3 plants had two, three and eight times lower than control, respectively. The ET rate of periodically stressed plant for T1 and T2 increased not fully just after day of irrigation but took one from few days to achieve its full potential. The diurnal variation of transpiration rate and Rh of root was observed separately and its rate varied due to stress effect. The short-term stressed plant T1 showed higher flow rate than that of control as well as Rh. The AFYE of T0 was increased due to frequent irrigation while AFYE for T1, T2 and T3 gradually decreased as the stress successively and periodically imposed indicating duration and intensity of stress greatly affected on economic fruit yield.
PDF Abstract XML References Citation
How to cite this article
Bikash C. Sarker and Michihiro Hara, 2004. Periodic Drought Stress Effect on Evapotranspiration, Root Hydraulic Conductance and Fruit Yield Efficiency of Eggplant. Asian Journal of Plant Sciences, 3: 132-139.
DOI: 10.3923/ajps.2004.132.139
URL: https://scialert.net/abstract/?doi=ajps.2004.132.139
DOI: 10.3923/ajps.2004.132.139
URL: https://scialert.net/abstract/?doi=ajps.2004.132.139
INTRODUCTION
Transpirational suction of the plant is the principal cause for water absorption from the soil. Soil moisture deficit and root resistance limit the transpiration as well as microclimatic factors. Water movement from the soil through plant to atmosphere is a series of interrelated and interdependent process in the Soil-Plant-Atmospheric-Continuum[1]. Transpiration is an inevitable process not only for plant processes but also for hydrological cycle. Transpiration rate of a specific plant depends on its leaf surface areas, soil moisture content, environmental factors and the magnitude of the resistances in the pathway.
The correlation of visible wilt resulted by soil drying with whole root hydraulic conductance were revealed by several investigators[2,3]. Roots can become more conducive for transpiration in response to an increasing hydrostatic pressure gradient[4]. Hydraulic conductance of root varies widely depending on their age and stage of development and on environmental conditions[5]. Root systems subjected to severe water stress often show a decrease in permeability that may persist for several days after rewatering. Root hydraulic conductance is related with transpiration. Soil moisture stress limits the conductance and, thus lesser transpiration. As a result, subsequently water deficit develop in leaf that result in permanent wilting and finally decrease or death. Root hydraulic permeability to water is and by no means fully explained. Therefore, evapotranspiration and root conductance have yet been assessed for eggplant, an economically important vegetable crop. The present investigation has focused on the quantification of transpirational demand, diurnal variation of transpiration rate and root hydraulic conductance and how ET influences on fruit yield efficiency under periodic soil moisture stress.
MATERIALS AND METHODS
Seedlings of eggplant (Solanum melongena L. cv. Senryo No. 2) about 20 cm in height with five to six leaves were used for this study purpose. Glasshouse experiments were performed culturing 40 pots with transplanted seedlings using typical volcanic ash soils at the Iwate University campus, Morioka, Japan. The experiment was conducted separately for two subsequent years (Summer, 2000 for Year-1 and summer, 2001 for Year-2). Drought stress was imposed as follows- I. T0 (Control), irrigated at pot capacity level per every week interval, ii. T1 (Short-term stress), irrigated at pot capacity level per two weeks interval, iii. T2 (Long-term stress), irrigated at pot capacity level per four weeks interval and iv. T3 (Severe stress), no irrigation applied during experimental period. The watering scheme was performed on the basis of replenishment of lost water by weight loss of experimental pot due to evapotranspiration. Plant parameters were collected 3 times at 28 days interval along with seedling stage data at the day of transplanting as an initial value. Solar radiation by pyranometer, air temperature and relative humidity were measured by dry and wet bulb measurement during whole experimental period. Leaf surface area was measured by leaf area meter and root surface area by image analysis using Lia32 software after harvested.
All of the pots were weighed 3 times a day to know their soil moisture loss at different times with an electric digital balance. These data were used to calculate the cumulative soil moisture loss for ET. As the weights of the pots were taken several times a day and weight loss at each time was calculated using their preceding weights only, possible error added through plant weight increase was indeed very minimum and was negligible. In Year-2, eight more pots in which two replications for each treatment were used for diurnal variation of transpiration rate. For this, top of each pot was carefully covered with transparent venyle sheet by rubber band and venyle tape for protecting soil evaporation loss. The pots used for measuring transpiration were weighed 12 times a day at 2 hour interval for the 36th, 37th and 38th DAT.
A pressure plate apparatus (Pressure chamber, Model: DIK-3480, Daiki Rika Kogyo Co Ltd.) was used for whole root flow rate measurement. After excising the shoot from the 3-5 cm above the crown root level by a sharp knife, the pot was placed vertically inside the chamber. The cut end of shoot with whole root system was connected to a rubber tube which is passed through the chamber wall with full of water fitted by eppendorf tube. The bare stem (3-5 cm) was sealed by silicon grease to avoid radial flow of water. Suction pressure was applied slowly and subsequently from the outside of the chamber through pressure controller. Water come out from excised root was simultaneously measured by a digital electrical balance connected with a computer. The detailed program was described in Fig. 1. For flow rate measurement of root system in water, the whole root system was separated carefully from the pot soil by washing with water and placed in the cylindrical pot with water without delay and hydrostatic pressure was applied from the outside and controlled by pressure controller.
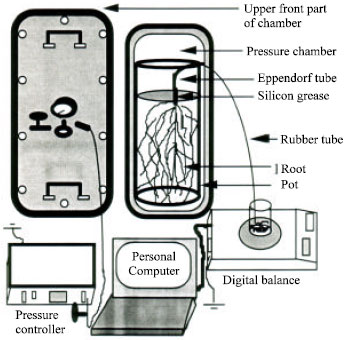 | |
| Fig. 1: | Schematic diagram of a pressure plate apparatus for root hydraulic conductance measurement |
Rh was calculated by using the formula: Rh = J/(PXL) where Rh is root hydraulic conductance expressed in mg s-1 m-1 MPa-1. J, P and L are the flow rate of water (mg s-1), applied pressure (MPa) and total root length (m), respectively.
Fruits were harvested occasionally and its weight was recorded for final fruit yield during different times of growing period. AFYE was obtained from the fresh fruit weight divided by unit water use per plant. Calculated results obtained on all the parameters expressed as an average of three replications and LSD(P≤0.05) was performed accordingly.
RESULT AND DISCUSSION
Ratio of transpiring leaf surface area and soil water absorbing surface area: Table 1 shows the ratio of transpiring leaf surface area and absorbing surface area of eggplant root for Year-1 and Year-2. The consistent feature of this table is that the ratio for both years decreased at 28 DAT. It indicated the root surface area increased more rapidly than leaf surface area i.e., root growth was higher than leaf growth. The absorbing surface area increase was so remarkable as it absorbed much water for their growth and translocation of food materials. At 56 DAT, the ratio increased than 28 DAT indicating higher growth of leaf area that able to transpire higher amount of water and to capture higher solar energy for growth and development.
| Table 1: | Ratio of transpiring and absorbing surface area of eggplant under different periodic soil moisture stress |
 | |
| Table 2: | Relative fresh fruit yield of eggplants under different periodic moisture stress |
 | |
Finally T1, T2 and T3 decreased leaf area due to different stress levels and duration, thus showed lower ratio in both years experiment.
Cumulative evapotranspiration and evapotranspiration rate: The CET and weekly average ET rate during the experimental period of Year-1 and Year-2 under different soil moisture stress was shown in Fig. 2. The CET of eggplant increased as the plant growth increased irrespective their soil moisture stress (Fig. 2a and b). In this figure, the highest CET was observed for T0 followed by T1, T2 and T3, respectively. It is note that the CET distinctly started to differ from the 3rd week of 1st 28-days growing period. In case of T1, T2 and T3, increase in CET was lower than T0. From 28-56 DAT study period, CET increase was almost negligible for T3. Conversely, in case of control plant, CET continued to increase distinctly up to its last day of study period. T1 and T2 plants, those receiving irrigation 2-weeks and 4-weeks interval, CET were much pronounced just after watering and then subsequently decreased due to reduced soil moisture content in the pot. CET of T1, T2 and T3 plants had two, three and eight times lower than control.
 | |
| Fig. 2: | Cumulative evapotranspiration and evapotranspiration rate for different stressed plants during the different times of the experimental period of Year 1 and Year 2 |
The relative water loss by all plants were almost similar during early growth stages but soon it differed due to different watering frequency and the length of stress period that vitally affect plant growth. In both years, the CET of eggplant for T0 plant was very high compared to others. This was due to growing them under well-watered conditions. Under the conditions of both experiments, the atmospheric evaporative demands for water were little different due to different microclimatic variables. The amount of lost water supplied and water extraction ability of the plants, which in tern, might largely be related to their root growth could provide a satisfactory explanation of the observed differences. At soil moisture stress situation, a drier soil might be adverse for a plant to fulfill its ET at a required rate in two ways. Water supply capability of a drier soil might be insufficient to meet ET demand of a growing plant especially during its peak period of water use which resulted in stomatal closure. Furthermore, under certain drier condition, there was a greater difficulty to extract water due to capillary barrier. As water is removed by plants or evaporation from the soil surface, the films of water remaining around the soil particles become thinner and are held by the soil particles more tightly. When the surface tension becomes high enough, the eggplant was unable to take up any of the remaining water and permanent wilting results[5]. Such physical barrier within soil particles and roots occurred in both years experiment and various levels of soil moisture stress that might hamper satisfactory root growth to an accountable extent and hence, could result in reduced water extraction. Thus, the eggplant could not transpire at their full potential as their stomata began to close as well as temporally wilting which could readily be occurred when transpiration rate exceeds the rate of water supply to the leaves. These effects on water use were prominent for the case of periodic short-term, periodic long-term and prolong stressed plants. As a result CET of such stressed plants was lower than control plants.
The average ET rate per week for different plants under various soil moisture stresses was shown in Fig. 2c and d. The result showed that ET rate of 1st week was almost similar in all plant but it started to vary distinctly from 2nd week and afterwards. ET rate for the plant receiving frequent irrigation was always higher than that of others. Thus, the highest ET rate per week was always found in control plant and simultaneously the lowest ET rate was recorded for severe stressed plant (T3). A significant variation in average ET per week was found in eggplant under various stress levels and also stress recovering and re-stress period during experiment with the advancement of plant growth. The highest ET rate was during the highest plant development stage at the 8th week, then slight decreased rate during latter period. Weekly fluctuation was observed in T1 plant whereas T2 plant abruptly fell and reached its lowest at every 4th week of each irrigation-drying cycle. It is interesting that ET rate of T1 and T2 plant decreased as the stress sensitivity and duration increased and it began to increase ET but not highest as before just after rewatering. It might be due to loss of capability to absorb soil moisture just after rewetted due to stress injury. This is in agreement with the findings of Brix[6] and Kramer[7] that likely as a result of plants subjected to severe water stress usually do not regain their full capacity to absorb until several days after the soil in rewetted. ET rate reduction due to water deficit conditions was also reported in tomato seedlings[8] and for potato[9]. Reduced rate of ET in stressed plant was observed in the present investigation although their amount and time of reduction varied during the experimental (Fig. 2c and d).
 | |
| Fig. 3: | Diurnal variation of transpiration rate for different eggplants (a) and atmospheric conditions of glasshouse in the year of 2001 (b) for the specific 3-days experiment period |
 | |
| Fig. 4: | Root water flow rate at pressure chamber for 56 DAT controlled eggplant. a, b and c represented the flow rate at pot condition, diurnal variation at pot saturated condition (No pressure applied) and cumulative flow under different applied pressure at pot saturated condition, respectively |
 | |
| Fig. 5: | Flow rate of water under different applied pressure in the pressure chamber. a, b and c represented the diurnal variation of flow rate for T0, T1 and T2 plants while d, e and f represented for cumulative flow of water under different applied pressure, respectively |
Highest ET rate was always registered in the plants which were well-watered and with frequent irrigation.
Diurnal variation in transpiration rate: Transpiration rate at two hours interval with same environmental conditions under the similar water stress treatment was performed during the 36th, 37th and 38th DAT in Year-2. The results for this particular study have been presented in the Fig. 3. The transpiration rate at two hour interval as well as diurnal fluctuation of microclimatic variables was shown simultaneously in Fig. 3a and b. The eggplant under different stress demonstrated a significant variation in transpiration rate during day time but not in night time. This suggested that water absorption occurred chiefly during day-time. Further more, it showed that solar radiation had the direct relationship on transpiration rate in the present study (Fig. 3b). Diurnal fluctuation of transpiration rate among the different stressed plants was also distinct.
Root hydraulic conductance: Rh was observed at pot soil and free water condition in the pressure apparatus. Rh of whole root systems differed due to applied pressure difference. Under pot culture, flow rate was only observed within the range of 0.04 to 0.05 MPa (400-500 cm) hydrostatic pressure but above this range, flow rate measurement was greatly hampered due to radial and vertical air flow through soil and roots (Fig. 4a). Fig. 4b shows the rhythmic pattern of flow rate in pot soil under saturated condition. Diurnal fluctuation was also conspicuous just after excising the shoot but gradually this phenomenon was disappeared. This is likely appeared to be due to kinetic activity of biochemical process which ceased or inactive after few days. Conductance was low just after starting the measurement at night but it increased at day time and again started to decline. Highest flow rate was at noon while lowest was recorded at mid night. The result shows that flow rate is 5 to 8 times higher at noon than evening and dawn. Cumulative flow rate was shown in Fig. 4c under applied different pressure. Flow rate increased under subsequent increase in applied pressure. No rhythmic phenomenon was observed while pressure was applied subsequently.
Fig. 5 shows the flow rate of whole root systems under applied pressure in free water conditions. Fig. 5a, b and c showed the fluctuation of flow rate in free water just after detopping and washing the root. Highest amount of flow was demonstrated by T1 followed by T0 and T2. T3 root system that experienced severely prolonged stress was completely inactive to conduct water as well as fluctuation (Data not shown). No fluctuation and minimum flow rate was demonstrated by T2 root systems. It might be due to repetitive long-term stress that indicated the inactivity or lower activity.
 | |
| Fig. 6: | Root hydraulic conductance for different stressed eggplant root systems under various applied pressure |
 | |
| Fig. 7: | Apparent fruit yield efficiently of different eggplants (Fresh weight basis, FW) for Year-1 (a) and Year-2 (b) |
Diurnal cycling in root resistance (Inverse of Rh) to water movement was reported by Parsons and Kramer[10] and they revealed that this variation was appeared to be controlled by signals from shoots. Further more, changes in the root resistance in relation to cycling in stomatal opening was observed by Hopmans[11] and Barrs and Klepper[12]. Consistent feature of flow rate in free water was also observed after application of different pressure at different times as like as flow rate of root in. Flow rate increased in response of intensity of applied pressure in to the pressure chamber. Fig. 5 also showed the similar feature in cumulative flow rate of whole root systems for different stressed plants. T1 plant showed highest cumulative flow rate followed by T0 and T2, respectively. Flow rate of T1 root system was comparatively higher. Fig. 6 shows the difference in hydraulic conductance of eggplant root systems. Likewise flow rate, Rh also higher in T1 roots followed by T0 and then T2. Higher Rh for T1 is likely due to formation of new roots after 3rd irrigation-drying cycle which indicating the stress recovery. In case of T0, root was seemed to be partially suberized and experienced little stress as because the transpirational demand during the end of irrigation-drying cycle of latter growing period was so higher than the water supplied.
Relative fruit yield and apparent fruit yield efficiency: Relative fruit yield on fresh weight basis of Year-1 and Year-2 was summarized in Table 2. The results showed that fresh fruit yield significantly reduced in response of water deficit in the soil in both years experiment. As the time proceed and plant development, the moisture stress greatly affected on fruit yield. In Year-1, T0 showed higher yield than other plant but statistically similar with T1. Similarly, yield performance of T1 was similar with T2 but greater than T3. T2 and T3 had no difference in respect to yield performance. In 84 DAT, T0 significantly had better performance than T1, T2 and T3 plants. Stress greatly reduced fruit yield of T1, T2 and T3 plants and had no significant difference among these plants. Similarly in Year-2, at 28 DAT T1 plant showed higher yield while at 56 and 84 DAT, T0 significantly achieved higher yield than others. This result indicated that the soil moisture stress greatly hampered the relative production of fresh fruit yield for eggplant. At 84 DAT, T0 showed greater yield ability than other stressed plant as evidenced by LSD(P≤0.05).
The result showed that the periodic drought stress either for short-term, long-term or prolonged time significantly decreased AFYE per unit water use (Fig. 7). Fig. 7a and b showed that almost similar pattern in AFYE in both years experiment. In Fig. 7a, T1 showed higher efficiency at 28 and 56 DAT while T0 had higher efficiency at 84 DAT. In Year-2 frequent application and sufficient water in soil increased efficiency at 56 and 84 DAT. Lowest efficiency was demonstrated by T3 which suffered from severe moisture deficiency for prolonged time. This result also emphasized that ultimate fruit yield efficiency was severely restricted due to moisture stress.
To the conclusion, the stress affected on the ratio of transpiration surface area and soil water absorbing surface area which might be the cause for reduced evapotranspiration rate of different stressed plants. The imposed periodic drought reduced the root hydraulic conductance and restricted the ability of water translocation through roots to the leaves that might be the additives of lower evapotranspiration. The water stress subsequently lowered the evapotranspiration and caused lower economic fruit yield resulting in less apparent fruit yield efficiency. The result also suggested that net economic yield increased due to frequent irrigation and enhanced to increase ultimate fruit yield efficiency per unit water use.
ACKNOWLEDGMENTS
This study was supported in part by a Grant-in-Aid for scientific research from the Ministry of Education, Science, Sports and Culture of Japan.
REFERENCES
- Miyamoto, N., E. Steudle, T. Hirasawa and R. Lafitte, 2001. Hydraulic conductivity of rice roots. J. Exp. Bot., 52: 1835-1846.
Direct Link