
Naeem Khan
Not Available
Gul Hassan
Not Available
Muhammad Azim Khan
Not Available
Ikramullah Khan
Not Available
Asian Journal of Plant Sciences
Year: 2003 | Volume: 2 | Issue: 3 | Page No.: 305-309


ABSTRACT
A field experiment was conducted during 2000-01, to investigate the effectiveness of different herbicides for controlling weeds in wheat. Significant differences were observed among the times of application for weed density after herbicidal treatments and number of tillers plant-1. Similarly significant differences were recorded for herbicidal treatments in the traits like weed density after herbicidal application and number of tillers plant-1. The interactions of times of application and herbicides were significant for weeds density after herbicidal application and number of tillers plant-1. The 45 DAS herbicidal application time was best for tillers plant-1. As a whole the herbicidal application at 45 DAS provided excellent weed control. Weeds were most effectively controlled by buctril-M + topik, isoproturon alone and logran + topik. None of the herbicides except isoproturon 75 WP at 30 DAS application had a phytotoxic effect on the wheat crop. Highest number of tillers plant-1, were produced by buctril-M + topik and logran + topik as compared to weedy check.
PDF Abstract XML References Citation
How to cite this article
Naeem Khan, Gul Hassan, Muhammad Azim Khan and Ikramullah Khan, 2003. Efficacy of Different Herbicides for Controlling Weeds in Wheat Crop at Different Times of Application-I. Asian Journal of Plant Sciences, 2: 305-309.
DOI: 10.3923/ajps.2003.305.309
URL: https://scialert.net/abstract/?doi=ajps.2003.305.309
DOI: 10.3923/ajps.2003.305.309
URL: https://scialert.net/abstract/?doi=ajps.2003.305.309
INTRODUCTION
Wheat, the king of cereals, plays an important role in the agricultural system of Pakistan. It is used as major foods source all over the world and is the staple food of Pakistan and meets the major dietary requirements. The integrated efforts of different government agencies have fortunately been successful during the past three years in not only achieving self-sufficiency in food but also leaving an export surplus of lacs of tons. The major interventions resulting in a quantum jump in production have been the balanced use of fertilizers, better availability of certified seed of high yielding cultivars and are importantly the introduction of topik 15 WP and Puma super 75 EW grass killers for effective management of grassy weeds particularly wild oats. Still there exists a gap between the potential and actual yields. The major bottlenecks for these gaps are nutrition, availability of irrigation water and supply of pure seed, but the most challenging one is the weed competition. Weeds share the available soil fertility, moisture, nutrients, space and sunlight with the crop plants, which result in the yield reduction. Bernal (1982) reported that good control of Avena fatua and Phalaris minor was achieved with the application of isoproturon. Similarly Khan et al. (1999) concluded that logran, tolkan and buctril-M proved to be the best in controlling weeds in wheat. Pervaiz and Quazi (1992) reported that 17.25% losses are caused to wheat crop by weeds. The losses on annual basis in wheat amount to more than Rs. 28 billion at national level and Rs. 2 billion in NWFP (Hassan and Marwat, 2001).
In view of the importance of the weed problem and relevance to the national economy, this experiment was conducted to investigate the effectiveness of different herbicides for controlling weeds in wheat.
MATERIALS AND METHODS
The research work was conducted at Malkandher Research Farm, NWFP Agricultural University, Peshawar during the rabi season 2000-01. The experiment was laid out in split plot in RCB design with three replications. In each replication, there were three main plots. Each main plot consisted of seven sub-plots of five meter long. The number of rows in each sub-plot was five, spaced at 30 cm. The time of herbicidal application were kept in main plots while the herbicidal treatments were assigned to the sub-plots. The seed was sown @ 120 kg ha-1 with the help of hand hoe. The detail of the treatments was as under;
| A: | Times of herbicidal application (main plots) Thirty days after sowing (30 DAS) Forty five days after sowing (45 DAS) Sixty days after sowing (60 DAS) |
| B: Herbicidal treatments (sub-plots) | |
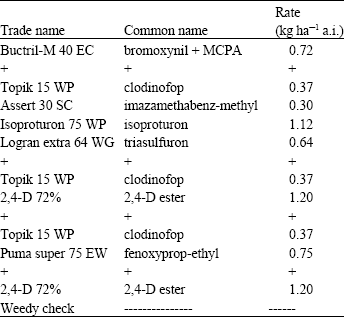 | |
All the herbicidal treatments were applied post-emergence with the help of knap sack sprayer. In order to determine the effect of the aforesaid treatments, data were recorded on the parameters like weed density m-2 before application of herbicides, weed density (%) m-2 after application of herbicides, tillers plant-1, days to 50% heading and plant height (cm).
Weed density m-2 was counted at three randomly selected places in each sub-plot before herbicidal spray and after the herbicidal spray with the help of a quadrat (0.5 x 0.5 m2) in size and subsequently the average values were converted to the density m-2. Weed density m-2 after herbicidal application was randomly counted at three places in each sub-plot with the help of quadrat and subsequently average values were converted to density m-2. In both cases the date was recorded individually for each species.
For recording tillers plant-1, 10 representative plants were selected randomly in each sub-plot and numbers of tillers per plant were counted and finally averages were taken.
Days to 50% heading were recorded when the wheat crop was visually observed in the field at reproductive stage when wheat crop has 50% headed. The days from sowing till that date were computed and recorded.
Similarly for recording plant height (cm) at maturity, ten representative plants were selected randomly from each treatment and the height of the plants was measured from the ground surface to the growing point.
The data recorded individually for each parameter were subjected to statistical analysis and means were separated by using Fisher’s protected LSD test (Steel and Torrie, 1980).
RESULTS AND DISCUSSION
Weeds density (m-2) before and after application of herbicides: Non-significant differences were observed among herbicidal application, herbicidal treatments and their interaction (Table 1). The number of weeds m-2 was almost the same across all the application times and herbicidal treatments and the existence of weeds distribution was even before application of herbicides. The data showed that as the crop growth advanced, the number of weeds increased very slightly. Moreover the weeds density was maximum at the second and third application time and minimum in the earlier time of herbicidal application. Statistical analysis of the data regarding weeds density m-2 after application of herbicides revealed that time of application, herbicidal treatments and their interaction had significant differences (Table 1). Among the times of application, the minimum density of weeds m-2 (25.38) was recorded when the herbicides were applied at 45 DAS. While maximum weeds density m-2 (31.89) was recorded when herbicidal applications were carried out at 60 DAS. For the herbicidal treatments, maximum density (80.26) were observed in weedy check plots while minimum density (12.20) was observed in plots treated with buctril-M + Topik mixture. In interaction, the lowest density (3.76) was recorded in buctril-M +Topik x 45 DAS application while the highest density (82.43) was observed in weedy check x 60 DAS. The highest weeds density in latter interaction was however, statistically at par with the weedy check at 45 DAS application (Table 1). It was noted that buctril-M + topik followed by isoproturon and logran extra + topik controlled maximum weeds in wheat crop. Maximum weeds were observed in weedy check plots. These results are in conformity with the results reported by Phogat et al. (1991). The 45 DAS application time was found to be the most susceptible followed by 30 DAS herbicidal application. Maximum number of weeds after herbicidal application were found in 60 DAS herbicidal application time. Similar results were reported by Samar et al. (1993) and Yaduraju and Ahaju (1991). The interaction of herbicides and time of application showed that buctril-M + topik when applied 45 DAS, controlled the maximum weeds followed by isoproturon when applied 30 DAS and logran extra + topik when applied 45 DAS. Maximum number of weeds were observed in weedy check at 60 DAS. These results are in analogy with the work of Balyan et al. (1992) and Samar et al. (1993).
Number of tillers plant-1: Statistical analysis of the data showed that number of tillers plant-1 was significantly affected by different times of herbicidal application, herbicidal treatments and their interaction (Table 2).
| Table 1: | Weeds density (m-2) before and after herbicidal application at different times |
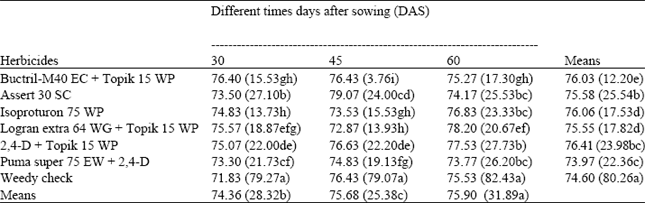 | |
 | |
| Table 2: | Number of tillers per plant as affected by herbicidal application at different times |
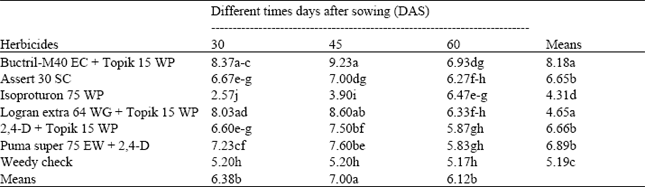 | |
 | |
| Table 3: | Days to 50% heading of wheat as affected by herbicidal application at different times |
 | |
| Table 4: | Plant height (cm) of wheat as affected by herbicidal application at different times |
 | |
Among the times of herbicidal application, the highest number of tillers (7.00) plant-1 were observed when herbicides were applied 45 DAS while lowest number of tillers (6.12) plant-1 were recorded when the herbicides were applied 60 DAS. Maximum number of tillers (8.18) plant-1 were recorded in buctril-M+topik mixture treated plots while minimum number of tillers (4.31) plant-1 were observed in plots treated with isoproturon followed by weedy check plots which produced 4.31 and 5.19 tillers plant-1, respectively. Their interaction showed that buctril-M+topik mixture applied 45 DAS produced maximum of 9.23 tillers plant-1 while minimum tillers (2.57) plant-1 were recorded in isoproturon treated plots at 30 DAS and 45 DAS followed by the weedy check plots at all the three times of application. These results are in analogy with those reported by Ahmed et al. (1999), they reported that application of buctril-M increased tillers plant-1 isoproturon applied 30 DAS found phytotoxic. Baldha et al. (1988) also reported the same.
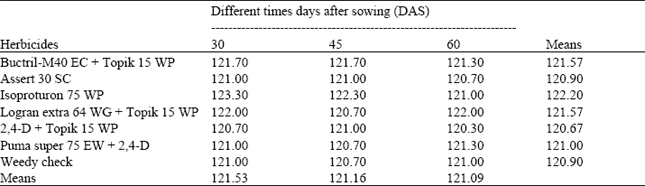
Days to 50% heading: Statistical analysis of the data indicated that time of herbicides application, different herbicidal treatments and their interaction did not affect the days to 50% heading (Table 3). However, maximum (121.53) days to 50% heading were observed when herbicides were applied 30 DAS while minimum (121.09) days to 50% heading were recorded when herbicides were applied 60 DAS after sowing. Maximum days (122.22) to 50% heading were observed in plots treated with isoproturon while minimum days (20.89) were observed in plots sprayed with 2,4-D, topik and weedy check plots. In case of their interaction, maximum (123.30) days were recorded when the isoproturon was applied 30 DAS and minimum (120.67) days to 50% heading were recorded when 2,4-D + topik were applied 60 DAS. Herbicidal treatments, time of herbicidal application and their interactions showed non significant differences for days to 50% heading when statistically analyzed at 5% level of significance. However, maximum (122.20) days to 50% heading were observed for 2,4-D + topik treated plots. But Khalil et al. (1999) reported that the application of herbicides affected the 50% heading of the wheat.
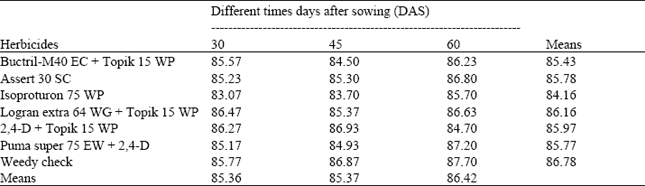
Plant height (cm): Statistically non-significant differences were observed among times of application, different herbicidal treatments and their interactions (Table 4). However, maximum (86.42 cm) plant height was recorded when herbicides were applied at 60 DAS. While minimum (85.36 cm) height was recorded when the herbicides were applied 30 DAS. In case of herbicidal treatments, maximum plant height (86.78 cm) was observed in weedy check while minimum plant height 84.16 cm was recorded in isoproturon treated plots. Their interaction showed that maximum plant height (86.93 cm) at maturity was recorded when 2,4-D + topik was applied 45 DAS while minimum (83.07 cm) was observed in plots receiving isoproturon 30 DAS. Non significant differences for plant height were observed among herbicidal treatments at different times of application. Ahmed et al. (1999) also reported that plant height (cm) was strongly under genetic control and not significantly affected by herbicide application.
REFERENCES
- Balyan, R.S., R.K. Malik and R.S. Panwar, 1992. Effects of rates, times and methods of application of tralkoxydim on wild oat in wheat. Trop. Pest Manage., 38: 411-415.
Direct Link - Khalil, S.K., A.Z. Khan, A.R. Baloch and P. Shah, 1999. Effect of row spacing and herbicides application on some agronomic characters of wheat. Sarhad J. Agric., 15: 535-540.
Direct Link - Khan, M.A., M. Zahoor, I. Ahmad, G. Hassan and M.S. Baloch, 1999. Efficacy of different herbicides for controlling broadleaved weeds in wheat. Pak. J. Biol. Sci., 2: 732-734.
Direct Link - Samar, S., S. Samunder, R.K. Malik, S. Vireshwar, R.S. Banga, S. Singh and V. Singh, 1993. Evaluation of tank mixture of isoproturon and diclofop methyul in wheat integrated weed management for sustainable agriculture. Proceedings of the International Symposium on Indian Society of Weed Science, Nov. 18-20, Hisar, India, pp: 179-181.