
Rana Muhammad Iqbal
Not Available
Asian Journal of Plant Sciences
Year: 2003 | Volume: 2 | Issue: 15 | Page No.: 1092-1096


ABSTRACT
A solution culture pot study was carried out to see the effect of two contrasting salt species i.e., NaCl and Na2SO4 on leaf extension growth of spring wheat. Na+ concentrations in both the salt species were 0, 50, 100 and 200 mM. No interaction between salts and concentration was observed for leaf extension growth of all leaves. It was also observed that NaCl treated leaves 9 were significantly shorter than Na2SO4. In each leaf as Na+ concentration increased leaf extension growth decreased. However, the difference in treated plants was non-significant. A drastic reduction in leaf extension growth was observed in 200 mM Na+ concentration from leaf 4 to 6. For leaves 7, 8, 9 and flag leaf, leaf extension growth was not observed in 200 mM Na+ concentration because it suppressed the growth and the plants died earlier.
PDF Abstract XML References Citation
How to cite this article
Rana Muhammad Iqbal, 2003. Leaf Extension Growth of Wheat Grown Under NaCl and Na2SO4 Salinity. Asian Journal of Plant Sciences, 2: 1092-1096.
DOI: 10.3923/ajps.2003.1092.1096
URL: https://scialert.net/abstract/?doi=ajps.2003.1092.1096
DOI: 10.3923/ajps.2003.1092.1096
URL: https://scialert.net/abstract/?doi=ajps.2003.1092.1096
INTRODUCTION
Wheat crop is one of the major cereals grown under arid and semi-arid regions of the world. Salinity is the major threat to crop production in these regions. However, wheat is moderately tolerant to soil salinity but the ECe should not exceed 4 mmhos cm-1 in the upper soil layer during germination. Yield decrease due to salinity is 0% at ECe 6.0,10% at 7.4, 25% at 9.5, 50% at 13 and 100% at ECe 20 mmhos cm-1 (F.A.O., 1980).
With the increasing pressure of population in developing countries, marginal land is brought under cultivation to satisfy the ever-increasing demands for food fuel and fiber. In arid and semi-arid regions, there is a chronic shortage of water. Hence, brackish and underground water is used to supplement the water requirements of crops in addition to canal irrigation, which results in increase of salt build up in root zone and water logging in soils. This alarming link between salinity and irrigation reflects the cumulative affect over decades to centuries of adding water on to the soil in order to grow crops in regions where rainfall is otherwise inadequate.
In salt affected soils, patches of salt crusts are a common feature, which makes it difficult to estimate exactly how much land is salt affected, largely due to problems of soil mapping. Estimates of the extent of saline soils vary widely between 3.4 million (Ponnamperuma, 1984) and more than 9 million Km2 (Massoud, 1974; Kovda, 1980). Out of these saline soils, 2.3 x 10⁶ km2 are moderately saline and these soils have crop production possibilities (Ponnamperuma, 1984). According to another estimate about 13% (Mudie, 1974) of land under cultivation (149.7 x 10⁶ km2: F.A.O., 1978) and 30 to 50% of irrigated land (from 2.3 to 2.4 x 10⁶ km2: Kovda, 1980) is salt affected (Mass and Hoffman, 1977; Kovda, 1980).
Out of 79.61 m ha of the geographical area of Pakistan, only 20.18 m ha are being cultivated. An area of 14.5 m ha is irrigated; about 11.0 million by canals and 3.5 million by tubewells. About 5.7 million hectares are salt affected, out of which 56% are saline-sodic (Muhammad, 1978, 1983). In Pakistan, wheat is grown where salinity, sodicity, water logging and aridity are the major constraints responsible for low crop productivity.
Ions which contribute to soil salinity include Cl¯, SO42¯, HCO3¯, Na+, Ca2+, Mg2+ and rarely, NO3¯ or K+. Most saline soils are high in Cl¯ and Na+, though there are some soils in which the soluble salts consist mainly of Na+ and Mg2+ sulphates (Richards, 1954). According to a study conducted by Shahid (1988), the salinity problem in Pakistan is mainly due to sulphates and chlorides and only partly due to carbonates and bicarbonates as these are relatively insignificant as compared to other anions. He found that SO42¯ is dominating in all the salt crusts over the other anions. Among the cations Na+ is dominant in all the salt crusts, accompanied by variable amounts of K+, C2+ and Mg2+. He concluded that sulphate minerals of sodium are dominant in soils of Pakistan, with lesser amounts of chlorides, whereas chloride is found as the second dominant anion.
Most of the research work conducted on salt tolerance in crop plants uses NaCl in solution culture, which does not reflect true picture of salinity problem. Hence, it was contemplated in this preliminary investigation to see the effect of two contrasting salt species, i.e. NaCl and Na2SO4 on leaf extension growth of spring wheat.
MATERIALS AND METHODS
A solution culture pot study was carried out at University Farm, Aber, University of Wales, Bangor, United Kingdom to see the effects of two contrasting salt species on the growth and physiology of spring wheat. The test variety was Wembley whereas two salt species were NaCl @ 0, 50, 100 and 200 mM and Na2SO4 @ 0, 25, 50 and 100 mM concentrations. In this experiment Na+ concentrations were comparable to 0, 50, 100 and 200 mM in both salt species, hence the individual effects of Cl¯ and SO42+ ions can be postulated. The experiment was conducted under glass-house conditions with no control of temperature and no supplementary lightings. Seeds of spring wheat variety Wembley were soaked for overnight in capillary matting under tap water during second week of July. Sprouted seeds were transferred to capillary matting on plastic supports, suspended over well-aerated tap water containing 5 g of “Phostrogen”. Seven days old seedlings were transferred block by block during 3rd week of July to black painted plastics pots having 10L water capacity. The plants were supported by foam in 16 round holes at distance of 4.5 cm in black painted polystyrene sheets placed over the pots. In case of NaCl 4 Molar stock solution was made, while Na2SO4 could only be dissolved up to 2 Molar. After two days of seedling establishment, salt stress was imposed by adding ½ dose in the first instance. The final dose was added after 3rd day of the first dose.
A modified Long Ashton Nutrients solution was used in combination with ‘Phostrogen’ (Phostrogen Limited, Corven, Clwdy, U.K.), a blended 10-10-27% NPK fertilizer, with 1.3% Mg2+, 0.4% Fe3+ and 200 mg kg-1 Mn2¯. Five grams of ‘Phostrogen’ were added in 10 L of water directly into each pot at the time of transplanting while 10 grams were added directly into each pot at the time of solution change after 21 days of transplanting. Stock solutions of FeEDTA (monosodium complex), MnSO4.4H2O, CuSO4.5H2O, ZnSO4.7H2O, H3BO3 and Na2MoO4.2H2O were made as 37.33, 22.3, 2.5, 2.9, 31.0, 58.5 and 1.21 g L-1, respectively. The composition of micronutrient in stock solution was: Fe 2.8, Na 1.0; Mn 0.55; Cu 0.064; Zn 0.065; B 0.54 and Mo 0.048 ug cm-3, respectively.
It was observed during solution renewing that Na2SO4 stock solution solidified quickly as soon as it came in contact with air, which needed a vigorous shaking. Keeping this difficulty in mind both NaCl and Na2SO4 salts were directly added to individual pot according to the layout of experiment.
For growth measurements, 4 central plants out of 16 of each pot were used. Leaf extension growth (LEG) of leaves on main stem was measured with ruler every day starting from the following day after adding final dose of the salt concentrations. Leaf extension growth measurements were started from leaf four (L4) because the seedlings were at this stage after transplanting. Extension measurements of L4 were recorded from ligule of leaf two (L2). Similarly LEG of L5 was recorded from ligule of L3 and so on upto L9 i.e. measurements of each leaf were recorded from ligule of two positions down. In case of flag leaf which was different in some plants even within the same treatment, the same procedure was followed. Mostly leaf 9 was flag leaf which was measured from ligule of leaf 7 but in some cases leaf 8 was flag leaf which was measured from ligule of leaf 6.
In this study leaf extension growth was measured as increase in length but this was not the true length because measurements were carried out relative to the ligule of the leaf, two positions down on the main stem. Measurements of leaf extension growth were started from leaf 4 and it continued up to full expansion of flag leaf.
The statistical analysis of the data was performed by the analysis of variance method. When a significant ‘F’ value was obtained for treatment effect, Tukey’s test at 5% probability level was applied to the treatment means (Snedecor and Cochran, 1980). In the figures, the vertical bars indicate the value of the least significant difference for comparison between treatment means at the last date of measurements.
RESULTS
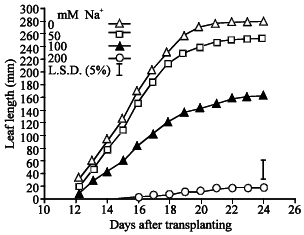
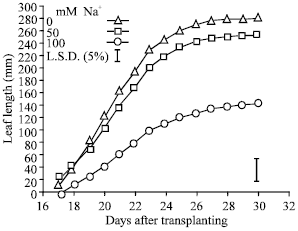
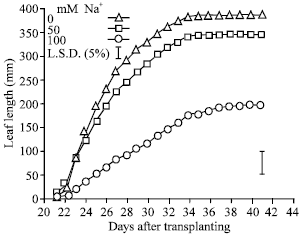
The effects of Na+ concentration on leaf extension growth of leaves 4 to 9 and flag leaf are shown in Fig. 1-7. In each leaf as Na+ concentration increased leaf extension growth decreased. However, the difference in treated plants was non-significant. A drastic reduction in leaf extension growth was observed in 200 mM Na+ concentration from leaf 4 to 6. For leaves 7, 8, 9 and flag leaf, leaf extension growth was not observed in 200 mM Na+ concentration because it suppressed the growth and the plants died earlier.
During the course of study, no significant effect of salt species on leaf extension of leaf 4 to 8 was observed. In leaf 9, NaCl checked the leaf growth and it reached to maximum size 35 days after transplanting while Na2SO4 promoted leaf growth and it continued up to 43 days after transplanting. It was also observed that NaCl treated leaves 9 were significantly shorter than Na2SO4.
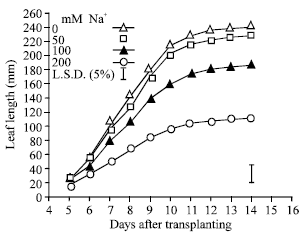 | |
| Fig. 1: | Effect of Na+ concentrations on extension growth of leaf 4 |
 | |
| Fig. 2: | Effect of Na+ concentrations on extension growth of leaf 5 |
 | |
| Fig. 3: | Effect of Na+ concentrations on extension growth of leaf 6 |
 | |
| Fig. 4: | Effect of Na+ concentrations on extension growth of leaf 7 |
 | |
| Fig. 5: | Effect of Na+ concentrations on extension growth of leaf 8 |
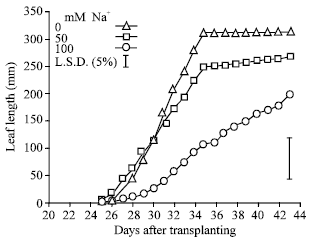 | |
| Fig. 6: | Effect of Na+ concentrations on extension growth of leaf 9 |
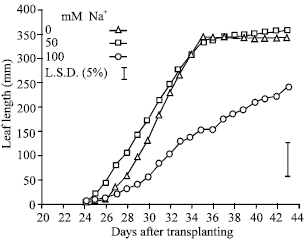 | |
| Fig. 7: | Effect of Na+ concentrations on extension growth of flag leaf |
The final length of leaf 9 in case of NaCl treatment was 198.0 mm whereas for Na2SO4 it was 321.0 mm. For NaCl the final length measurements of flag leaf were 296.1 mm whereas for Na2SO4 it was 333.0 mm and this difference was non-significant.
DISCUSSION
During this short duration study, no interaction between salts and concentration was observed for leaf extension growth of all leaves. The results show no evidence that NaCl is more toxic than Na2SO4 for this parameter. The results reveal that both the salt species i.e. NaCl and Na2SO4 similarly decreased the extension growth of various leaves. It was also observed that in NaCl leaf 9 reached to maximum size earlier than in Na2SO4 where it continued to grow. These results suggest that the increased build up of Cl¯ ions in plant leaves might have occurred with passage of time (Iqbal, 1988). Moreover, the higher Na+ concentrations in both the salt species caused a significant reduction in leaf extension growth, may be due to increase in osmotic pressure. These findings are in line with the work of other researchers (Matsuda and Riazi, 1981) who concluded that leaves grow more slowly after exposure to salinity because of water deficit. In NaCl, the last leaves were found smaller and reached their maximum size earlier than in Na2SO4. This may be due to the reason that the amount of C1¯ is double in NaC1 than SO42- in Na2SO4 at the same Na+ concentrations (Iqbal, 1988). In addition the mobility of C1¯ is considered rapid as compared to SO42- because the latter is heavier (Magistad et al., 1943, Bernstein, 1975, Mahajan and Sonar, 1980). It has been reported that NaCl salinity decrease K+ concentration in many species (Story and Wyn Jones, 1978), which is an essential nutrient to the shoot and it could limit cell expansion and growth. NaCl usually reduce NO3¯ concentration in leaves (Torres and Bingham, 1973; Khan et al., 1995). Increasing the NO3¯concentrations in the external medium can improve growth of plants but Glass and Siddiqi (1985) have found that the beneficial effect of NO3- may be due to its reducing C1- uptake rather than to it’s supplementing the nitrogen supply to the plant. Torres and Bingham (1973) also found that wheat and tomato had lower leaf C1¯ when the external NO3¯ concentrations were increased.
REFERENCES
- Maas, E.V. and G.J. Hoffman, 1977. Crop salt tolerance-current assessment. J. Irrig. Drainage Div., 103: 115-134.
Direct Link - Matsuda, K. and A. Riazi, 1981. Stress-induced osmotic adjustment in growing regions of barley leaves. Plant Physiol., 68: 571-576.
PubMed