
Mohanad F. Al-Khasawneh
Department of Mathematics, Statistic and Physics, Qatar University, Doha, Qatar
Asian Journal of Mathematics & Statistics
Year: 2010 | Volume: 3 | Issue: 1 | Page No.: 1-15


ABSTRACT
We proposed several estimators for the negative binomial dispersion parameter. The proposed estimators are combinations of existing ones using appropriate weights. We then compare, by simulation, the biases and efficiencies of the proposed estimators with those of the method of moments estimators and the maximum quasi-likelihood estimators. The simulation results indicate that the proposed estimators perform well in terms of biases and efficiencies in many instances. We conclude from this study that the combined estimators significantly reduce the mean bias of the estimators and more efficient than existing estimators. The relative efficiencies of all the combined estimators increases as the sample size increases.
PDF Abstract XML References Citation
How to cite this article
Mohanad F. Al-Khasawneh, 2010. Estimating the Negative Binomial Dispersion Parameter. Asian Journal of Mathematics & Statistics, 3: 1-15.
DOI: 10.3923/ajms.2010.1.15
URL: https://scialert.net/abstract/?doi=ajms.2010.1.15
DOI: 10.3923/ajms.2010.1.15
URL: https://scialert.net/abstract/?doi=ajms.2010.1.15
INTRODUCTION
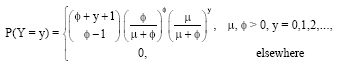
The negative binomial random variable Y is a non-negative discrete random variable with probability mass function, given by:
 | (1) |
The location parameter is μ and for a fixed μ, φ is the dispersion parameter. Note that, if the negative binomial dispersion parameter φ is allowed to become infinitely large, then the resulting distribution is the Poisson distribution. The variance of the distribution is given by σ2=μ+μ2/φ. Indeed, when φ is known, the negative binomial distribution with parameter μ is a member of the exponential family. In this case, ![]() is a complete, sufficient statistic and is a minimum variance unbiased estimator for μ. As the parameter of interest here is φ, we will briefly discuss some problems with the existing estimation methods of φ.
is a complete, sufficient statistic and is a minimum variance unbiased estimator for μ. As the parameter of interest here is φ, we will briefly discuss some problems with the existing estimation methods of φ.
The negative binomial distribution (NB) may be viewed as a one-parameter distribution where either μ or φ is unknown, or a two-parameter distribution, where both μ and φ are unknown. The two-parameter distribution is difficult to work with and when we can assume that φ is known, many simplifications result. However, in most practical situations, both parameters are unknown and need to be estimated. In particular, estimation of the negative binomial dispersion parameter is extra difficult in the sense that most of the commonly used estimators for such parameter are not well defined or do not exist in the entire sample space.
For instance, when the sample mean is equal to the sample variance, the method of moments estimator becomes infinity whereas the maximum likelihood estimator ceases to exist when the sample variance is less than the sample mean.
The dispersion parameter φ is traditionally estimated by the maximum likelihood or method of moments approaches. Notably, when the sample variance exceeds the sample mean these methods give fairly good estimates for φ. On the other hand, when the sample mean exceeds the sample variance (under-dispersion), or when the mean is only slightly smaller than the variance, problems do occur. In the case of under-dispersion, the method of moments estimation may yield negative estimates and the maximum likelihood estimate does not even exist (Levin and Reeds, 1977). Indeed, this fact was very frustrating to Pearson who encountered a sample he believed was from a negative binomial distribution, but was unable to estimate reasonably one of the parameters.
In the scenarios, when the sample variance is only slightly larger than the sample mean, the estimates for φ often turn out to be very large. For example, in simulation it is common for φ estimates to exceed 500 or 1000 when the true value of φ is 5.
These problems limit the usefulness of both methods and hence some other methods need to be considered in an effort to improve the estimation of φ. In this study, we attempt to estimate the dispersion parameter of the negative binomial distribution by combining the method of moments and maximum quasi-likelihood estimators in a variety of different ways via appropriate weights.
Bayesian and empirical Bayesian methods were discussed by Walter and Hamedani (1991) and Al-Saleh and Al-Batainah (2003). We refer to Ghosh et al. (1983), Ahmed (1991, 2000), Khan and Ahmed (2006) for detailed studies on the combined estimation methods. In recent years, many researchers used the negative binomial to model count data, including Puig and Valero (2006), Greene (2008), Jones et al. (2009) among others.
ESTIMATION METHODS
Based on the reviewed literature, we encountered more than ten different estimators for the dispersion parameter φ. Here we describe few that are commonly used.
Method of Moments Estimator (MME)
The simplest way to estimate the negative binomial parameters is by the method of moments. By equating the sample mean ![]() and the sample variance S2 to the corresponding population mean μ and population variance σ2=μ+μ2/φ and calculating the solutions with respect to μ and φ one can get:
and the sample variance S2 to the corresponding population mean μ and population variance σ2=μ+μ2/φ and calculating the solutions with respect to μ and φ one can get:
| (2) |
Where:
 |
The Eq. 2 reveals several apparent problems in estimating φ which are listed below:
| • | If the sample variance equals the sample mean, then the estimator of φ is not defined |
| • | If the sample variance is less than the sample mean, then the estimator of φ is negative |
| • | If the sample variance is slightly more than the sample mean then the estimator of φ is very large |
In order to illustrate the behavior of ![]() and S2 for the NB, we generated random samples, each of size 50, from a negative binomial distribution with parameters μ = 1 and φ = 3. The following graph is a scatter plot of S2 versus
and S2 for the NB, we generated random samples, each of size 50, from a negative binomial distribution with parameters μ = 1 and φ = 3. The following graph is a scatter plot of S2 versus ![]() for 2000 such samples. The points falling above the line (S2 =
for 2000 such samples. The points falling above the line (S2 = ![]() ) are from over-dispersed samples and hence their estimates for φ can be found using MME. The points falling below the line (S2 =
) are from over-dispersed samples and hence their estimates for φ can be found using MME. The points falling below the line (S2 = ![]() ) represent under-dispersed samples, in which the MME of φ is negative. Based on 500,000 Monte Carlo replicates of the above scenario, the empirical probability of getting an under-dispersed sample is 12.42%. This shows that although the underlying model may be clearly over dispersed (1 = μ<σ = 3), for small sample sizes, there is a good chance of getting under dispersed samples which lead to negative MME’s.
) represent under-dispersed samples, in which the MME of φ is negative. Based on 500,000 Monte Carlo replicates of the above scenario, the empirical probability of getting an under-dispersed sample is 12.42%. This shows that although the underlying model may be clearly over dispersed (1 = μ<σ = 3), for small sample sizes, there is a good chance of getting under dispersed samples which lead to negative MME’s.
The expression for the large-sample variance for MME of φ was given by Anscombe (1950) as follows:
| (3) |
Maximum Likelihood Estimator (MLE)
The maximum likelihood estimates are derived by setting the partial derivative of the log-likelihood function equal to zero and solving the resulting estimating equations with respect to the parameters μ and φ. The maximum likelihood estimator of μ is ![]() and the maximum likelihood estimator of φ (say,
and the maximum likelihood estimator of φ (say, ![]() ) is the solution of the following Equation:
) is the solution of the following Equation:
| (4) |
where, n is the sample size, n1 is the number of ones in the sample, n2 is the number of twos in the sample and so on. The above equation has a unique solution provided that ![]() <S2. These estimators have been considered by Piters et al. (1977), Clark and Perry (1989), Walter and Hamedani (1991) and others.
<S2. These estimators have been considered by Piters et al. (1977), Clark and Perry (1989), Walter and Hamedani (1991) and others.
The aforementioned relation can be re-written as:
| (5) |
Unfortunately, there is no closed form for ![]() and Eq. 5 must be solved iteratively for the ML estimate
and Eq. 5 must be solved iteratively for the ML estimate ![]() ; the Newton-Raphson or scoring methods are efficient and convenient procedures for doing so. Having said that, if the initial values of the parameters are poor then the iteration may be very slow and costly. Note that Eq. 5 will have a unique solution provided that S2>
; the Newton-Raphson or scoring methods are efficient and convenient procedures for doing so. Having said that, if the initial values of the parameters are poor then the iteration may be very slow and costly. Note that Eq. 5 will have a unique solution provided that S2>![]() . For a proof of the existence of at least one possible solution of φ (Anscombe, 1950) and for a proof of uniqueness of the solution (Levin and Reeds, 1977).
. For a proof of the existence of at least one possible solution of φ (Anscombe, 1950) and for a proof of uniqueness of the solution (Levin and Reeds, 1977).
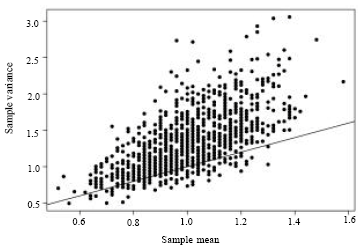 | |
| Fig. 1: | Sample variance plotted versus sample mean for 2000 Monte Carlo samples each of size n = 50 from a negative binomial distribution with μ = 1 and σ = 3 |
However, for under-dispersed samples, the maximum likelihood estimate for φ does not exist at all. The log-likelihood function behaves asymptotically, reaching no maximum when the sample variance is less than the sample mean. Hence, no finite maximum likelihood estimate is attainable (Levin and Reeds, 1977). Note that if ![]() = 0, then (S2 =
= 0, then (S2 =![]() = 0) and the MLE does not exist and Eq. 5 is of no use. Even when S2>
= 0) and the MLE does not exist and Eq. 5 is of no use. Even when S2>![]() there are other problems in estimating φ. For example, results from simulation showed large upward biases and large mean squared errors for the MLE. For the points in Fig. 1 falling just above the line (S2 =
there are other problems in estimating φ. For example, results from simulation showed large upward biases and large mean squared errors for the MLE. For the points in Fig. 1 falling just above the line (S2 =![]() ), it can be noted that these samples yield very large estimates for φ when either the MME or MLE are used.
), it can be noted that these samples yield very large estimates for φ when either the MME or MLE are used.
Piegorsch (1990) and Anraku and Yanagimoto (1990), following the study of Clark and Perry (1989), suggested re-parametrization by (α = 1/φ). Then α was estimated by the maximum likelihood approach. Piegorsch (1990) used the following form of the negative binomial probability mass function:
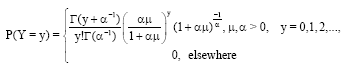 | (6) |
The ML estimating equations are:
| (7) |
The second equation in (7) reduces to:
The ML estimate of μ is ![]() and the solution to
and the solution to ![]() at
at ![]() gives the MLE of α. Such a solution is numerically available via a nonlinear root-finder. By estimating φ through its reciprocal (α = 1/φ) we can avoid the problem posed by infinite values of the MLE when S2 =
gives the MLE of α. Such a solution is numerically available via a nonlinear root-finder. By estimating φ through its reciprocal (α = 1/φ) we can avoid the problem posed by infinite values of the MLE when S2 = ![]() . For a comprehensive treatment on the existence and uniqueness of the MLE, we refer to Aragan et al. (1992), Willson et al. (1986) and Ferreri (1997).
. For a comprehensive treatment on the existence and uniqueness of the MLE, we refer to Aragan et al. (1992), Willson et al. (1986) and Ferreri (1997).
Extended Maximum Quasi-Likelihood Estimator (MQLE)
The MQLE for the negative binomial parameter φ was first obtained by Clark and Perry (1989). The MQLE ![]() is obtained by solving the following estimating equations simultaneously:
is obtained by solving the following estimating equations simultaneously:
| (8) |
| (9) |
The first equation leads to the MQLE of μ, ![]() . The MQLE of α,
. The MQLE of α, ![]() is obtained by solving the following equation iteratively and replacing
is obtained by solving the following equation iteratively and replacing ![]() by
by ![]() :
:
| (10) |
This procedure protects from getting infinite values of ![]() when the sample mean is close to the sample variance (Ross and Preece, 1985), however, negative
when the sample mean is close to the sample variance (Ross and Preece, 1985), however, negative ![]() 's were encountered in the simulation.
's were encountered in the simulation.
Other Methods of Estimation
Several alternative methods were suggested in the literature to estimate the negative binomial dispersion parameter φ. We present a brief description for some of these methods.
The zero-class estimator considered by Piters et al. (1977), can be derived by equating the observed and the expected number of zero values among the y′s (sample).
Willson et al. (1984) used a multistage process to estimate φ. As a few of the estimates for φ (in the MME) are extremely poor, such estimates would change dramatically if a few more observations were added to the sample. This procedure continues to add observations to the sample until the estimate of φ begins to converge in some specified manner. However, these good results are often obtained by reaching very large sample sizes in the multistage sampling. It should be noted that for some samples this procedure fails to produce an estimate of φ (positive and finite) because of under-dispersion.
Anscombe (1949, 1950) suggested the digamma function estimator using an iterative method based on the following transformation:
Anraku and Yanagimoto (1990) maximized a conditional likelihood function to estimate α. They treated the under-dispersed samples as Poisson samples. In these samples, ![]() was defined as infinity and
was defined as infinity and ![]() was defined to be zero. It can be shown by simulation that the chance of misclassifying a negative binomial sample as Poisson is large.
was defined to be zero. It can be shown by simulation that the chance of misclassifying a negative binomial sample as Poisson is large.
The use of the large likelihood estimator LLE was suggested by Shenton and Bowman (1967). Steiner (1993) applied the LLE to the negative binomial dispersion parameter φ. The LLE is obtained by setting the partial derivatives of the usual MLE to a small positive constant (say c = 0.13) rather than zero and solving for φ.
Another estimator for φ can be found using the reweighed estimation by enlarging the sample variance by increasing the frequency (weight) of the smallest and largest observations that produce the largest increase in the ratio S2/![]() . The use of the reweighed estimation for the negative binomial dispersion parameter was suggested by Steiner. The repeated application of the technique will usually give
. The use of the reweighed estimation for the negative binomial dispersion parameter was suggested by Steiner. The repeated application of the technique will usually give ![]() . However, it can be shown by simulation that some samples cannot be over-dispersed. Further, another problem involved in this method is when to stop the re-weighing process.
. However, it can be shown by simulation that some samples cannot be over-dispersed. Further, another problem involved in this method is when to stop the re-weighing process.
Some Concluding Remarks
From the above existing methods of estimators, it is observed that the digamma and zero-class estimators have no redeeming features as compared to the MME and MLE and have substantial disadvantages. These two methods are now rarely used.
The MME and MLE for the parameter φ appear to have similar characteristics. For small sample sizes, the MME is recommended and when μ≥φ the MLE is recommended. When the sample size is adequate (20 and above) and α = 1/φ is not very small, then the MQLE appears to be slightly more accurate than MLE. The MQLE is recommended when S2 is close to ![]() .
.
In most cases, using the multistage estimator produces better estimators for φ when there is no restriction on the sample size (cost) since the results in the multistage procedure are often obtained by reaching very large sample sizes.
The LLE performs well in most parameter combinations. However, there are some difficulties in the iteration convergence, particularly in the case of under-dispersed samples with sample size less than 150. This forces the researchers to increase the sample size, which may not be always possible.
It is noted that when the sample variance is greater than the sample mean, the MME is easy to calculate and will have a small mean squared error (MSE). On the other hand, when S2 is close to ![]() , the MQLE performs better than both MME and MLE. This suggests that perhaps two or more estimators can be combined in the hope to get a better estimation strategy.
, the MQLE performs better than both MME and MLE. This suggests that perhaps two or more estimators can be combined in the hope to get a better estimation strategy.
SEVERAL COMBINED ESTIMATORS
Suppose that ![]() and
and ![]() are two estimators for θ. Our problem is to combine
are two estimators for θ. Our problem is to combine ![]() and
and ![]() to obtain a single improved estimator for θ. There are two ways for combining such estimators. The first method is linear combination estimation. In general, for a fixed number w such that wε(0,1), the linear combination estimator is defined as:
to obtain a single improved estimator for θ. There are two ways for combining such estimators. The first method is linear combination estimation. In general, for a fixed number w such that wε(0,1), the linear combination estimator is defined as:
The combined estimators can be further improved by finding the optimal weight. Probably, fixed weight can be replaced by random weight, resulting in preliminary and shrinkage-type estimators. We refer to Ghosh et al. (1983), Ahmed (1991, 2000), Khan and Ahmed (2006) for detailed studies on this topic. Generally speaking, the shrinkage estimator based on optimal weight dominates the classical estimator in multi-sample situation. The second method of combining is the binary choice and is essentially classical Neyman-Pearson hypothesis testing.
Here, we introduce several combined estimators by choosing either the MME or the MQLE depending on the outcome of a test of the null hypothesis H0:σ2/μ = b against the alternative H0:σ2/μ>b where b>0 is a prespecified constant. More detail about the use of combined estimators can be found in Efron and Morris (1973, 1975).
Combined Estimator 1 (Comb 1)
To estimate the dispersion parameter α = 1/φ of the negative binomial, let ![]() MME and
MME and ![]() MQLE be the MME and MQLE of α, respectively. Then the combined estimator for α depending on the variance test (VT) or the index of dispersion test (Karlis and Xekalaki, 2000) for more details is given by:
MQLE be the MME and MQLE of α, respectively. Then the combined estimator for α depending on the variance test (VT) or the index of dispersion test (Karlis and Xekalaki, 2000) for more details is given by:
| (11) |
Where:
b is a nonnegative prespecified constant and I(A) is one if A is true and zero otherwise.
Note that the MQLE is not defined for some samples and the MME is defined for all cases. To avoid this difficulty, we define the following estimator, which always exists.
| (12) |
Further, we define the following combined estimators (Justification is given later).
| (13) |
| (14) |
Combined Estimator 5 (Comb 5)
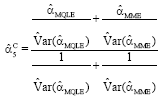 |
 | (15) |
In the above estimators, we are trying to improve the combination of ![]() MME and
MME and ![]() MQLE by using different weights. In
MQLE by using different weights. In ![]() 3C, the use of 40 is suggested by simulation. We used different fixed weights in the simulation and it turned out that the use of 40 produced a good estimator. In
3C, the use of 40 is suggested by simulation. We used different fixed weights in the simulation and it turned out that the use of 40 produced a good estimator. In ![]() 4C, we use the critical value of the variance test instead. In
4C, we use the critical value of the variance test instead. In ![]() 5C, we use the variances of the estimators to find an improved combined estimator.
5C, we use the variances of the estimators to find an improved combined estimator.
In the following section, an extensive Monte Carlo simulation study is carried out to investigate the behavior of the suggested estimators. We numerically compare the biases and MSE's of the ![]() MME and
MME and ![]() MQLE with those of our combined estimators.
MQLE with those of our combined estimators.
SIMULATION STUDY
To compare the various estimators, we use the Mean Squared Error (MSE) criterion to evaluate the proposed estimators. The MSE is defined as:
where, ![]() is an estimate of θ. Further, the Relative Efficiency (RE) of an estimator
is an estimate of θ. Further, the Relative Efficiency (RE) of an estimator ![]() with respect to another estimator
with respect to another estimator ![]() is defined by:
is defined by:
A simulation study is carried out by taking samples of size n = 30, 50, 100, 150 from negative binomial distribution with parameters μ and φ, where μ = (1, 3, 5, 10, 20) and φ = (1, 2,..., 10, 15, 20). Each simulation is repeated 2000 times. Note that the under-dispersed samples (S2< ![]() ) were discarded from the simulation study. More importantly, only a few samples were discarded in the simulation with a combined estimator because in most of the under-dispersed samples, the MQLE is selected which has a valid estimator in most cases (Clark and Perry, 1989). The performance of the combined estimator
) were discarded from the simulation study. More importantly, only a few samples were discarded in the simulation with a combined estimator because in most of the under-dispersed samples, the MQLE is selected which has a valid estimator in most cases (Clark and Perry, 1989). The performance of the combined estimator ![]() 1C depends on the value of the constant b. The optimal choice of b is still an open question problem for future research. In our simulation experiment we consider the choice b = 2. Following Piegorsch (1990), the restriction
1C depends on the value of the constant b. The optimal choice of b is still an open question problem for future research. In our simulation experiment we consider the choice b = 2. Following Piegorsch (1990), the restriction ![]() , where ymax is the largest vale of y was applied for all estimates to guarantee the existence of the maximum number of estimates.
, where ymax is the largest vale of y was applied for all estimates to guarantee the existence of the maximum number of estimates.
The ML estimating equations were solved using S-plus. The number of replications for each parameter configuration was initially varied and it was determined that 2000 simulations were adequate because a further increase in the number of replications did not significantly change the results. Thus, in each case, 2000 samples were randomly generated. We compared the simulated mean bias, Simulated Mean Squared Error (SMSE) for each estimator based on 2000 simulations. Moreover, the Simulated Relative Efficiencies (SRE) of the estimators were calculated by:
where, the SMSE is obtained by:
If the convergence of the estimating equation were not achieved, then the sample was discarded. Again, note that the convergence of the estimating equations is sensitive to the initial values provided to the S-plus. The number of rejected samples depends on the values of the parameters μ and α as well as on the sample size n. The number of rejected samples decreases as the values of the parameter μ and α increase. The number of rejected samples increases as the sample size n increases. Further, the number of the rejected samples declined to zero for large values of α, μ and for fixed n.
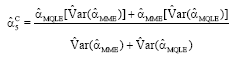
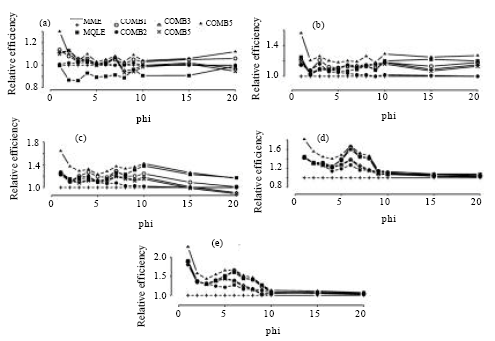
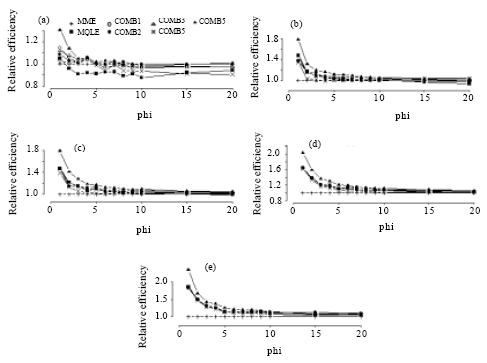
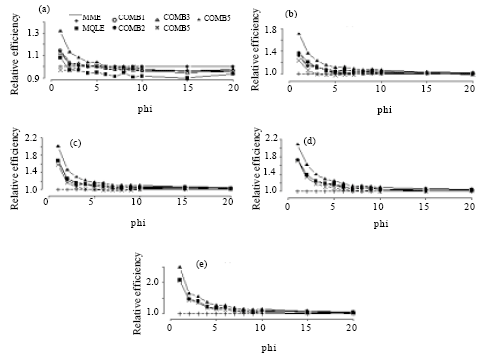
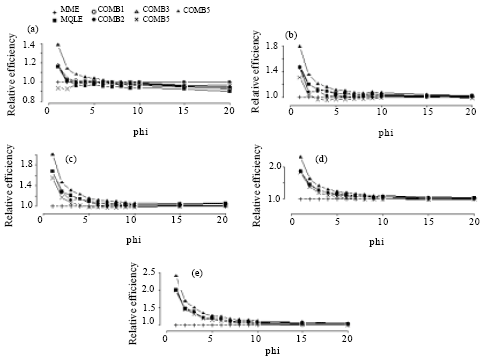
The simulated relative efficiency results are presented in Fig. 2-5 and the mean bias results are presented in Fig. 6-9.
 | |
| Fig. 2: | Simulated relative efficiency of the estimators of the dispersion parameter for n = 30. (a) for mu = 1, (b) for mu = 3, (c) for mu = 5, (d) for mu = 10, (e) for mu = 20 |
 | |
| Fig. 3: | Simulated relative efficiency of the estimators of the dispersion parameter for n = 50. (a) for mu = 1, (b) for mu = 3, (c) for mu = 5, (d) for mu = 10, (e) for mu = 20 |
 | |
| Fig. 4: | Simulated relative efficiency of the estimators of the dispersion parameter for n = 100. (a) for mu = 1, (b) for mu = 3, (c) for mu = 5, (d) for mu = 10, (e) for mu = 20 |
 | |
| Fig. 5: | Simulated relative efficiency of the estimators of the dispersion parameter for n = 150. (a) for mu = 1, (b) for mu = 3, (c) for mu = 5, (d) for mu = 10, (e) for mu = 20 |
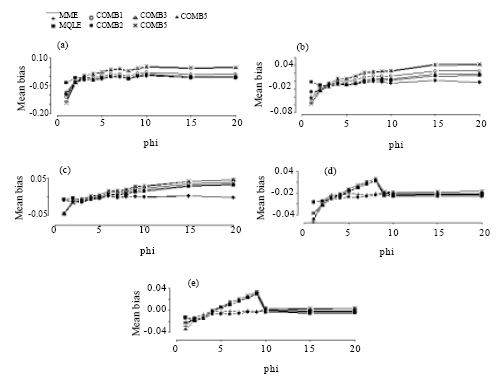 | |
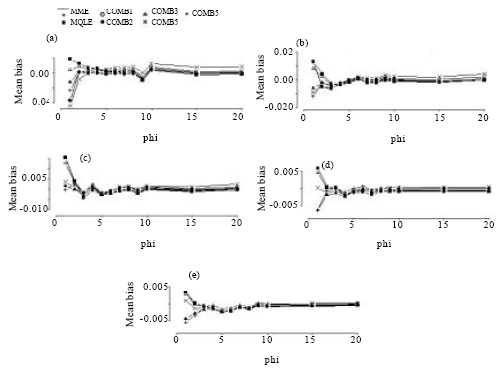
| Fig. 6: | Mean bias of the combined estimators of the dispersion parameter for n = 30. (a) for mu = 1, (b) for mu = 3, (c) for mu = 5, (d) for mu = 10, (e) for mu = 20 |
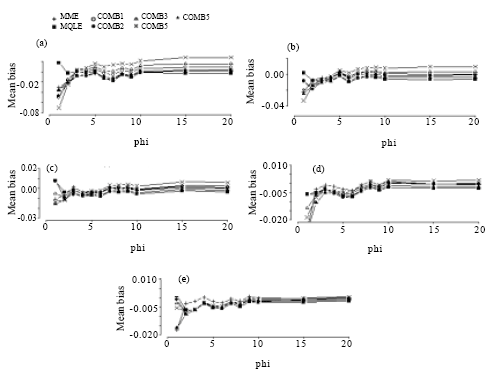 | |
| Fig. 7: | Mean bias of the combined estimators of the dispersion parameter for n = 50. (a) for mu = 1, (b) for mu = 3, (c) for mu = 5, (d) for mu = 10, (e) for mu = 20 |
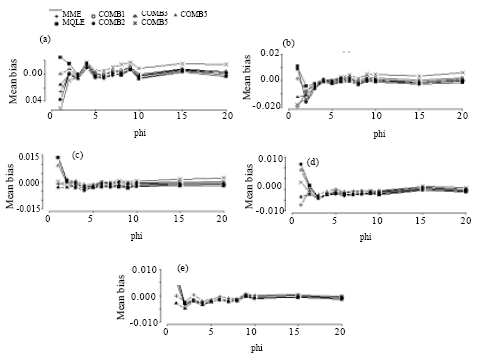 | |
| Fig. 8: | Mean bias of the combined estimators of the dispersion parameter for n = 100. (a) for mu = 1, (b) for mu = 3, (c) for mu = 5, (d) for mu = 10, (e) for mu = 20 |
 | |
| Fig. 9: | Mean bias of the combined estimators of the dispersion parameter for n = 150. (a) for mu = 1, (b) for mu = 3, (c) for mu = 5, (d) for mu = 10, (e) for mu = 20 |
RESULTS AND DISCUSSION
Based on our simulation study, we make the following observations from Fig. 6-9:
In terms of mean biases, we note that the mean biases for the MME estimators of α = 1/φ are negative in most of the parameter space and that the magnitude of biases decrease as the sample sizes increase. This is true for all of the proposed estimators. We see that the biases of the MQLE and the ![]() 5C estimator have the same sign and the biases of the
5C estimator have the same sign and the biases of the ![]() 3C and the
3C and the ![]() 4C estimators have the same sign as well.
4C estimators have the same sign as well.
For fixed n and α, the mean bias decreases as μ increases and for fixed μ and α, the mean bias decreases as n increases. For fixed μ and n, the mean bias decreases as α decreases (that is, φ increases). Further, Fig. 6-9 reveal that as n increases, the biases of all the proposed estimators become more stable. For ![]() (φ >3), all estimators have biases close to each other.
(φ >3), all estimators have biases close to each other.
The combined estimators, especially ![]() 5C, significantly reduce the mean bias of the MQLE estimators. The MME has smaller bias than the other estimators for small μ and large α.
5C, significantly reduce the mean bias of the MQLE estimators. The MME has smaller bias than the other estimators for small μ and large α.
In terms of relative efficiency, with respect to the MME, we make the following observations from Fig. 2-5:
The relative efficiencies for the MQLE and all the combined estimators increases as the sample size n increases.
All combined estimators are more efficient than the MMW. The first combined estimator ![]() 1C has a relative efficiency greater than both the MME and the MQLE in most of the parameter space and has a relative efficiency as good as MQLE in the rest of the parameter space. For small μ and small α, the MME is better than both MQLE and
1C has a relative efficiency greater than both the MME and the MQLE in most of the parameter space and has a relative efficiency as good as MQLE in the rest of the parameter space. For small μ and small α, the MME is better than both MQLE and ![]() 1C estimators. For (n>50), the second combined estimator,
1C estimators. For (n>50), the second combined estimator, ![]() 2C has less relative efficiency than the
2C has less relative efficiency than the ![]() 1C, but it improves over the
1C, but it improves over the ![]() 1C in the cases when the
1C in the cases when the ![]() 1C has better performance than
1C has better performance than ![]() 3C. The third combined estimator (
3C. The third combined estimator (![]() 3C) and the fourth combined estimator (
3C) and the fourth combined estimator (![]() 4C), have similar performances to the first combined estimator. The fifth combined estimator (
4C), have similar performances to the first combined estimator. The fifth combined estimator (![]() 5C) is the best among all the proposed estimators in the entire parameter space except for small values of α (large φ) and for very small μ (μ≤1) where,
5C) is the best among all the proposed estimators in the entire parameter space except for small values of α (large φ) and for very small μ (μ≤1) where, ![]() 3C has a very close performance to that of the MME.
3C has a very close performance to that of the MME.
As α decreases, all the proposed estimators have a performance very close to that of the MME. The difference between the estimators can be seen clearly for large α ( Fig. 2-5).
For fixed μ and n, the relative efficiency of all the combined estimators increase as α increases. Also, for fixed n and α, the relative efficiency of all the combined estimators increase as μ increases.
In summary, except for μ≤1 and small α, the combined estimator, ![]() 5C is superior to all other estimators studied here. For small μ (μ≤1) and small α, the MME will be a sensible choice.
5C is superior to all other estimators studied here. For small μ (μ≤1) and small α, the MME will be a sensible choice.
REFERENCES
- Ahmed, S.E., 1991. To pool or not to pool: The discrete data. Probabil. Statist. Lett., 11: 233-237.
Direct Link - Ahmed, S.E., 2000. Construction of improved estimators of multinomial proportions. Comm. Statist. Theory Methods, 29: 1273-1291.
Direct Link - Al-Saleh, M. and F. Al-Batainah, 2003. Estimation of the dispersion parameter k of the negative binomial distribution. Applied Mathematics Comput., 143: 431-441.
CrossRefDirect Link - Anraku, K. and T. Yanagimoto, 1990. Estimation for the negative binomial distribution based on the conditional likelihood. Comm. Statist. Simul. Comput., 19: 771-786.
Direct Link - Anscombe, F.J., 1948. The transformation of poisson, binomial and negative-binomial data. Biometrika, 35: 246-254.
CrossRefDirect Link - Anscombe, F.J., 1950. Sampling theory of the negative binomial and logarithmic series distribution. Biometrika, 37: 358-382.
CrossRefDirect Link - Aragan, J., D. Eberly and S. Eberly, 1992. Existence and uniqueness of the maximum likelihood estimator for the two-parameter negative binomial distribution. Statist. Probabil. Lett., 15: 375-379.
Direct Link - Clark, S.J. and J.N. Perry, 1989. Estimation of the negative binomial parameter k by quasi-likelihood. Biometrics, 45: 309-316.
Direct Link - Efron, B. and C. Morris, 1973. Stein's estimation rule and its competitors-an empirical Bayes approach. J. Am. Statist. Assoc., 68: 117-130.
Direct Link - Efron, B. and C. Morris, 1975. Data analysis using Stein's estimator and its generalizations. J. Am. Statist. Assoc., 70: 311-319.
Direct Link - Ferreri, C., 1997. On the ML-estimator of the positive and negative two-parameter binomial distribution. Statist. Probabil. Lett., 33: 129-134.
Direct Link - Ghosh, M., J.T. Hwang and K. Tsui, 1983. Construction of improved estimators in multiparameter estimation for discrete exponential families. Ann. Statist., 11: 351-367.
Direct Link - Greene, W., 2008. Functional forms for the negative binomial model for count data. Econ. Lett., 99: 585-585.
CrossRefDirect Link - Jones, M., A. Dobson, M. Onslow, and B. Carey, 2009. Negative binomial mixed models for analysis of stuttering rates. Comput. Statist. Data Anal., 53: 4590-4600.
Direct Link - Karlis, D. and E. Xekalaki, 2000. A simulation comparison of several procedures for testing the Poisson assumption. Statistician, 49: 355-382.
Direct Link - Khan, B.U. and S.E. Ahmed, 2006. Comparisons of improved risk estimators of the multivariate mean vector. Comput. Statist. Data Anal., 50: 402-421.
Direct Link - Levin, B. and J. Reeds, 1977. Compound multinomial likelihood functions are unimodal: Proof of a conjecture of I. J. Good. Ann. Statist., 5: 79-87.
Direct Link - Piegorsch, W.W., 1990. Maximum likelihood estimation for the negative binomial dispersion parameter. Biometrics, 46: 863-867.
Direct Link - Piters, E.P., C.E. Gates, J.H. Martis and W.L. Sterling, 1977. Small sample comparison of different estimator of negative binomial parameters. Biometrics, 33: 718-723.
Direct Link - Puig, P. and J. Valero, 2006. Count data distributions: Some characterizations with applications. J. Am. Statist. Assoc., 101: 332-340.
Direct Link - Walter, G. and G. Hamedani, 1991. Bayes empirical Bayes estimation for the natural exponential families with quadratic variance function. Ann. Statist., 19: 1191-1224.
Direct Link - Willson, L.J., L. Folks and J.H. Young, 1984. Multistage estimation compared with fixed sample size estimation of the negative binomial parameter k. Biometrics, 40: 109-117.
Direct Link - Willson, L.J., L. Folks and J.H. Young, 1986. Complete sufficiency and maximum likelihood estimation for the two-parameter negative binomial distribution. Metrika, 33: 349-362.
CrossRefDirect Link