
V. Singh
Department of Grain Science and Technology, Central Food Tehnological Research Institute, Mysore-570 020, Karnataka, India
S.Z. Ali
Department of Grain Science and Technology, Central Food Tehnological Research Institute, Mysore-570 020, Karnataka, India
American Journal of Food Technology
Year: 2006 | Volume: 1 | Issue: 1 | Page No.: 43-51


ABSTRACT
Starches from cereals (maize, wheat, rice, sorghum, finger millet, waxy rice), pulses (green gram, chick pea) tuber (potato and root (tapioca) were converted to non-granular form and hydrolysed in a homogenous phase. In vitro hydrolysis by α-amylase at 37 °C for 5 to 30 min was carried out and the same starches were also modified with 0.5 N HCl at 37°C for 0.75 to 3 h. Molecular weight of the starches decreased to 7-35% of the respective initial
PDF Abstract XML References Citation
How to cite this article
V. Singh and S.Z. Ali, 2006. In vitro Hydrolysis of Starches by α-amylase in Comparison to That by Acid. American Journal of Food Technology, 1: 43-51.
DOI: 10.3923/ajft.2006.43.51
URL: https://scialert.net/abstract/?doi=ajft.2006.43.51
DOI: 10.3923/ajft.2006.43.51
URL: https://scialert.net/abstract/?doi=ajft.2006.43.51
INTRODUCTION
Hydrolysis of starch has been of interest not only from its commercial exploitation angle but also to study the granular and molecular architecture specific to the starch. Controlled acid or enzyme hydrolysis could therefore serve as an important tool in this respect. Hydrolysis pattern of various starches in monitoring their chemical properties and microscopic changes has been reported (Leach and Schoch, 1961; Dranzek et al., 1972; Fuwa et al., 1979). Erosion behaviour of different starches has been documented which has revealed that different starches are attacked in patterns that are related to the surface and internal texture of starch granules (Fuwa et al., 1978). Thin sections of acid treated granules show pronounced growth rings under TEM and at high magnifications (x110,000) stacks of lamellae 500 a thick and several hundred Angstrom broad have been recorded (Yamaguchi et al., 1979). Rohwer and Klem (1984) have indicated that acid catalysed hydrolysis of starch as opposed to enzymic (α-amylase) hydrolysis can take place at branch points as well as at linear segments. Thus the properties of greater gelling power or retrogradation of acid modified starch could be attributed to reducing the degree of branching and increasing the percentage of linear segments. Batlle et al. (2005) have carried out determination of depolymerisation kinetics of amylose, amylopectin and maltodextrin by aspergillus niger glucoamylase using a 2-p-toluidinylnaphthalene-6-sulfonate/flow-injection analysis system with fluorimetric detection. It is therefore, arrangements were made to carry out controlled α-amylase hydrolysis. Results of the study on the molecular weight (![]() ) changes on acid hydrolysis in comparison with enzyme hydrolysed and gel permeation chromatography profile of enzyme hydrolysed products are reported here.
) changes on acid hydrolysis in comparison with enzyme hydrolysed and gel permeation chromatography profile of enzyme hydrolysed products are reported here.
MATERIALS AND METHODS
Materials
Potato, maize and tapioca starches were from commercial sources. Finger millet (cultivar, indaf 9), non-waxy rice (cultivar, Jaya), waxy rice (cultivar, purple puttu) and sorghum (cultivar, CSH-5) were procured from Agricultural Research Stations. Other grains were procured from local market. Starches from these raw materials were isolated as reported earlier (Singh and Ali, 1987). Protein content of these starches was estimated by Kjeldhal method, which lay in the range of 0.1 to 0.3% (Nx6.25/5.95) and moisture content of these were about 12% (w.b.), respectively.
Sephadex G-50, Sephadex G-200 and Sepharose CL-6B gels and dextrans of standard molecular weights (T-10 to T-2000) were from Pharmacia Fine Chemicals, Sweden and α-amylase from Asperigillus oryzae (A-0273), was from Sigma Chemicals, USA.
Methods
Preparation of Non-granular Starches
Native starch (granular in nature) was dissolved in excess of 2 N alkali (NaOH) under nitrogen atmosphere with stirring for 1 h at room temperature and neutralized with acid using phenolphthalein as an indicator. Dispersed starch was precipitated by pouring the slurry slowly into four volumes of distilled ethyl alcohol while stirring constantly. The precipitated starch was allowed to settle, decanted, filtered using Buchner funnel, washed with 80% ethanol, 2 to 3 times and dried in vacuum oven at 30°C for about 12 h.
Enzyme Hydrolysis
About 1.5 g (w.b.) non-granular starch was wetted with ethyl alcohol, mixed with about 10-15 mL of water and cooked with continuous stirring (if required, with addition of water) for 15 min in boiling water bath. Finally, the dispersion was made up to 50 mL and mixed well. A known volume of dispersion was taken for molecular weight (![]() ) estimation. Fifty milliliter of phosphate buffer (pH 7.0) containing 200 units of fungal α-amylase (5.32±0.24 mg) was added, mixed thoroughly and kept at 37°C with intermittent mixing. Hydrolysis was monitored by drawing suitable quantity of aliquots periodically at 5, 10, 20 and 30 min and determining the reducing power for estimation of
) estimation. Fifty milliliter of phosphate buffer (pH 7.0) containing 200 units of fungal α-amylase (5.32±0.24 mg) was added, mixed thoroughly and kept at 37°C with intermittent mixing. Hydrolysis was monitored by drawing suitable quantity of aliquots periodically at 5, 10, 20 and 30 min and determining the reducing power for estimation of ![]() of the resultant starch hydrolysate as per Cvh et al. (1976) and modified by Ali and Kempf (1986).
of the resultant starch hydrolysate as per Cvh et al. (1976) and modified by Ali and Kempf (1986).
Acid Hydrolysis at Comparable Temperature to that of Enzyme Hydrolysis
The non-granular starches were cooked and made upto 50 mL with water as mentioned earlier, transferred to 100 mL volumetric flask and 50 mL of warm IN HCI was added to make the final acid strength to 0.5 N. The dispersion was mixed well and kept in water bath and maintained at 37°C with periodical mixing. Suitable aliquots were drawn at the end of 0.75, 1.5 and 3.0 h. Hydrolysis was stopped by neutralizing with alkali solution (NaOH) and ![]() was estimated as stated above.
was estimated as stated above.
Sample Preparation for Gel Permeation Chromatography
A known amount of non-granular starch with 2.5 mL of water was cooked in boiling water for 25 min, with occasional stirring and maintaining the water level. From this a known quantity was used for estimation of carbohydrate content (Dubois et al., 1956). The remaining sample was centrifuged for 20 min at 5000 rpm. A suitable quantity of aliquot equivalent to 7 mg of starch was drawn from the supernatant and loaded on to gel column. Water containing 0.02% sodium azide was used as an eluent.
Enzyme Hydrolysis of Non-granular Starches for Chromatography
The non-granular starches were cooked as before. They were hydrolysed with α-amylase at pH 7.0 using phosphate buffer for different periods up to 0.5 h. Hydrolysed starch was subjected to chromatography after arresting enzyme activity. Various gels Sephadex G-50, Sephadex G-200 and Sepharose CL-6B were screened for their suitability for the above purpose. Finally the standardized conditions were: About 70 mg of starch (cooked for 25 min in boiling water) was hydrolysed with 20 μg of α-amylase (0.75 units) for 20 min, arresting the enzyme activity immediately by addition of 5 mL K3FeCN6 and keeping the sample tube in vigorously boiling water for 15 min. A known amount of hydrolysed starch (7 to 10 mg) was fractionated over Sepharose CL-6B gel column using Frac-100 system of Pharmacia, Sweden. Three milliliter fractions were collected and analysed for carbohydrate content (Dubois et al., 1956) and λmax of iodine complex. The recovery of carbohydrate in gel permeation chromatography column ranged from 70-110%. The Mw of the Fr-IIB of hydrolysed starch was estimated using standard curves prepared from Kav of standard dextrans.
RESULTS AND DISCUSSION
Molecular Weight (![]() ) of Native Starches
) of Native Starches
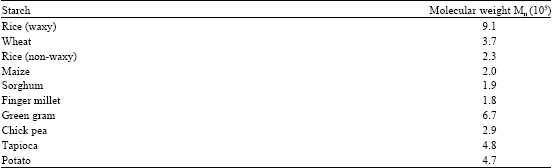
Table 1 shows the ![]() of various native starches determined using non-granular form. Although the trend of the result is essentially similar to what was reported earlier (Singh and Ali, 1987) for granular starches, all starches except potato and waxy rice gave a higher (25-85%) absolute values. This may be due to probable removal of lipid components (which interfere in the estimation of reducing power) in these starches during alcohol precipitation and washing. Potato starch contains hardly any lipid fraction whereas cereal and other starches do contain certain quantities (0.1 to 0.2%) of lipids. It could also be due to natural variations in the respective samples used for the studies.
of various native starches determined using non-granular form. Although the trend of the result is essentially similar to what was reported earlier (Singh and Ali, 1987) for granular starches, all starches except potato and waxy rice gave a higher (25-85%) absolute values. This may be due to probable removal of lipid components (which interfere in the estimation of reducing power) in these starches during alcohol precipitation and washing. Potato starch contains hardly any lipid fraction whereas cereal and other starches do contain certain quantities (0.1 to 0.2%) of lipids. It could also be due to natural variations in the respective samples used for the studies.
Highest Mn (>9x10⁵)was shown by waxy rice starch (which contains about 95% amylopectin). Green gram, potato and tapioca gave a fairly high Mn (5 to 7x10⁵) while others ranged in between (2 to 4x10⁵).
| Table 1: | Molecular weight |
 | |
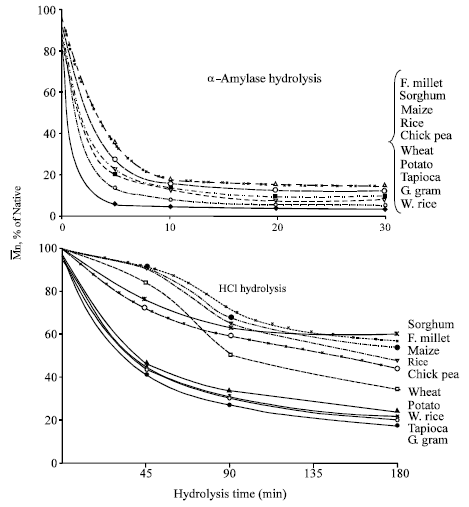 |
| Fig. 1: | Decrease in molecular weight ( |
Comparative Degradation of Enzyme and Acid Hydrolysis
Figure 1 shows the drop in Mn followed during hydrolysis of various starches by enzyme (α-amylase) as well as acid (HCl) over a period in which the ![]() was reduced maximally to almost an equilibrium level. It is apparent that the hydrolysis was very fast in case of enzyme as compared to the acid under the conditions employed. The maximum drop by α -amylase hydrolysis occurred in the first 5 min period in which the Mn was reduced to 7 to 35% of the respective initial value. Over the next five min the rate of hydrolysis was considerably reduced and was nearly stopped after 20 min. With this the differences in the
was reduced maximally to almost an equilibrium level. It is apparent that the hydrolysis was very fast in case of enzyme as compared to the acid under the conditions employed. The maximum drop by α -amylase hydrolysis occurred in the first 5 min period in which the Mn was reduced to 7 to 35% of the respective initial value. Over the next five min the rate of hydrolysis was considerably reduced and was nearly stopped after 20 min. With this the differences in the ![]() of resultant starches were reduced. Thus at the end of 30 min period, their
of resultant starches were reduced. Thus at the end of 30 min period, their ![]() ranged between 17-26x103 that represented 3-15% of the initial. In the case of uncooked granular starches, Leach and Schoch (1961) using bacterial α-amylase for 120 h have shown that susceptibility to hydrolysis, in the order of increasing resistance was for waxy maize, tapioca, waxy sorghum, sorghum, corn, wheat, rice, sago, arrowroot, potato, heat-moisture treated potato and amylo-maize.
ranged between 17-26x103 that represented 3-15% of the initial. In the case of uncooked granular starches, Leach and Schoch (1961) using bacterial α-amylase for 120 h have shown that susceptibility to hydrolysis, in the order of increasing resistance was for waxy maize, tapioca, waxy sorghum, sorghum, corn, wheat, rice, sago, arrowroot, potato, heat-moisture treated potato and amylo-maize.
Acid hydrolysis in comparison was very slow. The hydrolysis was followed over a period of 3 h. In the first 45 min, the ![]() was reduced to 40-93% of the value of native starch decreasing further with time. There was wide variation amongst various starches. At the end of 3 h, potato, waxy rice, tapioca and green gram were reduced maximally to a level of 18-25% of their initial Mn whereas maize, sorghum and finger millet to 55-70% of their initial. Wheat, chickpea and non-waxy rice were reduced to a level in between viz., to 35-50% of their initial. The absolute Mn of the respective starches at the end of 3 h acid hydrolysis were more than 5 times higher than that observed at the end of 20 min of enzyme hydrolysis.
was reduced to 40-93% of the value of native starch decreasing further with time. There was wide variation amongst various starches. At the end of 3 h, potato, waxy rice, tapioca and green gram were reduced maximally to a level of 18-25% of their initial Mn whereas maize, sorghum and finger millet to 55-70% of their initial. Wheat, chickpea and non-waxy rice were reduced to a level in between viz., to 35-50% of their initial. The absolute Mn of the respective starches at the end of 3 h acid hydrolysis were more than 5 times higher than that observed at the end of 20 min of enzyme hydrolysis.
Although the rate of acid hydrolysis in suspension/solution form was also slow in comparison to that observed for granular starches at 50°C (Singh and Ali, 1987), the pattern was essentially similar. That the pattern of hydrolysis i.e the comparative susceptibility and resistant towards enzyme and acid attack whether in granular or in non-granular form state bore similarity, merits attention. It has been speculated that in the granular state the acid attack is preferentially in the amorphous region (Kerr, 1950; Mussulman and Wagoner, 1968). The crystallinity exhibited by acid modified starch is essentially similar to that of native starch and is not significantly altered, although molecular breakdown take place. However, in the non-granular form, when the starch is in a fully hydrated state and is in solution/suspension, the branch points and linear chains, from interior to exterior, are fully available and should theoretically be equally susceptible for acid (and also enzyme) attack. But we see that even in solution the attack is not quite random and follows a definite pattern which is similar to that seen in the granular form. It would therefore, imply that the weak points in the molecular structure of starch are also the weak points in its granular organization. This interesting aspect calls for further in depth studies.
GPC Profile of the Enzyme Hydrolysed Starches
In order to have a comparative picture on the nature of the hydrolyzed products by enzyme against acid treatment, GPC profile of enzyme hydrolysed products was carried out. In the case of acid hydrolysis of different starches, the GPC of 1.5 h hydrolysed starches (Singh and Ali, 2000) was reported. In order to study the enzyme hydrolysis pattern, initially the GPC profile of finger millet and potato starch was seen after 5, 10, 20 and 30 min hydrolysis by α-amylase. The suitability of gel was screened using Sephadex G-50, G-200 and Sepharose CL-6B. The latter was found to give a profile with distribution of the products over the range of elution volume. This gel was therefore, selected for further research and the results as presented in Fig. 2 for finger millet starch.
In could be seen that the starch was progressively hydrolysed with increasing time of hydrolysis as indicated by progressive decrease in absorbance (carbohydrate content) of the void volume (first fraction) and corresponding increase in the fraction that entered the gel and eluted over a range of elution volume (second fraction). Further, with increasing hydrolysis, the peak of the second fraction shifted towards total volume showing the progressive degradation to lower molecular weight products.
| Table 2: | Distribution of carbohydrate content in GPC fractions of native and α-amylase hydrolysed starches from various sources |
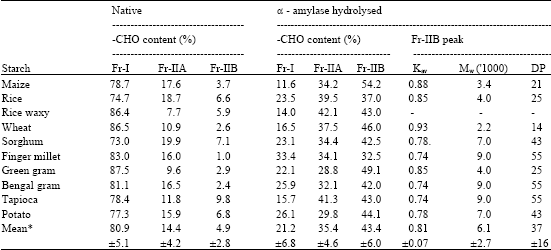 | |
| *Mean±SD | |
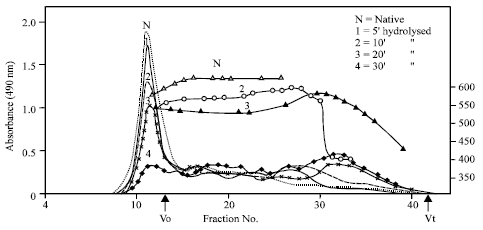 |
| Fig. 2: | Elution pattern of native and progressively hydrolysed finger millet starch Using α - amylase. λmax of iodine complex of the respective fractions are also shown |
The λmax of the eluted fractions also showed a decrease with increasing hydrolysis. From the curve for different hydrolysis times it appeared that 20 min could serve as an index for comparative purpose. Further studies were therefore, confined to 20 min hydrolysis time for different starches. The results are presented in Fig. 3 and Table 2.
In order to assess the changes in the second fraction viz., the one that entered the gel and eluted over the range of elution volume, it was further divided into two sub-fractions viz., fraction II A (Fr-IIA) and fraction IIB (Fr-IIB) as shown in Fig. 3, for green gram, Fr-IIA comprised of tube numbers 21/22 to 32 and Fr-IIB the rest of the tubes till the total volume. It could be seen that in all the cases there was decrease in Fr-I and concomitant increase in Fr-IIA and Fr-IIB. It is also apparent that the increase was higher in Fr-IIB than in IIA. Table 2 gives percentage distribution of carbohydrate content in all the three fractions in native as well as hydrolysed products. The carbohydrate content of Fr-I which averaged to 80.9% for native starches was thus reduced to 21.2% after enzyme hydrolysis, while Fr-IIA increased from 14.4 to 35.4%. The rise in Fr-IIB was still higher viz., from a mere 4.9 to 43.4% on an average.
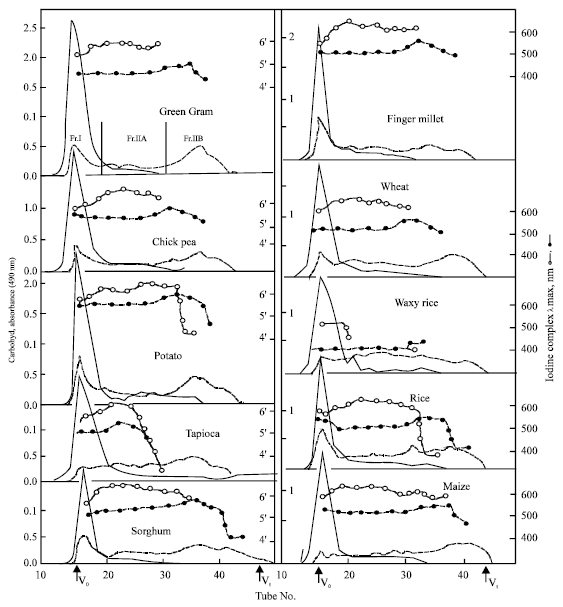 |
| Fig. 3: | Distribution of carbohydrate content (absorbance at 490 nm) in corresponding fractions of various native (_) and α -amylase hydrolysed (----) starches on Sepharose CL 6B column. λmax of iodine complex of native (-o-o-o-) are also shown |
This indicated that enzyme hydrolysis produced a higher proportion of lower molecular weight compounds. In fact, the molecular weight based on the Kav 0.74 to 0.93 of the peak of Fr-IIB showed (Table 2) that it varied between 2200 to 9000 (DP 14 to 55) for different starches. This is in contrast to the behaviour of acid hydrolysis for granular starches reported earlier (Singh and Ali, 2000) where Kav values for Fr-II peak of hydrolysed products ranged from 0.33 to 0.55 which would correspond to ![]() of 2.7x10⁵ to 2.6x10⁵ i.e., to very high molecular weight dextrins. The molecular weight of Fr-I was >108. Although the highest proportion (>85%) of Fr-I was seen in waxy rice, wheat and green gram, in case of native starches, finger millet starch was the most resistant to enzyme hydrolysis among all the starches studied. It has already been shown that finger millet starch in granular form was also t he most resistant to acid hydrolysis (Singh and Ali, 2000) which was suggestive of its granular make-up. The present results indicate that not only the granular but also the molecular architecture of finger millet starch is such that proneness to enzyme attack is also the least as compared to other starches.
of 2.7x10⁵ to 2.6x10⁵ i.e., to very high molecular weight dextrins. The molecular weight of Fr-I was >108. Although the highest proportion (>85%) of Fr-I was seen in waxy rice, wheat and green gram, in case of native starches, finger millet starch was the most resistant to enzyme hydrolysis among all the starches studied. It has already been shown that finger millet starch in granular form was also t he most resistant to acid hydrolysis (Singh and Ali, 2000) which was suggestive of its granular make-up. The present results indicate that not only the granular but also the molecular architecture of finger millet starch is such that proneness to enzyme attack is also the least as compared to other starches.
It can be further noted from the data of carbohydrate content of Fr-I of hydrolysed starches that the resistance in the decreasing order was for finger millet, potato, chick pea, rice, sorghum, green gram, wheat, tapioca, waxy rice and maize. Surprisingly the pattern bears similarity in general with the data reported by Leach and Schoch (1961) for α-amylase hydrolysis of starch in granular form.
Data on absorption maxima of iodine complex of the eluted fractions is also included in Fig. 3. It could be seen that λmax value of all the fractions of enzyme hydrolysed products was less comp0ared to corresponding native starches. Maximum drop (100 nm) was seen in the λmax values of Fr-IIA, which had comparatively high values in the case of native starches. Among the hydrolysed starch fractions, Fr. IIB had a peak, the λmax of which was very close to that of Fr. I of native starch. However, this λmax peak appeared in the tubes in the beginning of the Fr. IIB whereas the carbohydrate peak in the same fraction was in its later half. This would mean the carbohydrate corresponding to this peak represents long linear chain fraction presumably coming from the external chains of the amylopectin molecule. That the λmax of the Fr-IIA was reduced to the highest level as compared to the native starch, indicates that the hydrolysed product contained many branch points. It has been reported by many workers that α -amylase does not hydrolyse α-(1->6) linkages but attacks only α-(1->4) linkages randomly and mainly in the internal region of the molecule (Whelan, 1964; Manners, 1979; Robyt, 1984). The present results are in support of these conclusions.
In contrast, the hydrolysed products from acid hydrolysis of the granular starch reported earlier (Singh and Ali, 2000) had λmax values lower than that of native starch, although the peak for iodine complex λmax and the peak for carbohydrate content was in the same elution tubes. However, the decrease was lesser (15 to 50 nm) in comparison to that for enzyme hydrolysis (100 nm).
REFERENCES
- Ali, S.Z. and W. Kempf, 1986. On the degradation of potato starch during acid modification and hypochlorite oxidation. Starch, 38: 83-86.
CrossRef - Batlle, N., J.V. Carbonell and J.M. Sendra, 2005. Determination of depolymerisation kinetics of amylose, amylopectin and maltodextrin by Aspergillus niger, glucoamylase using a 2-p-toluidinylnaphthalener-6-sulfonate/flow-injection analysis system with fluorimetric detection. Food Sci. Technol. Int., 11: 139-147.
Direct Link - Dranzek, B.L., P. Hwang and W. Bushuk, 1972. Scanning electron microscopy of starch from sprouted wheat. Cereal Chem., 49: 232-239.
Direct Link - DuBois, M., K.A. Gilles, J.K. Hamilton, P.A. Rebers and F. Smith, 1956. Colorimetric method for determination of sugars and related substances. Anal. Chem., 28: 350-356.
CrossRefDirect Link - Fuwa, H., Y. Sugimoto and T. Takaya, 1979. Scanning electron microscopy of starch granules, with or without amylase attack. Carbohydr. Res., 70: 233-238.
Direct Link - Hollinger, G. and R.H. Marchessault, 1975. Ultrastructure of acid-and enzyme modified cross-linked potato starch. Biopolymers, 14: 265-276.
Direct Link - Mussulman, W.C. and J.A. Wagonar, 1968. Electron microscopy of unmodified and acid-modified corn starches. Cereal Chem., 45: 162-171.
Direct Link - Singh, V. and S.Z. Ali, 1987. Comparative acid modification of various starches. Starch Starke, 39: 402-405.
Direct Link - Singh, V. and S.Z. Ali, 2000. Acid degradation of starch the effect of acid and starch type. Carbohydr. Polym., 41: 191-195.
Direct Link - Yamaguchi, M., K. Kainuma and D. French, 1979. Electron microscopic observations of waxy maize starch. J. Ultrastruct. Res., 69: 249-261.
Direct Link