
Nobuko Mori
Department of Veterinary Biochemistry, School of Veterinary Medicine, Nippon Veterinary and Life Science University, 1-7-1 Kyonancho, Musashino, Tokyo 180-8602, Japan
Gebin Li
Department of Veterinary Biochemistry, School of Veterinary Medicine, Nippon Veterinary and Life Science University, 1-7-1 Kyonancho, Musashino, Tokyo 180-8602, Japan
Megumi Fujiwara
Department of Veterinary Biochemistry, School of Veterinary Medicine, Nippon Veterinary and Life Science University, 1-7-1 Kyonancho, Musashino, Tokyo 180-8602, Japan
Shingo Ishikawa
Department of Veterinary Biochemistry, School of Veterinary Medicine, Nippon Veterinary and Life Science University, 1-7-1 Kyonancho, Musashino, Tokyo 180-8602, Japan
Koh Kawasumi
Department of Veterinary Biochemistry, School of Veterinary Medicine, Nippon Veterinary and Life Science University, 1-7-1 Kyonancho, Musashino, Tokyo 180-8602, Japan
Ichiro Yamamoto
Department of Veterinary Biochemistry, School of Veterinary Medicine, Nippon Veterinary and Life Science University, 1-7-1 Kyonancho, Musashino, Tokyo 180-8602, Japan
Toshiro Arai
Department of Veterinary Biochemistry, School of Veterinary Medicine, Nippon Veterinary and Life Science University, 1-7-1 Kyonancho, Musashino, Tokyo 180-8602, Japan
Asian Journal of Animal and Veterinary Advances
Year: 2014 | Volume: 9 | Issue: 2 | Page No.: 134-143


ABSTRACT
The prevalence of obese cats has increased because of over calorie diet and physical inactivity. Obesity has been found to be associated with oxidative stress and Reactive Oxygen Species (ROS). Unfortunately oxidative stress status at the early phase of obesity in high fat fed cats is not well understood. The objectives of this study were (1) To evaluate lipid and glucose metabolism using enzymatic, hormonal and oxidative stress biomarkers at the early obese phase of cats fed on a high-fat diet and (2) To identify rapidly changing variables to use as a diagnostic marker for lipid metabolic disorders in cats. Total 13 domestic female cats were divided into two groups which were fed on control and high-fat diet for eight weeks, respectively. After the feeding period, they were compared in metabolic variables and oxidative stress markers in plasma and tissues. As results, High-fat diet including much long chain fatty acids promoted rapid changes in lipid metabolism, particularly accelerated β-oxidation of fatty acids and oxidative stress in the liver of the cats. G6PD, GPx and SOD were increased in the liver. Insulin resistance was not apparent at the early phase of obesity in cats. Plasma activities of SOD also increased at the early phase of obesity in cats. Remarkable alternation for oxidative stress in liver was observed at the early phase of obesity in cats fed on high fat diet and SOD may be a potential marker of the early phase of obesity in cats.
PDF Abstract XML References Citation
Received: November 08, 2013;
Accepted: February 17, 2014;
Published: April 10, 2014
How to cite this article
Nobuko Mori, Gebin Li, Megumi Fujiwara, Shingo Ishikawa, Koh Kawasumi, Ichiro Yamamoto and Toshiro Arai, 2014. Lipotoxicity Observed at the Early Phase of Obesity in Cats Fed on High-fat Diet. Asian Journal of Animal and Veterinary Advances, 9: 134-143.
DOI: 10.3923/ajava.2014.134.143
URL: https://scialert.net/abstract/?doi=ajava.2014.134.143
DOI: 10.3923/ajava.2014.134.143
URL: https://scialert.net/abstract/?doi=ajava.2014.134.143
INTRODUCTION
Obesity has increased markedly in small domestic animals worldwide as in human. Some evidence suggests that about 25% of cats brought to veterinary hospitals are obese (Butterwick, 2000). Some evidence also indicates that fat accumulation in tissues is closely related to occurrence of metabolic syndrome, diabetes mellitus, hepatic disorders, cardiovascular disease and cancers in increasingly obese human populations (Higdon and Frei, 2003; Keaney et al., 2003; Suzuki et al., 2003). Furthermore, obesity has been found to be associated with oxidative stress (D’Archivio et al., 2012) and Reactive Oxygen Species (ROS) which are the result of direct and indirect inflammatory mediators and have significant associations with obesity in humans (Dandona et al., 2001). The prevalence of obese cats has increased because of over calorie diet and physical inactivity, as in case of humans. In addition, oxidative stress status by high-fat feeding at the early phase of obesity in cats is not well understood. The deleterious effect of tissue fat accumulation on glucose metabolism was coined by Unger (2003) as the term “lipotoxicity”. And lipotoxicity-mediated dysfunction leads insulin resistance followed by diabetes mellitus (Gehrmann et al., 2010). Thus, the objectives of this study were (1) To evaluate lipid and glucose metabolism using enzymatic, hormonal and oxidative stress biomarkers at the early phase of obesity in cats fed on high-fat diet (HFdiet) and (2) To identify rapidly changing variables to use as diagnostic maker for lipid metabolic diseases in cats.
MATERIALS AND METHODS
Animals: In this study, 13 cats (domestic female, aged from 10 to 30 months, not spayed) were used. Veterinarians diagnosed that they were healthy and without any clinical manifestations. All cats were housed individually and maintained for eight weeks at AQS Co. Ltd. (Narita, Japan). Cats were divided into two groups. One was a control group with five cats: mean±SD body weight (BW): 2.40±0.32 kg; age: 10±0 months. During the experimental period, these cats were fed on a commercial diet (Zoo animal diet ZN for cats, Oriental Yeast Co. LTD., Tokyo, Japan). The components of commercial diet were moisture (5.5%); crude protein (33.6%); crude fat (16%); crude fiber (3.5%); crude ash (5.8%) and nitrogen free extract (35.9%). The caloric content was 4210 kcal kg-1. The other eight cats (BW: 2.55±0.33 kg; Age: 14.9±6.7 months) were fed on a high-fat diet (HF diet), made to order from Nippon Pet Food, Inc., (Tokyo, Japan). The composition of the HF diet was moisture (7.0%); crude protein (32.7%); crude fat (23.9%); crude fiber (0.9%); crude ash (5.5%) and nitrogen free extract (29.9%). The energy fat composition was 46.2% and caloric content was 4660 kcal kg-1. The fatty acid composition in the HF diet is shown in Table 1. Cats in the two groups (control and HF diet) were fed on respective diets ad libitum for their daily energy requirement (DER) from 9:00 AM to 8:30 AM of the next day. On the day for blood sampling, any surplus diet was removed at 4:00 PM of the previous day. DER was calculated as 1.4xRER (BW0.75x70). RER is the resting energy requirement for each cat on the basis of its BW before the meal at 9:00 AM. Incidentally, before the experiment, all cats were maintained with the same commercial diet (Zoo animal diet ZN for cats, Oriental Yeast Co., Ltd., Tokyo. Japan).
| Table 1: | Components of fatty acids included in high-fat diet for cats |
 | |
Cats were housed in individual cages and provided with water ad libitum. The animal room was maintained at 24±2°C and at 55±10% relative humidity on a 12:12 h light: dark cycle (light on 8:00 AM to 8:00 PM). This study was approved by the Nippon Veterinary and Life Science University Animal Research Committee.
Blood sampling and collection of tissue samples: Preprandial blood (5 mL) was withdrawn from the jugular vein of overnight fasted cats into heparinized tubes before and after the control and HF diets feeding experiment. The blood samples were immediately centrifuged at 1700 g for 10 min at 4°C to obtain plasma and stored at -80°C until analyzed. And each two animals of two groups were fasted for overnight and premeditated with 0.05 mg kg-1 of BW acepromazine malate (Tech America, KS, US) and anesthetized with isoflurane. Liver and adipose tissues samples (0.2-0.3 g) were taken from the anesthetized animals by laparotomy and all procedure were performed under minimal stress conditions to the animals. Cytosol fractions of liver and adipose tissues were isolated by the previous described method (Washizu et al., 1999). All fractions were prepared and stored at -80°C until analyzed.
Plasma metabolic variables and oxidative stress markers: Plasma glucose, triglyceride (TG) and total cholesterol concentrations, lactate dehydrogenase (LDH), aspartate aminotransferase (AST), alanine aminotransferase (ALT) and alkaline phosphatase (ALP) activities were determined using an auto analyzer with the manufacturer’s reagents (Monolis, Inc., Tokyo, Japan). Non esterified fatty acids (NEFA) concentrations were measured using a commercial kit (NEFA-C test, Wako Pure Chemical Industries, Tokyo, Japan). Plasma adiponectin and insulin concentrations were measured with a commercial kit, Mouse/Rat Adiponectin ELISA Kit, (Otsuka, Tokyo, Japan) and Cat Insulin ELISA kit, (SHIBAYAGI Co., Gunma, Japan) respectively. The insulin specific antibody contained in the Cat Insulin ELISA kit was shown not to cross-react with pro-insulin. Plasma levels of glutathione peroxidase (GPx) and superoxide dismutase (SOD) as antioxidant enzymes , malonaldehyde (MDA) as the oxidative stress marker which are formed at the end of long oxidative processes were measured using commercial kits (GPx: Colorimetric assay kit for glutathione peroxidase activity, Northwest Life Science Specialties LLC, Vancouver, WA, USA; SOD: Colorimetric Assay for Superoxide Scavenging Activity, Northwest Life Science Specialties LLC, Vancouver, WA, USA; MDA: Malondialdehyde Assay kit, Northwest Life Science Specialties LLC, Vancouver, WA, USA). Glucose-6-phosphate dehydrogenase (G6PD) activities as an antioxidant enzyme in cytosol fraction of liver and subcutaneous fat were determined by spectrophotometric methods (Bergmeyer, 1984). Enzyme activities in cytosol fractions are expressed as mU per mg of protein in the fractions. The enzyme unit (U) was defined as 1 μmoL of substrate degraded min-1. Protein concentration in the fractions was determined by the Bradford assay (Bradford, 1976) using bovine serum albumin as a standard.
Histopathological analysis of hepatic cells: Hepatic tissues in cats fed on control diet and HF diet were stained with Oil Red O. Each tissue preparation was assayed microscopically.
Statistical analysis: Results are given as means±standard deviations (SD). One-way ANOVA with Holm-Sidak multiple comparisons and Kruskal-Wallis with Dunn’s method on multiple comparisons were used to compare groups for plasma analysis results. Statistical significance was set at p<0.05 for One-way ANOVA. Statistical analysis was done using Sigmaplot software (Sigmaplot 11.0, Build 11.0.077; Systat Software, Inc., San Jose, CA, USA).
RESULTS
Body weight and plasma metabolic parameters: Results of plasma metabolic parameters of all cats are shown in Table 2. Control and HF diet cat showed significant body weight gains after feeding for eight weeks (p = 0.003). Plasma AST and ALT activities of HF diet cats increased significantly after HF diet feeding (AST: p = 0.003; ALT: p = 0.046). Insulin concentrations in plasma of HF diet cats decreased significantly after HF diet feeding (p<0.001). Triglyceride concentrations showed a downward trend and adiponectin and NEFA levels showed an upward trend in HF diet cats after HF diet feeding.
Oxidative stress markers in plasma and lipid metabolizing tissues: Figure 1 shows GPx and SOD activities and MDA concentrations as oxidative stress markers in plasma of cats. Plasma SOD activities of HF diet cats was significantly higher than after control diet cats. GPx activities increased, but MDA concentration didn’t change in plasma of HF diet cats after 8 weeks feeding periods. Table 3 shows activities of enzymes as oxidative stress marker in liver and subcutaneous fat of two cats from each group as in liver of HF diet cats, G6PD, GPx and SOD activities increased greatly compared to those of the control cats, whereas these three enzyme activities in adipose tissue didn’t change in HF diet cats.
Histopathological changes in liver of cats: Figure 2 shows the histopathological changes in liver of the control diet cat (Fig. 2a) and HF diet cat (Fig. 2b) after feeding. Figure 2b showed that numerous fat droplets were observed inside and outside cells. However, these hepatic cells had not yet become larger or undergone differentiation.
| Table 2: | Comparison of plasma metabolite and horomone concentrations and enzyme activities in control and high-fat diet cats |
 | |
| Values are presented as means±SD, HF: High fat diet feeding cats, *: Significantly different from control diet cats after feeding (Holm-sidak one-way ANOVA p<0.05), **: Significantly different from HF diet cats before feeding (Holm-sidak one-way ANOVA p<0.05) | |
 | |
| Fig. 1(a-c): | Oxidative stress marker activities in plasma.Oxidative stress marker activities in cat plasma before and after feeding control diet and high-fat diet, (a) Glutathione peroxidase (GPx), (b) Superoxide dismutase (SOD), (c) Malonaldehyde (MDA), Control diet cats (n = 5). High-fat diet cats (n = 8). Results are expressed as Means±SD. GPx and MDA were used Holm-Sidak One-way ANOVA as normality test of them were passed. SOD was used Kruskal-Wallis One-Way ANOVA and Dunn’s method on multiple comparisons. *: Significantly different from after control diet cats (p<0.05) |
DISCUSSION
Plasma metabolite concentrations reflect changes in the physical conditions of animals with metabolic disorders (Downs et al., 1997; Pitkanen et al., 1999). Hormones and enzymes in plasma are frequently used as diagnostic indicators of metabolic disorders (Neumann et al., 2008). Increases in plasma TG and ALT levels are clinical signs indicating fat accumulation in the liver of animals (Hsiao et al., 2007; Iacobellis et al., 2008).
| Table 3: | G6PD, GPx and SOD activities in tissue of cats fed on control and HF diets |
 | |
| G6PD: Glucose-6-phosphate dehydrogenase, GPx: Glutathione peroxidase, SOD: Superoxide dismutase HF: High fat diet, Enzyme activities are presented as mU mg-1 protein | |
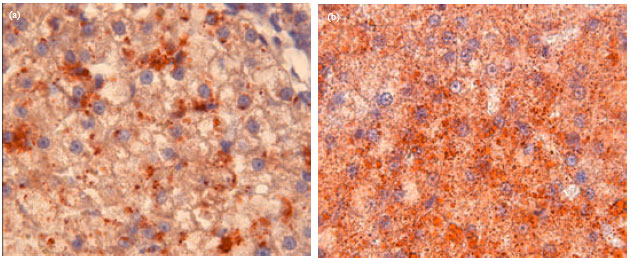 | |
| Fig. 2(a-b): | Histopathological changes in liver of cats after 8 weeks feeding, (a) Hepatic cells in control diet cat and (b) Hepatic cells in high-fat diet cat, both tissue preparations were stained with Oil red O Magnification: 1000x |
Understanding the physiological changes induced by obesity could be used to prevent excess body fat accumulation and manage obesity-induced diseases, such as diabetes mellitus and hyperlipidemia.
In this study, we examined some of these markers in order to evaluate lipid and glucose metabolism and fatty acid oxidation status at the early phase of obesity in cats fed on HF diet for eight weeks. Our results showed that some metabolic variables such as plasma glucose, triglyceride, total cholesterol, adiponectin, NEFA, ALP and LDH did not change significantly despite significant gain in body weight after the HF diet feeding. In contrast, plasma ALT and AST activities in the after HF diet cats were significantly higher than those in the controls. Increased ALT and AST activities at the early phase of obesity in cats suggest that slight hepatic lesion was induced by excess lipids into the liver. Thus, β-oxidation of fatty acid in the liver may be activated by feeding cats with HF diet.
Previous reports indicated that HF diet containing much long chain fatty acids promoted fatty acid β-oxidation and suppressed glycolysis in the liver. As a consequence, long chain fatty acids accumulate to greater extent in body fat compared to medium chain fatty acids (Papamandjaris et al., 1998; Geliebter et al., 1983). Long chain triacylglycerols fed rats have lower oxygen consumption and sympathetic activation of brown adipose tissue than medium chain triacylglycerols fed rats (Rothwell and Stock, 1987; Young and Walgren, 1994). These long chain fatty acids in the HF diet might promote β-oxidation in the cat liver. In hepatic cells, Radical Oxygen Species (ROS) and lipoperoxide production are associated with acceleration of β-oxidation of fatty acids in mitochondria which induces increased risk of hepatic inflammation and cirrhosis. G6PD, GPx and SOD activities in the livers of HF diet cats were higher than those in the control cats. This finding indicated that G6PD, GPx and SOD activities in liver might be used highly sensitive oxidative stress markers. G6PD activity was approximately 4 to 6-fold higher, GPx activity was approximately 3 to 10-fold higher and SOD in hepatic tissue was 2 to 4-fold higher in the HF diet cats compared to the control cats.
Some evidence for human type 2 diabetes mellitus patients have suggested a decrease in anti-oxidant defense markers such as GPx and SOD and an increase in oxidative damage markers such as MDA (Kasznicki et al., 2012; Piwowar et al., 2007; Ziegler et al., 2004). These findings didn’t agree with our present results. However, the above changes are reported in the type 2 diabetes mellitus patients with obesity for over several years. In obesity related human type2 diabetes mellitus, SOD activities in erythrocytes and plasma MDA concentrations increased markedly and these findings indicated elevations of lipid oxidation in tissues (Moussa, 2008). Also, total SOD activity and lipid peroxidation were higher in diabetics compared to non-diabetics (De Bandeira et al., 2012). Increased plasma SOD activities in obese cats with HF diet possibly indicate defensive reaction against elevation of ROS production owing to accelerated β-oxidation of excess fatty acids.
Table 4 shows a summary of changes in plasma metabolic parameters in obese cats referencing previous studies (Tanner et al., 2007; Fettman et al., 1998). Some similar metabolic changes are observed in obese cats. Changes in plasma lipid concentrations as abnormality in lipid metabolism precede changes in plasma glucose concentrations or occurrence of insulin resistance at the early phase of obesity in cats. However, Fettman et al. (1998) demonstrated that body weight gains were remarkably correlated with plasma insulin concentrations. Plasma insulin concentrations may not be an adequate responding marker for acute obesity but they may be a distinguishing marker for chronic obesity for a long period. The obese cats in the study by Fettman et al. (1998) exhibited insulin resistance after six months of be obese.
| Table 4: | Changes in plasma metabolic parameters in obese cats |
 | |
 | |
| Fig. 3: | Flow chart of changing metabolic conditions in obese cats due to high-fat diet ROS: Reactive oxygen species |
Lipid metabolism is considered quickly to be responded alternatively at the early phase of obesity in cats. Acceleration of β-oxidation of fatty acids may promote ROS production in the liver which would trigger the onset of inflammation in the obese cats. Oxidative stress induces insulin resistance, glucose intolerance and diabetes mellitus in humans (Ceriello and Motz, 2004). Severe oxidative stress and inflammation for a long period may result in damage of pancreatic β-cell with low anti-oxidant activity (Valko et al., 2007). ROS at high concentrations cause disturbances both in cell signaling and gene expression associated with lesions in pancreatic β-cells (Maechler et al., 1999). Consequently, oxidative stress and low grade inflammation may lead insulin resistance in obese animal with abnormality in lipid metabolism (Fig. 3). Series of these changes in lipid metabolism is summarized as lipotoxicity (Loria et al., 2013).
Unfortunately, we were unable to adequately determine oxidative stress marker activities in lipid metabolizing tissues because of an insufficient number of cats. However, it was proved that oxidative stress markers levels changed quickly in plasma of obese cats reflecting oxidative status in livers.
CONCLUSION
In Conclusions, Feeding a HF diet including several long chain fatty acids to cats promoted rapid changes in lipid metabolism, such as accelerated β-oxidation of fatty acids leading oxidative stress in the liver. Increasing anti-oxidative stress markers may be activated earlier in order to defend against augmented ROS production in the liver. Similarly, SOD, an anti-oxidative stress marker in plasma, increased significantly at the early phase of obesity in cats. At the early phase of obesity in cats fed on HF diet, plasma adiponectin concentrations were considerably high and plasma TG, cholesterol and NEFA concentrations were maintained with the control ranges. Insulin resistance was not apparent at the early phase of obesity in cats. Before Plasma metabolites and hormones as diagnostic markers for hyperlipidemia and diabetes mellitus change remarkably, oxidative stress is induced in liver in obese cats fed on HF diet. Our study indicated that alternation for oxidative stress was observed at the early phase of obesity in cats fed on HF diet and plasma SOD activity may be a potential marker at the early phase of obesity in cats.
ACKNOWLEDGMENTS
This study was supported in part by the Strategic Research Base Development Program for Private Universities from the Ministry of Education, Culture, Sports, Science and Technology of Japan (MEXT), 2008-2012.
REFERENCES
- De Bandeira, S., M., S.G. da Guedes, L.J. da Fonseca, A.S. Pires and D.P. Gelain et al., 2012. Characterization of blood oxidative stress in type 2 diabetes mellitus patients: Increase in lipid peroxidation and SOD activity. Oxid. Med. Cell. Longevity, Vol. 2012.
CrossRefDirect Link - Bradford, M.M., 1976. A rapid and sensitive method for the quantitation of microgram quantities of protein utilizing the principle of protein-dye binding. Anal. Biochem., 72: 248-254.
CrossRefPubMedDirect Link - Ceriello, A. and E. Motz, 2004. Is oxidative stress the pathogenic mechanism underlying insulin resistance, diabetes and cardiovascular disease? The common soil hypothesis revisited. Arteriosclerosis Thrombosis Vasc. Biol., 24: 816-823.
CrossRefDirect Link - Dandona, P., P. Mohanty, H. Ghanim, A. Aljada and R. Browne et al., 2001. The suppressive effect of dietary restriction and weight loss in the obese on the generation of reactive oxygen species by leukocytes, lipid peroxidation and protein carbonylation. J. Clin. Endocrinol. Metab., 86: 355-362.
CrossRefPubMedDirect Link - D'Archivio, M., G. Annuzzi, R. Vari, C. Filesi and R. Giacco et al., 2012. Predominant role of obesity/insulin resistance in oxidative stress development. Eur. J. Clin. Invest., 42: 70-78.
CrossRefDirect Link - Downs, L.G., S.M. Crispin, V. LeGrande-Defretin, G. Perez-Camargo, T. McCappin and C.H. Bolton, 1997. The influence of lifestyle and diet on the lipoprotein profile of Border Collies. Res. Vet. Sci., 63: 35-42.
CrossRef - Fettman, M.J., C.A. Stanton, L.L. Banks, D.E. Johnson, D.W. Hamar, R.L. Hegstad and S. Johnston, 1998. Effects of weight gain and loss on metabolic rate, glucose tolerance and serum lipids in domestic cats. Res. Vet. Sci., 64: 11-16.
CrossRefPubMedDirect Link - Geliebter, A., N. Torbay, E.F. Bracco, S.A. Hashim and T.B. Van Itallie, 1983. Over feeding with medium-chain triglyceride diet results in diminished deposition off at. Am. J. Clin. Nutr., 37: l-4.
PubMedDirect Link - Higdon, J.V. and B. Frei, 2003. Obesity and oxidative stress: A direct link to CVD? Arterioscler. Thromb. Vasc. Biol., 23: 365-367.
CrossRef - Hsiao, P.J., K.K. Kuo, S.J. Shin, Y.H. Yang and W.Y. Lin et al., 2007. Significant correlations between severe fatty liver and risk factors for metabolic syndrome. J. Gastroenterol. Hepatol., 22: 2118-2123.
PubMed - Kasznicki, J., M. Kosmalski, A. Sliwinska, M. Mrowicka, M. Stanczyk, I. Majsterek and J. Drzewoski, 2012. Evaluation of oxidative stress markers in pathogenesis of diabetic neuropathy. Mol. Biol. Rep., 39: 8669-8678.
CrossRef - Keaney Jr., J.F., M.G. Larson, R.S. Vasan, P.W. Wilson and I. Lipinska et al., 2003. Obesity and systemic oxidative stress: Clinical correlates of oxidative stress in the framingham study. Arteriosclerosis Thrombosis Vasc. Biol., 23: 434-439.
CrossRefPubMedDirect Link - Maechler, P., L. Jornot and C.B. Wollheim, 1999. Hydrogen peroxide alters mitochondrial activation and insulin secretion in pancreatic beta cells. J. Biol. Chem., 274: 27905-27913.
PubMed - Moussa, S.A., 2008. Oxidative stress in diabetes mellitus. Rom. J. Biophys., 18: 225-236.
Direct Link - Neumann, S., H. Welling, T. Bilzer and S. Thuere, 2008. Myopathy and alterations in serum 3-methylhistidine in dogs with liver disease. Res. Vet. Sci., 84: 178-184.
CrossRef - Papamandjaris, A.A., D.E. MacDougall and P.J. Jones, 1998. Medium chain fatty acid metabolism and energy expenditure: Obesity treatment implications. Life Sci., 62: 1203-1215.
PubMed - Pitkanen, O.M., H. Vanhanen and E. Ptkanen, 1999. Metabolic syndrome is associated with changes in D-mannose metabolism. Scand. J. Clin. Lab. Invest., 59: 607-612.
PubMed - Piwowar, A., M. Knapik-Kordecka and M. Warwas, 2007. AOPP and its relations with selected markers of oxidative/antioxidative system in type 2 diabetes mellitus. Diabetes Res. Clin. Pract., 77: 188-192.
CrossRefDirect Link - Rothwell, N.J. and M.J. Stock, 1987. Stimulation of thermogenesis and brown fat activity in rats fed medium chain triglyceride. Metabolism, 36: 128-130.
CrossRefDirect Link - Suzuki, K., Y. Ito, J. Ochiai, Y. Kusuhara and S. Hashimoto et al., 2003. Relationship between obesity and serum markers of oxidative stress and inflammation. Asian Pac. J. Cancer Prev., 4: 259-266.
PubMed - Tanner, A.E., J. Martin and K.E. Saker, 2007. Oxidative stress and inflammatory state induced by obesity in the healthy feline. J. Anim. Physiol. Anim. Nutr., 9: 163-166.
CrossRefDirect Link - Unger, R.H., 2003. Lipid overload and overflow: Metabolic trauma and the metabolic syndrome. Trends Endocrinol. Metab., 14: 398-403.
PubMed - Valko, M., D. Leibfritz, J. Moncol, M.T.D. Cronin, M. Mazur and J. Telser, 2007. Free radicals and antioxidants in normal physiological functions and human disease. Int. J. Biochem. Cell Biol., 39: 44-84.
CrossRefPubMedDirect Link - Washizu, T., A. Tanaka, T. Sako, M. Washizu and T. Arai, 1999. Comparison of the activities of enzymes related to glycolysis and gluconeogenesis in the liver of dogs and cats. Res. Vet. Sci., 67: 205-206.
PubMedDirect Link - Young, J.B. and M.C. Walgren, 1994. Differential effects of dietary fats on sympathetic nervous system activity in the rat. Metabolism, 43: 51-60.
CrossRefDirect Link - Ziegler, D., C.G. Sohr and J. Nourooz-Zadeh, 2004. Oxidative stress and antioxidant defense in relation to the severity of diabetic polyneuropathy and cardiovascular autonomic neuropathy. Diabetes Care, 27: 2178-2183.
Direct Link