
Fozia Bashir
Faculty for GIS and RS
Fatima Jinnah Women University Rawalpindi, Pakistan
Tayyab Ikram
Faculty for GIS and RS
Fatima Jinnah Women University Rawalpindi, Pakistan
Journal of Medical Sciences
Year: 2003 | Volume: 3 | Issue: 3 | Page No.: 227-239


ABSTRACT
Epidemiological Surveillance allows tracking down sources of diseases and the movement of contagions. So health agencies can respond more effectively to the outbreaks of epidemics by identifying populations at risk. The surveillance system currently working in Pakistan is the Disease Early Warning System (DEWS) based on the Health Management Information System (HMIS). Malaria is one of the DEWS. Malaria is caused by parasite of Plasmodium species, which are transmitted to humans through the bite of female Anopheline mosquito. Vector-borne diseases such as malaria are highly influenced by spatial and temporal changes in the environment. The purpose of this research was to study relationships between the environmental and climatic variables, using Remote Sensing (RS) and Geographic Information System (GIS) as surveillance tools for predictions of malaria incidences at the village level. A low risk district of Rawalpindi was selected for the occurrence of malaria to identify potential hot spots, which provided ideal conditions for the outbreaks of malaria epidemics. The findings looked in to the need for conducting surveillance at the village level, where the actual out breaks takes place rather than district level.
PDF Abstract XML References Citation
How to cite this article
Fozia Bashir and Tayyab Ikram, 2003. Implementation of Disease Early Warning System on Malaria. Journal of Medical Sciences, 3: 227-239.
DOI: 10.3923/jms.2003.227.239
URL: https://scialert.net/abstract/?doi=jms.2003.227.239
DOI: 10.3923/jms.2003.227.239
URL: https://scialert.net/abstract/?doi=jms.2003.227.239
INTRODUCTION
Emerging infectious disease pose a growing health threat to people everywhere. Some emerging infections result from deforestation, increased development, climate changes and other environmental changes that bring people into contact with animals or insects that harbour diseases only rarely encountered before. However, others are familiar diseases that have developed resistance to the antibiotics that brought them under control just a generation ago. Infectious diseases account for considerable health care costs and lost productivity. The number of pathogens resistant to one or more previously effective antibiotics is increasing rapidly, reducing treatment options and adding to health care costs. Surveillance is the primary public health tool to detect and monitor infections. The surveillance of a communicable disease is fundamental for disease prevention and control. According to the World Health Organization (WHO) Surveillance is defined as the “ongoing systematic collection, collation, analysis and interpretation of data; and the dissemination of information to those who need to know in order that action may be taken”.
In Pakistan the Health Management Information System (HMIS), is able to collect, process, analyze and provide feedback on all health related data. HMIS is currently generating information that flows directly from the FLCFs (First Level Care Facilities) to the district and provincial level (National HMIS Cell, 1999).
In Pakistan for the purpose of surveillance and outbreak prediction Disease Early Warning System (DEWS) is being used. DEWS is operational at FLCFs of the health system and is an integral part of the district HMIS. The main goal of the DEWS is to minimize morbidity and mortality due to communicable disease by detecting epidemics at their earliest possible stages. Under the DEWS, one Medical Officer and one laboratory technician at each health facility are given training to focus on the suspected signs and symptoms rather than the probable or the confirmed cases.
Malaria is one of the most devastating tropical diseases in the world, which is estimated to cause up to 500 million clinical cases and over one million deaths each year (Malaria Foundation International, 1998).
The mosquito vector is always a female Anopheline, although, out of the 380 species, only 60 can transmit malaria. Any one of four different blood parasites, called Plasmodia causes malaria (Bradely, 1996).
The case definition of suspected malaria followed by the DEWS is as follows, “Any person within acute illness that demonstrates intermittent fever (period of relative well being in between the episodes of fever) and chills (shivering), headache, body aches, nausea and vomiting” (The National Institute of Health, 2001).
The three main climate factors that affect malaria are temperature, precipitation, and relative humidity. Climate predicts, to a large degree, the natural distribution of malaria. Malaria parasite must first breed up in the salivary gland of the female Anopheline mosquito. Time taken for the agent to complete its sexual phase in the mosquito varies with its species and the temperature. At 20°C Plasmodium vivax completes this stage in 16-17 days, and Plasmodium falciparum 22-23 days. An increase in temperature to 27.5°C of 30°C may result in a having of these periods (May, 1961).
Anopheline mosquitoes breed in water habitats, thus requiring just the right amount of precipitation in order for mosquito breeding to occur. Too much rainfall, or rainfall accompanied by storm conditions can flush away breeding larvae. Not only the amount and intensity of precipitation, but also the time in the year, whether in the wet or dry season, affects malaria survival. Rainfall also affects malaria transmission because it increases relative humidity and modifies temperature, and it also affects where and how much mosquito breeding can take place. Anopheline mosquitos’ breeding sites vary greatly with regards to species.
Epidemics of malaria are caused by a disturbance of the equilibrium between host, parasite and vector. There are three different types of epidemics. Type I epidemics are caused by meteorological conditions, which create temporary epidemics that will eventually revert back to the previous condition.
Type II epidemics are caused by landscape changes or colonization of sparsely populated areas that create a new equilibrium level of endemicity.
Type III epidemics are caused by interruptions in measures that were controlling malaria (Reid, 2000).
Malaria is diagnosed by a blood test to check for parasites. Malaria is now considered and emerging infectious disease due to resurgence in cases caused by Plasmodium falciparum, the most deadly of the four human malaria parasites. Urban migration, poverty, and poor sanitation have returned malaria to cities where it once was eliminated. New roads, logging, and irrigation have drawn people into once-isolated areas where mosquitoes thrive. Refugees, migrants, and tourists have spread the disease across borders.
Malaria remains a major persistent public health problem in many areas of Pakistan. As Pakistan is a relatively moderate endemic country where transmission is sessional and large-scale epidemics have been reported in the past. The disease is being kept under control with a well-established control programme. The current figures show Annual Parasite Incidence (API) as 0.74 cases per 1000 population. Province wise percentage of API is highest in Balochistan (API=4.96) followed by NWFP (API=1.43), Sindh (API=0.74) and Punjab (API=0.17) (Malaria Directorate, 2002).
The rainy season in Pakistan is associated with an increase in malaria. In Pakistan the pre-monsoon showers begin in early July and continue to blow up to September (Karim, 1998). Incidence of malaria intensifies during the monsoon between July and September. As the temperature are above 20°C and relative humidity is above sixty percent. Where as for both vector and parasite the optimum temperature are 25 to 27°C and relative humidity above sixty favours malaria transmission (McMichael et al., 1996).
A Geographic Information System is a computer-based system for inputting, storing, accessing, analyzing and presenting spatially referenced data from various sources in the form of maps. The GIS can therefore create a link between spatial data and their related descriptive information. A GIS is combination of hardware (computers, digitizing table, scanner), GPS (global positioning system), plotter, printer, and specific software.
Satellite Remote Sensing can be used as a complementary tool to GIS. Remote Sensing is the science and technology, by which the characteristics of object of interest can be identified, measured or analyzed the characteristics without direct contact. Electromagnetic radiation, which is reflected or emitted from an object, is the usual source of remote sensing data.
Satellite imagery in digital format allows for the acquisition of environmental data and land occupation patterns and features over large areas. Sensors in satellites record multi spectral data from different wave bands in digital format. Different features of the terrain reflect differently in each Wac band, allowing for their recognition in the images. The digital image is fed into the computer, where it is stored.
In Peoples Republic of China an initial attempt was made to apply disease mapping through Geographical Information System with multiple regression analysis to determine the nature and extent of factors influencing malaria transmission in Yunnan Province, particularly in border areas (Hu et al., 1998).
In California, United States of America a study was conducted using Landsat TM (Satellite) data with 30 m resolution, this data was incorporated with GIS and high mosquito producing rice fields were identified in California. Distances between rice fields and source of blood meal for mosquitoes, which were the pastures with livestock, were measured using GIS.
An Epidemiological and ecological study was conducted to determine the correlation between various factors contributing to malaria transmission along the Thai-Cambodia borders using retrospective and prospective data. LANDSAT satellite imagery was used to produce a land cover map for 1995. Land cover changes between 1985, 1990 and 1995 were analysed using a Geographic Information System. The results of this study showed that there are changes in the incidence of malaria transmission and vegetation cover between 1985, 1990 and 1995 in the study area (Nualchawee et al., 2001).
In India remote sensing and geographic information system was used in understanding malaria transmission dynamics at the local level. RS was used to determine mosquito production in the Sanjay Lake and surrounding areas in Delhi (Sharma et al., 1997).
Geographic information systems, remote sensing, are now considered important new tools for the study and control of malaria. Keeping this in mind this study has been designed to use GIS as a tool for the implementation of DEWS. Among the fifteen diseases of DEWS, malaria has been selected as the disease for this case study. Along with GIS, Satellite remote sensing will be used as a complementary tool for identifying environmental factors responsible for enhancing this vector borne disease.
This study was therefore conducted to identify potential sites of malaria breeding vectors to forecast the epidemics of malaria prior to outbreaks.
Objectives
The following components will be analysed to achieve this aim.
| 1. | Estimating population under surveillance, malaria burden and trends at the district level. |
| 2. | Locating FLCFs reporting confirmed malaria cases and identifying environmental and meteorological risk factors for malaria transmission. |
| 3. | Establish epidemiological relations between recorded malaria at FLCFs level and environmental variables relevant to malaria transmission and identifying impact zones of mosquito breeding sites. |
MATERIALS AND METHODS
Site of investigation
The Rawalpinidi District lies between 33°04'-34°01' north latitudes and 72°38' and 73°37' east longitudes. The district comprises six tehsils namely Rawalpindi, Muree, Kotli-Sttian, Kahuta, Gujar Khan and Taxila.
There is a wide variation of climate between various parts of the district. The Muree and Kotli-Sattian tehsils have severe winters and mild summers. While Gujar Khan, Rawalpindi and Taxila have hot summers and moderates winters (1998 District Census Report of Rawalpindi, June 1999).
Punjab is considered a low risk province for malaria (API=0.17) at the national level (Malaria Directorate, 2002). For monitoring the effectiveness of surveillance at the village level it was decided to choose a district, from a low risk province to see if that statement held true for the village level, where the actual outbreak takes place.
Data requirements and data sources
For this retrospective study, three consecutive years 1998, 1999 and 2000 data from reporting FLCFs was collected from the HMIS database on the following parameters.
| Fever (Clinical Malaria) under, 1 to 4 years, 5 years and above |
 |
Data on population size, at the tehsil, union council and village level was take from the 1998 District Census Report of Rawalpindi.
The climate data month wise for the respective three years 1998, 1999 and 2000 was take for the parameters of rainfall, mean maximum temperature, mean minimum temperature and relative humidity from the three ground stations surroundings Rawalpindi.
For observing the surroundings features of the villages Landsat and SPOT, satellite images were used.
Data sorting
After the collection of the required data, the data was sorted on the basis of its unique ID to prevent redundancy in case of Potwar circle; union councils, villages and FLCFs.
Data processing and analysis
Data analysis was carried out in which GIS, provided an excellent means for visualizing and analysing epidemiological data, revealing trends, dependencies and interrelationships that wold be more difficult to discover in tabular formats. Implementing the GIS platform required various data sets, both spatial (map e.g. roads, FLCFs) and attribute (statistical e.g. malaria case data, population), hardware and software.
Most of this research was organised on Arc View 3.1, MS Access, MapINfo Professional and AutoCAD Map. A base map of Rawalpindi was digitised that is rural versus urban.
A maximum of four administrative levels were shown (e.g. Tehsil, Potwar circle, union council, village). Vector layers like HMIS points, road network, drainage and lakes along with the spatial databases were created using AutoCAD map, ArcView 3.1 and Ms Access. The spatial analysis based capabilities of a computer based GIS give this technology an edge which is unmatched by other manual systems.
Buffer zones were generated to determine the catchments area of each facility for calculating the surveillance population.
For estimating disease burden and monitoring disease trends. The following equations were used:
 |
After the respective formula had been applied in order to show the year wise malaria situation MapInfo Professional Grid maps were generated using IDW (Inverse Distance Weighting) interpolation.
To locate the FLCFs that were reporting confirmed cases of malaria, two sets of queries “OR”, “AND” were applied in ArcView.
For establishing an epidemiological relation of malaria with environmental and meteorological factors a checklist containing the risk environmental and climatic factors was developed to look in to the factors that were supportive of malaria at union council level.
To identify the environmental risk factors Landsat and SPOT satellite image was used. NDVE was also generated to find out the vegetation density of the potential sites. Two different images were used, as the two selected FLCFs were not found in the same image. The NDVI image was categorised in to three different classes corresponding to various breeding sites like water, vegetation and dense vegetation.
When the diverse environmental factors around the potential sites were identified potential impact sites at the union council level were generated.
Using Mapinfo Professional Grid maps were generated by the IDW method for temperature, rainfall, relative humidity of the potential sites. This was done for one-month before the transmission season (May) to one month after (October) the transmission season. The climatic variables for the FLCFs were presumed to be that of the surrounding villages.
RESULTS
Calculating population under surveillance
For calculating the population under surveillance it was important to know first of all the number of Institutions reporting.
Every FLCF should be reporting for twelve months of the year. However, there is a considerable gap between the number of reports expected and the number of reports received. Figure 1a and b show the villages falling with in the catchments areas of the FLCF, which were considered as the population under surveillance.
| Table 1: | Number of Institutions Reporting from Rawalpindi District |
 | |
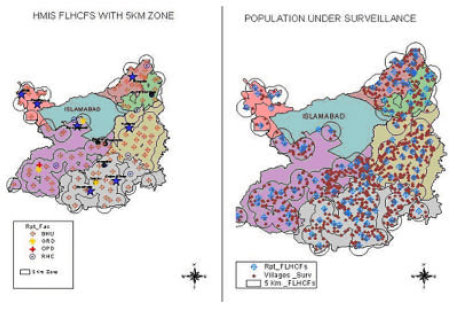 | |
| Fig. 1a and b: | The location of HMIS facilities along with catchments villages |
Observed malaria trends at the district level
On the basis of the surveillance population that was calculated, malaria burden at the district level was assessed using Grid maps generated by the IDW (Inverse Distance Weighting) method. The Rawalpindi tehsil had the highest Slide Positivity Rate (SPR) for the years under study. The API for 1998 was the highest for the Rawalpindi Tehsil. In case of 1999, 2000 the API (Annual Parasite Index) was the highest, for the Muree Tehsil. For the year 1998 the total fevered cases are the highest for the Gujar Khan and Rawalpindi but as the years move on, only Rawalpindi Tehsil seems to be reporting a high number of fevered cases.
The Blood Slide Taken (BST) should be equal to the fever rate in the community as Malaria surveillance assumes that all malaria cases will show a fever. In 1998, the blood slides taken for Gujar Khan were moderate and in 2000 Gujar Khan Tehsil is examining the highest number of blood slides along with kahuta. Tehsil Rawalpindi and Texila are taking the lowest number of slides for three years. With Muree showing a great deal of variation among between high and low examination rate. This comparison gave an over all assessment of the presence of malaria amongst the Tehsils of Rawalpindi district.
Institutes reporting confirmed malaria cases
Analysis of time series data at the union council level allowed those FLCFs to be selected that were reporting confirmed malaria cases for any or all the three years of the case study.
| Table 2: | Malaria positives cases originating from the FLCFs |
 | |
Identification of environmental risk factors
When the FLCFs were selected for confirmed malaria cases then the catchments villages of these health facilities were monitored for the presence or absence of favourable breeding condition for the Anopheles species.
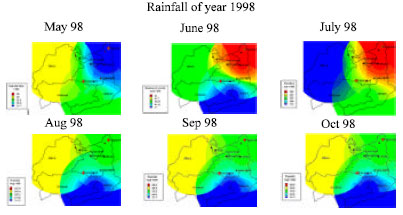 | |
| Fig. 2: | Interpolation used for Generating Climate Variables |
Interpolation allowed the intermediary value to be obtained so that the exact climatological variables of the FLCFs and catchments villages could be determined (Fig. 2).
Similarly for the other climatic parameters for the respective months of the monsoon grids were generated using IDW (Inverse distance Weighting) method.
DISCUSSIONS
For the implementation of any form of surveillance system it is very important to know the population that is being monitored. With out knowing the surveillance population epidemiological trends can’t be analysed accurately.
Table 1 shows the reporting FLCFs, there was only slight variation among the number of reporting institutions from one year to the next. In Table 3, the rural surveillance population of six tehsils of Rawalpindi district is shown amongst which Kotli Sattian was the highest and that of Taxila was the lowest at 19%.
| Table 3: | Showing the population under surveillance of Rawalpindi district |
 | |
The surveillance population calculated in this study also points towards the importance of population data for monitoring as under reporting of the notified cases is likely to represent only a minor portion of the disease that may be in the onset.
Trends in the malaria burden at the district level showed that the Rawalpindi tehsil, is showing high SPR rate, high fevered cases along with least amount of blood slides been examined. These findings point towards the further analysis in to the situation of Rawalpindi tehsil for estimating the malaria burden accurately.
Out of all the FLCFs showing confirmed malaria only two were selected for further analysis as they showed malaria positive case for all the three years. Out of these two facilities one was Ranotra Basic Health Centre (BHU) located in the union council of Raika Maira tehsil, Rawalpindi. While the other was a Phagwari Rural Health Centre (RHC) located in the union council of Phagwari, tehsil Murree. These cases are considered to be originating from the villages with in the catchments areas of these facilities. The BHU of Ranotra served six of the surrounding villages; Phagwari RHC served 3 villages of the vicinity.
Normalised Difference Vegetation Index(NDVI) was also generated for locating the vegetative breeding sites. Values for vegetated land generally ranged from about 0.1 to 0.7 with values greater that 0.5 indicating dense vegetation around the surrounding villages. Fig. 3 shows the location of the two selected union councils, along with the generated Normalised Difference Vegetation Index.
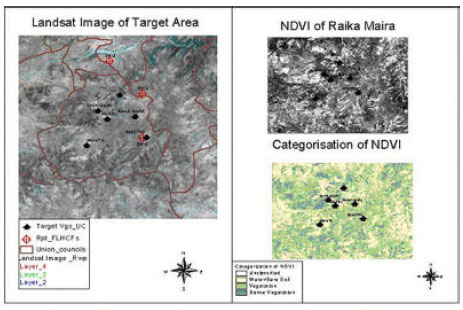 | |
| Fig. 3: | Location of Raika Mira and Phagwari, along with NDVI |
The first phase of this study utilized landscape to explore the relationship between landscape elements and the Anopheles mosquito in the surroundings of the health facility. Landsat/SPOT image was used to identify favourable breeding sites for the mosquitoes. Vegetation growing in a particular area changes with the seasons, responding to rainfall, as do the breeding habits of the mosquito, which causes malaria. Research in Gambia showed vegetation changes were linked to the numbers of malaria cases, and occurred approximately 4-6 weeks previously (Githeko et al., 1996).
The majority of mosquitoes stay within a distance of 1 km of their last blood meal. Environmental factors, such as proximity to water bodies and surrounding vegetation, determined the spatial distribution and density of mosquitoes and affected the distribution of malaria incidence within the villages.
In Raika Maira and Phagwari union council drainage, vegetation and the water vegetation boundary served as ideal breeding habitats for the mosquitoes. In the union council of Raika Maira, out of the six villages three villages Ranotra, Kolian Gohroo and Raika Maira, are lying directly with in the flight range of the mosquitoes. While for the Phagwari union council all the villages fell in the impact zones. Fig. 4 shows the villages of Phagwari and Raika Maira union council that are falling with in the impact zones of the mosquitoes breeding sites.
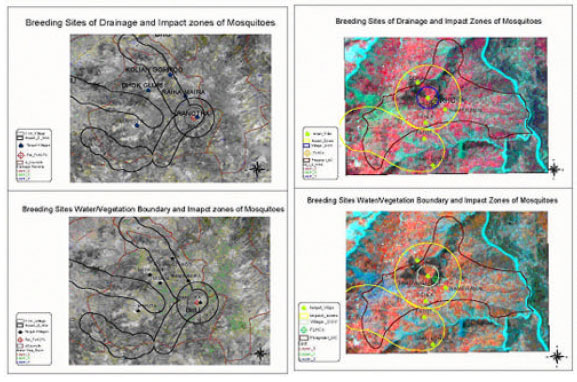 | |
| Fig. 4: | Impact Zones of Raika Maira and Phagwari Union Councils |
Climatological evidence suggests that rainfall; maximum and minimum, temperature and relative humidity are causal aspects in the prevalence of the mosquito vector. Biological evidence supports the observed effects of climate; increased rainfall and higher humidity lead to a higher incidence of mosquitoes, which in turn leads to an increased frequency of malaria. So this data was plotted to study the relationship between climate and malaria transmission.
For the villages of Raika Maira Union council and Phagwari as the climate becomes favourable for the Anopheles there is an increase in the number of total fevered cases along with positive malaria cases. As the maximum temperatures are above 35°C and minimum above 33°C during the monsoon the surroundings become more favourable for mosquitoes. Rainfall plays an important role in the mosquito life cycle, as the majority of a mosquito’s life is spent in aquatic stages.
Temperature effects malaria transmission for two reasons: either the minimum temperature is so low that at 16°C, it prevents parasite and vector development or else the temperature is too high resulting in increased mortality of the vector at 40°C (Lindsay et al., 1996). In a retrospective study in Belize, graph of the malaria incidence data on a month-by-month basis showed that the incidence of malaria increases for some districts during the rainy season (Khaemba et al., 1994).
Due to the periodicity of cycles caused by meteorological factors, if those variables are monitored, there should be a way to predict epidemics based on the risk factors related to epidemics. The spread of malaria requires that conditions are favourable for the survival of both the mosquito and the parasite. Environmental factors like vegetation, drainage, and water bodies present along with favourable climate conditions provide ideal breeding ground for Anopheles culicifacies and Anopheles stephensi.
This study was also used for evaluating the current practices followed by the Malaria Directorate for declaring various areas of Pakistan as risk zones for malaria. Currently the malaria directorate is looking at the malaria situation at the District level. Various district are being declared as high, low and no risk district on the basis of the API.
However, when outbreaks occur they always occur at the village or the institutional level (Health facility). From the villages, the out breaks spread out to the next administrative level. Although Rawalpinidi has been declared as a no risk zone, utilising GIS and Remote Sensing in this study revealed hidden trends among the HMIS data. The time series analysis identified two union councils of Raika Maira and Phagwari, which showed favourable environmental and meteorological conditions for malaria epidemics. So these two spot hot could be potential sites for any future out breaks of malaria if the conditions are conducive.
In this study GIS and RS have been used as tooled for the implementation of DEWS. The major advantages, of GIS are that it can map impact zones of mosquitoes and extract hidden trends using queries. Remote Sensing can detect the indirect parameters of mosquito ecology that helps in thriving of the vector species. Spatial targeting of high risk areas was done with help of GIS. With the help of this research it was proved that RS and GIS could be used as epidemiological tool for the surveillance of vector borne diseases and malaria in particular.
REFERENCES
- Githeko, K., C.M. Nbongo and K. Atieli, 1996. Resting behaviour, ecology and genetics of malaria vectors in large scale agricultural areas of Western Kenya. Parassitologia, 38: 481-489.
PubMedDirect Link - Hu, H., P. Singhasivanon, P. Salazar, K. Thimasarn, X. Li, S. Supaveg and S. Looarecsuwan, 1998. Factors influencing malaria endemicity in Yunnan province, PR China: Analysis of spatial pattern by geographical information system. Southeast Asian J. Trop. Med. Public Health, 29: 189-190.
Direct Link - Khaemba, M., A. Mutani and M.K. Bett, 1994. Studies of Anopheline mosquitoes transmitting malaria in a newly developed highland urban area: A case study of Mobi University and its environs. East Afr. Med. J., 71: 159-164.
Direct Link - Lindsay, W. and M.H. Birley, 1996. Climate change and malaria transmission. Ann. Trop. Med. Parasitol, 90: 573-588.
Direct Link - McMichael, J., A. Haines, R. Sloof and S. Kovats, 1996. Climate Change and Human Health. World Health Organization, Geneva, Switzerland, Pages: 297.
Direct Link - Nualchawee, K., P. Singhasivanon, K. Thimasarn, D. Dowreang, R. Sithiprasasna and D. Rajbhandari, 2001. Integration of remote sensing and GIS techniques to study the relationship between vector borne disease and vegetation cover: A case of malaria Chanthaburi province of Thailand. Acta Trop., 79: 7-12.
- Sharma, P. and A. Srivastava, 1997. Role of geographic information system in malaria control. Indian J. Med. Res., 106: 198-204.
Direct Link