
Mohd. Kamaruddin Abd. Hamid
Process Systems Engineering Centre, Faculty of Chemical Engineering, Universiti Teknologi Malaysia, 81310 UTM Johor Bahru, Johor, Malaysia
Journal of Applied Sciences
Year: 2014 | Volume: 14 | Issue: 12 | Page No.: 1277-1282


ABSTRACT
This study describes in details the development of a new sustainable integrated process design and control methodology for chemical processes. Previously, Integrated Process Design and Control (IPDC) methodology was developed which is able to identify and obtain an optimal solution for the IPDC problem for chemical processes in an easy, simple and efficient way. However, the developed methodology for the IPDC did not consider sustainability aspect. Designing controllable and also sustainable process is one of the key challenges for sustainable development of chemical processes. Chemical process design can be further improved by including sustainability aspect within the developed IPDC method to ensure that the design is more cost efficient and controllable, as well as sustainable to meet product quality specifications. This can be achieved by extending the developed model-based IPDC method encompasses sustainability aspect, which is called sustainable IPDC (Sustain IPDC). Here, the Sustain IPDC problem for chemical processes, typically formulated as a mathematical programming (optimization with constraints) problem is solved by decomposing it into six sequential hierarchical sub-problems: (1) Pre-analysis, (2) Design analysis, (3) Controller design analysis, (4) Sustainability analysis, (5) Detail economics analysis and (6) Final selection and verification. It should be noted that sub-problems (4) dan (5) are the new sub-problems added to the previous developed methodology to embark on the sustainability analysis.
PDF Abstract XML References Citation
Received: April 05, 2013;
Accepted: April 08, 2013;
Published: April 11, 2014
How to cite this article
Mohd. Kamaruddin Abd. Hamid, 2014. Development of a Sustainable Integrated Process Design and Control for Chemical Processes. Journal of Applied Sciences, 14: 1277-1282.
DOI: 10.3923/jas.2014.1277.1282
URL: https://scialert.net/abstract/?doi=jas.2014.1277.1282
DOI: 10.3923/jas.2014.1277.1282
URL: https://scialert.net/abstract/?doi=jas.2014.1277.1282
INTRODUCTION
Integrated Process Design and Control (IPDC) methodology was developed which is able to identify and obtain an optimal solution for the IPDC problem for chemical processes in an easy, simple and efficient way (Hamid, 2011; Hamid et al., 2010). However, the developed methodology for the IPDC did not consider sustainability aspect in the early chemical processes design stage. Designing controllable and also sustainable process is one of the key challenges for sustainable development of chemical processes. Chemical process design can be further improved by including sustainability aspect within the developed IPDC method to ensure that the design is more cost efficient and controllable, as well as sustainable to meet product quality specifications. This can be achieved by extending the developed model-based IPDC method encompasses sustainability aspect.
As we know, sustainability is based on balancing three principal objectives: environmental protection, economic growth and societal equity (Fig. 1). Metrics and indicators are used to assess the sustainability performance of a process or a system, to evaluate the progress toward enhancing sustainability and to assist decision makers in evaluating alternatives.
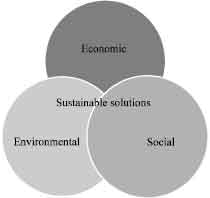 | |
| Fig. 1: | Three primary dimensions of sustainability |
The sustainability analysis used this work is based on the two-dimensional metrics, which are based on the simultaneously assessment of two out of the three sustainability dimensions. This includes economic-environmental, socio-economic and socio-environmental indicators (Uhlman and Saling, 2010; Tanzil and Beloff, 2006).
The objective of this study is to describe in details the development of a sustainable IPDC (Sustain IPDC) for chemical processes, paying attention to encompass sustainability aspect to the current developed IPDC methodology. In the next section, the general formulation of a SustainIPDC is presented followed by the details description of a model-based methodology which is based on the decomposition approach for solving a Sustain IPDC problem. After that, the important concepts used for obtaining the optimal sustainable design-control solution is presented followed by conclusions and future work.
PROBLEM FORMULATION
The Sustain IPDC is typically generated as a generic optimization problem in which a performance objective in terms of design, controllability, sustainability and economic criteria is optimized subject to a sets of constraints such as process (dynamic and steady state), constitutive (thermodynamics state) and conditional (process, control and sustainability specifications) constraints:
| (1) |
subjected to:
Process (dynamic and/or steady state) constraints:
| (2) |
Constitutive (thermodynamic) constraints:
| (3) |
Conditional (process, control and sustainability) constraints:
| (4) |
| (5) |
| (6) |
In the above equations, x and y are usually regarded as the set of process variables in the process design and as the set of state and/or controlled variables in the controller design; usually temperatures, pressures and compositions. u is the set of design variables (for process design) and/or the set of manipulated variables (for controller design). d is the set of disturbance variables, θ is the set of constitutive variables (physical properties, reaction rates), v is the set of chemical system variables (molecular structure, reaction stoichiometry, etc.) and t is the independent variable (usually time).
The performance function, Eq. 1 includes design, controllability, sustainability and economic criteria, where i indicates a specific term of each category. wi,j is the weight factor assigned to each objective term Pi,j. Equation 2 represents generic process model from which the steady state model is obtained by setting dx/dt = 0. Equation 3 represents constitutive equations which relate the constitutive variables to the process. Equation 4 and 5 represent sets of equality and inequality constraints (such as product purity, chemical ratio in a specific stream) that must be satisfied for feasible operation-they can be linear or non-linear. In Eq. 6, Y is the set of binary decision variables for the controller structure selection (corresponds to whether a controlled variable is paired with a particular manipulated variable or not).
Different optimization scenarios can be generated as follows:
| • | To achieve process design objectives, P1,j is maximized. P1,1 is the performance criterion for reactor design and P1,2 is the performance criterion for separator design |
| • | To achieve controller design objectives, P2,1 is minimized by minimizing (dy/dd) the sensitivity of controlled variables y with respect to disturbances d and P2,2 is maximized by maximizing (dy/du) the sensitivity of the controlled variables y with respect to manipulated variables u for the best controller structure |
| • | To achieve sustainability objective, P3,1 is minimized. Here, P3,1 is minimized by minimizing the mass, water and energy intensity indices |
| • | To achieve economic objective, P4,1 is maximized by maximizing the net profit function |
The multi-objective function in Eq. 1 is then reformulated as:
| (7) |
DECOMPOSITION-BASED SOLUTION STRATEGY
In most of the optimization problems, the feasible solutions to the problems may lie in a relatively small portion of the search space due to the large number of constraints involved.
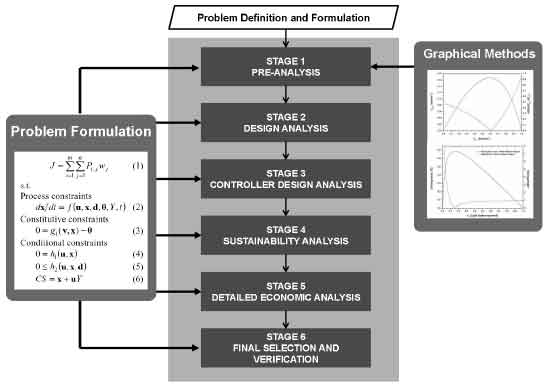 | |
| Fig. 2: | Decomposition-based solution strategy for SustainIPDC problems (adapted from Hamid, 2012) |
The ability to solve such problems depends on the effectiveness of the method of solution in identifying and locating the feasible solutions (one of these is the optimal solution). Hence, one approach to solve this optimization problem is to apply a decomposition method as illustrated in Fig. 2 (Hamid, 2012).
The decomposition approach has been applied to manage and resolve the complexities associated with different optimization problems in chemical engineering, such as, IPDC (Hamid, 2011; Hamid et al., 2010). Accordingly the SustainIPDC problem is decomposed into six hierarchical stages: (1) Pre-analysis; (2) Design analysis; (3) Controller design analysis; (4) Sustainability analysis; (5) Detailed economic analysis; and (6) Final selection and verification. As shown in Fig. 2, the sets of constraint in the Sustain IPDC problem is decomposed into six sub-problems which corresponds into six hierarchical stages. In this way, the solution of the decomposed set of sub-problem is equivalent to that of the original problem. As each sub-problems being solved, a large number of infeasible solutions within the search space is identified and hence eliminated, thereby leading to a final sub-problem that is significantly smaller, which can be solved more easily. Therefore, while the sub-problem complexity may increase with every subsequence stage, the number of feasible solutions is reduced at every stage. In the pre-analysis sub-problem, the concepts of Attainable Region (AR) (Glasser et al., 1987, Hildebrandt et al., 1990; Godorr et al., 1994) and Driving Force (DF) (Gani and Bek-Pedersen, 2000; Bek-Pedersen, 2002; Bek-Pedersen and Gani, 2004) are used to locate the optimal design-control-sustainability solution targets, which are defined at the maximum point of the AR and DF diagrams.
Stage 1
Pre analysis: The objective of this stage is to define the operational window and set the targets for the design-controller solution. First, all y and u are analyzed and the important ones with respect to the multi-objective function, Eq. (7) are shortlisted. The operational window is defined in terms of y and u (note that d is known). A choice is made for y based on thermodynamic and process insights and Eq. (3) (also defines the optimal solution targets). Then, Eq. (4) and (5) are solved (for u) to establish the operational window. For each reactor design task, the attainable region diagram is drawn and the location of the maximum in the attainable region is selected as the reactor design target (Fig. 3a). This point gives the highest selectivity of the reaction product with respect to the limiting and/or selected reactant. Similarly, for each separation design task, the design target is selected at the highest driving force (Fig. 3b). At the highest driving force, the separation becomes easiest due to the large difference in composition between the phases and therefore, the energy necessary to maintain the two-phase is at a minimum.
 | |
| Fig. 3(a-b): | Determination of optimal solution of design-control for a rector using the (a) Attainable region diagram at a specific temperature and (b) A separator using the driving force diagram at a specific pressure (Hamid et al., 2010) |
Note that, both plots of attainable region and driving force usually have a well-defined maximum (Fig. 3). It is important to note that, from a process design point of view at these targets, the optimal design objectives (maximum value of P1,1 and P1,2) can be obtained. From a controller design point of view, at these targets the controllability of the process is best satisfied.
Stage 2
Design analysis: The search space within the operational window identified in Stage 1 is further reduced in this stage. The objective is to validate the targets defined in Stage 1 by finding acceptable values (candidates) of y and u by considering Eq. (2)-steady state process model. If the acceptable values cannot be found or the solution is located outside the operational window, then a new target is selected and the procedure is repeated until a suitable match is found.
Stage 3
Controller design analysis: The search space is further reduced by considering now the feasibility of the process control. This sub-problem considers the process model constraints, Eq. (2) (dynamic and/or steady state forms) to evaluate the controllability performance of feasible candidates and Eq. (6) for the selection of the controller structure. In this respect, two criteria are analyzed: (a) sensitivity (dy/dd) of controlled variable y with respect to disturbances d, which should be low and (b) sensitivity (dy/du) of controlled variables y with respect to manipulated variables u, which should be high. Lower value of dy/dd means the process has lower sensitivity with respect to disturbances, hence the process is more robust in maintaining its controlled variables against disturbances. On the other hand, higher value of dy/du will determine the best pair of the controlled-manipulated variables (to satisfy Eq. (6). According to the integrated design problem, the optimal design-process values become the set-points for the controlled and manipulated variables. Therefore, it is assumed by this methodology that the best set-point values of the controller are actually those already defined as design targets (at the maximum point of the attainable region diagram, for reactor and the driving force diagram, for separator), since these targets are the optimal design solutions. It should be noted that the objective of this stage is not to find the optimal value of controller parameters or type of controller, but to generate the feasible controller structures.
Stage 4
Sustainability analysis: In Stage 4, the objective is to analyze the sustainability criteria in which to minimize both the use of natural resources and its impacts on the environment while producing better systems. Sustainability is based on balancing three principal objectives: environmental protection, economic growth and societal equity (Fig. 1). Metrics and indicators are used to assess the sustainability performance of a process or a system, to evaluate the progress toward enhancing sustainability and to assist decision makers in evaluating alternatives. The sustainability analysis used in this work is based on the two-dimensional metrics, which are based on the simultaneously assessment of two out of the three sustainability dimensions. This includes economic-environmental, socio-economic and socio-environmental indicators (Uhlman and Saling, 2010).
These three indicators are measured by using mass, water and energy intensity index. Therefore, the sustainability objective, P3 is defined by:
| (8) |
where, Mindex is the Mass intensity index, Windex is the Water intensity index and Eindex is the Energy intensity index.
If the value of P3 is below than zero, it gives a positive effect towards the sustainability. While, if the value is higher zero, it means negative effects of the process is released. As a conclusion, the less value of P3, the larger the friendliness of the process contribution to the systems.
Stage 5
Detail economic analysis: The objective of this stage is to maximize the profit and to minimize the total cost. The profit function can be calculated as shown in Eq. (9) and the total cost by Eq. (10) below:
| (9) |
| (10) |
Stage 6
Final selection and verification The final stage is to select the best candidates by analyzing the value of the multi-objective function, Eq. (7). The best candidate in terms of the multi-objective function will be verified using rigorous simulations or by performing experiments. It should be noted that the rigorous simulation will be relatively easy because very good estimates of y and u are obtained from Stages 1 to 5. For controller performance, verification is made through open or closed loop simulations. For closed loop simulation, any tuning methods can be used to determine the value of controller parameters.
DEFINING OPTIMAL DESIGN TARGET
Hence, two important concepts for finding the optimal solutions from process design, process control and sustainability viewpoints are presented which are relatively straight forward to apply and which, in our opinion, have an important role in solving the Sustain IPDC problem. The concepts of AR and DF are used in order to obtain the optimal design solutions. In Stage 1 of this methodology, targets for the design-control-sustainable solution are defined at the maximum point of the AR and DF diagrams. Defining the targets at the maximum point of the AR and DF diagrams ensure the optimal solution not only for the process design and control but also for the sustainable design. From a process design point of view at these targets, the optimal design objectives (maximum value of P1,1 and P1,2) are obtained (Fig. 3). Then by using the reverse solution approach, values of design-process variables that match those targets are calculated in Stage 2. Using model analysis, controllability issues are incorporated in Stage 3 to calculate the process sensitivity and to pair the identified manipulated variables with the corresponding controlled variables. From a controller design point of view, at targets defined in Stage 1, the process sensitivity with respect to disturbances (P2,1) is at the minimum and the sensitivity of controlled variables with respect to manipulated variables (P2,2) is at the maximum (Fig. 3).
Then, the controllable candidates are further reduced to satisfy the sustainability and economics constraints (sustainable candidates) in Stages 4 and 5, respectively until in the final stage all sustainable candidates are ordered according to the defined performance criteria (objective function). Since the optimization deals with multi-criteria objective functions, therefore, in Stage 5, the objective function is calculated to verify the best (optimal) solution that satisfies design, control, sustainability and economic criteria. From an optimization point of view, solution targets at the maximum point of the attainable region and driving force diagrams should have the higher value of the objective function compared to design/operation at any other point.
CONCLUSION AND FUTURE WORK
In this study, a systematic model-based methodology has been developed for sustainable integrated process design and control (SustainIPDC) for chemical processes. Here, the SustainIPDC problem for chemical processes is solved by decomposing it into six sequential hierarchical sub-problems: (1) Pre-analysis, (2) Design analysis, (3) Controller design analysis, (4) Sustainability analysis, (5) Detail economics analysis and (6) Final selection and verification. It should be noted that sub-problems (4) Dan (5) are the new sub-problems added to the previous developed methodology to undertake the sustainability analysis. For future work, the capability of the proposed methodology in solving Sustain IPDC problems will be tested using a single reactor system and a single separator system. It will be expected that the proposed methodology will able to find the best solution which satisfied design, control, sustainability and economic criteria in easy, efficient and systematic manner.
ACKNOWLEDGMENT
Financial supports from Universiti Teknologi Malaysia (UTM), Research University Grant Scheme (RUGS Q.J130000.2644.06J30 and R.J130000.7744.4P051) are highly acknowledged.
REFERENCES
- Bek-Pedersen, E. and R. Gani, 2004. Design and synthesis of distillation systems using a driving-force-based approach. Chem. Eng. Process.: Process Intensif., 43: 251-262.
CrossRef - Gani, R. and E. Bek-Pedersen, 2000. Simple new algorithm for distillation column design. AIChE J., 46: 1271-1274.
CrossRef - Glasser, D., C. Crowe and D. Hildebrandt, 1987. A geometric approach to steady flow reactors: The attainable region and optimization in concentration space. Ind. Eng. Chem. Res., 26: 1803-1810.
CrossRef - Hildebrandt, D., D. Glasser and C.M. Crowe, 1990. Geometry of the attainable region generated by reaction and mixing: With and without constraints. Ind. Eng. Chem. Res., 29: 49-58.
CrossRef - Godorr, S.A., D. Hildebrandt and D. Glasser, 1994. The attainable region for systems with mixing and multiple-rate processes: Finding optimal reactor structures. Chem. Eng. J. Biochem. Eng. J., 54: 175-186.
CrossRef - Hamid, M.K.A., 2012. Development of a sustainable integrated process design and control for chemical processes. Proceedings of the 26th Symposium of Malaysian Chemical Engineers with the 4th International Conference on Chemical and Bioprocess Engineering, November 21-23, 2012, Sabah, Malaysia, pp: 629-634.
- Hamid, M.K.A., G. Sin and R. Gani, 2010. Integration of process design and controller design for chemical processes using model-based methodology. Comput. Chem. Eng., 34: 683-699.
CrossRef - Tanzil, D. and B.R. Beloff, 2006. Assessing impacts: Overview on sustainability indicators and metrics. Environ. Qual. Manage., 15: 41-56.
CrossRef