
M.R. Askari
Islamic Azad University, Sarvestan Branch, Fars, Iran
Journal of Applied Sciences
Year: 2010 | Volume: 10 | Issue: 6 | Page No.: 471-478


ABSTRACT
Induction motors, especially squirrel cage motors, have an important role in industry. Their rotor or stator may be failed under stresses depending on their application and sometimes an unexpected motor failure in a manufacture production process may result in unexpected and unforeseen tripping. So, if the failure can be detected during its operation, there are some methods to prevent failure spread and also manufacture trip. This study aimed to model and simulate the squirrel cage induction motor at any operation condition such as healthy condition and broken bars failures in side of rotor, in order to achieve an algorithm for failure detection. So, in this study a new method base on Wavelet theory is used for failure detection. Finally, simulation and experimental results are compared. The results show that using wavelet transform can effectively be used to diagnose the broken bars in the motor.
PDF Abstract XML References Citation
How to cite this article
M.R. Askari, 2010. Broken Bars Detection in Squirrel Cage Induction Motors Using Wavelet Theory. Journal of Applied Sciences, 10: 471-478.
DOI: 10.3923/jas.2010.471.478
URL: https://scialert.net/abstract/?doi=jas.2010.471.478
DOI: 10.3923/jas.2010.471.478
URL: https://scialert.net/abstract/?doi=jas.2010.471.478
INTRODUCTION
Since, induction motors present numerous advantages due to their robustness and their power to weight ratio, they are widely used in the industry. Therefore, there is a considerable demand to reduce maintenance costs and prevent unscheduled downtimes for electrical drive systems, especially ac induction machine. In the past two decades, there have been many investigations on condition monitoring and fault diagnostics in electric machines, especially squirrel-cage induction motors (Haji and Toliyat, 2001; Kliman et al., 1996; Kohler et al., 1992; Tallam et al., 2003).
Sudden machine failure is very damaging or catastrophic in applications such as large industrial systems or central station power plant auxiliaries in which the electric machine is the prime mover. These machine failures reduce productivity in industrial and power systems. Maintenance schedules can proactively be implemented to reduce or prevent these failures although the probability of a sudden machine failure cannot be entirely ruled out. On the other hand, increasing the frequency of scheduled maintenance increases the cost and decreases the productivity of a system. Accordingly, an online fault diagnostic system becomes a valuable tool to increase the system efficiency and reliability (Tallam et al., 2003; Bellini et al., 2001; Elkasabgy et al., 1992).
Numerous diagnostic techniques for induction motors have been reported in the literature to diagnose electric machine faults, such as stator winding inter-turn shorts, broken rotor bars, broken end-ring connectors and bearing faults. These diagnostic techniques include computation of the negative sequence components of motor terminal quantities (Kliman et al., 1996; Kohler et al., 1992; Tallam et al., 2003) detection of the frequency spectrum sideband components (Bellini et al., 2001; Elkasabgy et al., 1992), motor parameter estimation methods (Vas, 1993; Said et al., 2000) Artificial Intelligence (AI) based statistical machine learning approach (Yeh et al., 2004; Povinelli et al., 2002), artificial neural networks (Filippetti et al., 1998; Murray and Penman, 1997; Bernieri et al., 1996) as well as the recently proposed motor magnetic field pendulous oscillation phenomenon (Mirafzal and Demerdash, 2003, 2005, 2006).
Wavelet analysis was introduced to overcome the shortcomings of Fourier analysis. In Fourier analysis the basis functions are complex exponentials producing the same results for a particular waveform being analyzed. However in wavelet analysis the basis function could be any permissible wavelet and the results produced are unique to the selected wavelet. Some wavelets are more efficient at encoding, de-noising, compressing, decomposing and reconstructing signals than others. It is therefore desirable to select a wavelet that produces the best results for the signal being analyzed (Halbaoui et al., 2009; Lasaad et al., 2007; Sarhan and Issa, 2006).
In this study, discrete wavelet transform has been used for detecting the broken bars in the induction motors.
Wavelet theory application in signal analysis: The wavelet expression is applied to a family of functions, produced from translation and dilation of a function, called mother wavelet (Chik et al., 2009; Sanchez-Lopez et al., 2003). Like the Fourier analysis, Wavelet analysis also extends the functions according to a set of basic functions. Against the Fourier analysis, the Wavelet analysis doesn't extend the functions as the trigonometric or polynomial functions, but according to the wavelets that themselves have created by delaying and transmission of a mother wavelet. Wavelets have the specific scaling properties. They convert a signal to the arbitrary signals with different scales and different levels of resolution using the scaling and transmission properties. They offer a presentation of signal at both time and frequency domain, so the Wavelets analysis is preferable, from this aspect, compare with the Fourier analysis and efficiently is used in many different fields such as: astronomy, Acoustic, nuclear engineering, signal and image processing, neurophysiology, music, magnetic resonances, xerography, speech distinction, earthquake predication, radar, Optic and the applications of pure math.
Recently, this theory is appeared as an important mathematical model in electrical engineering community. This theory has a special application in concentration and time locating of transient phenomenon in power electrical engineering. The next advantage of this conversion is having different resolutions in different scales so that for high frequency phenomenon, the frequency resolution increases and the time resolution decreases and vise versa for low frequency phenomenon. So, the difference of this analysis with others from the resolution and accuracy aspect (that its definition will be presented more obviously) is shown in Fig. 1a-d.
Wavelet conversion is resulted from passing the signal through two low and high-pass filters. The low-pass filter output is called as signal approximation that contains most of the main and low frequencies, also the high-pass filter output is called as signal details and contains the transient phenomenon and sharp signals.
 | |
| Fig. 1: | Comparison of the resolutions in different analysis. (a) Time domain (Shannon), (b) Frequency domain (Fourier), (c) STFT (Gabor) and (d) Wavelet analysis |
Figure 2 shows the chart of signal dividing into these two components.
The operation of down sampling, shown in Fig. 3, is used to limit the number of samples.
This decomposition of signal can be continued to more levels as shown in the chart of Fig. 4.
The application of Wavelets theory for broken bars detection: If the mother Wavelet and scaling functions are orthonormal basis, then the theorem of Parseval proves that the energy of disturbed signal depends on expansion coefficients and itself coefficients of the Wavelets. On the other hand, if the basis functions are orthonormal, then:
| (1) |
where, the values of C in continues mode are as follow:
| (2) |
where, the function Ψ(w) is the Fourier conversion of the function ψ(t), described at the previous part. Then the inequality Eq. 2 will be a logical relation. Thus, the coefficients of the wavelet conversion will be defined as inner production of the wavelet ψa,b(t) and the signal x(t) for the given values a and b is as follow:
| (3) |
According to the Eq. 1 and 2, the energy of disturbed signal is divided depending on disturbance type in the various levels or scales. Here, for a signal the standard deviation with average of zero can represent its energy.
 | |
| Fig. 2: | Method of dividing the signal into approximation and various components |
 | |
| Fig. 3: | Sampling down operation |
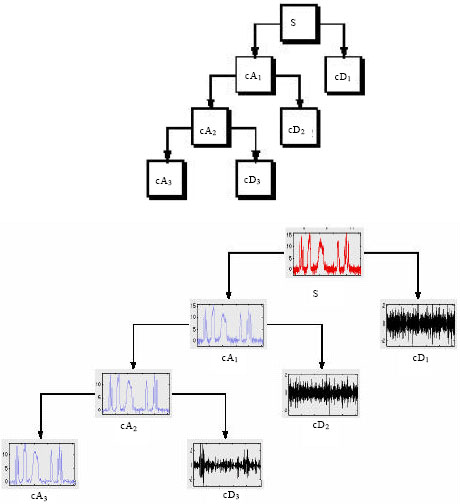 | |
| Fig. 4: | Diagram of Wavelet conversion using multilevel decomposition |
So, in this method the standard deviation for the components of decomposed signal in various levels is used as an index to classify various power quality disturbances.
Since, the input signal is discrete in most applications, so the discrete from of previous relation is used as follow:
| (4) |
where, N is the number of samples.
The resultant coefficients from upper relation will be an imaginary number. Here for optimum using of this coefficients the absolute value of them is used as follow:
| (5) |
These coefficients may be written as a matrix as follow:
 | (6) |
where, the arrays of matrix A have the following properties:
| • | For a constant value of j = u, the value of Cui represents the frequency response of input signal at a given time |
| • | For a constant value of I = v the value of Cjv represents the relative level of a special frequency during one period |
| • | Therefore, any column of matrix A, Ai(i = 1,Y,n) is a filtered level of the main signal |
The proposed method in this study is based on using the energy of signals, resulted from wavelet converting of stator current signal to various levels, which corresponds with summation of square coefficients in the various levels of filtered signal. 4th order Daubechies Wavelet is used to decompose the main signal to the various levels. The signal is divided to 12 levels using this wavelet and then the energy of these levels is applied as a criterion to detect the fault. Figure 5a-l show the decomposition of stator current signal to 12 levels for the condition of four broken bars. Figure 5a shows the motor current signal for the condition of four broken bars and the Fig. 5b-l are low and high frequency levels of under investigation signal, so that, the summation of these signals is equal to the main signal.
The Fig. 5k contains the main component and adjacent components such as fb = (1"2s) f frequency, the latent energy in these levels are used for detecting of motor broken bars.
Simulation and experimental results: First the healthy motor is simulated using winding function as described in (Bellini et al., 2001) in MATLAB. Then the motor is simulated by using this method and writing the equations for the condition of 1, 2, 3 and 4 broken bars. The first set of motors, used for simulation and experimentation, are 3 hp squirrel cage induction motor with the specification of 380 volt, 50 Hz, four pole and three phases with Y-connection, made in Tabriz Motozhen Company in Iran. The second set of motors are 3 hp squirrel cage induction motor with the specification of 220 volt, 60 Hz, four pole and three phases with Y-connection, made in General Electric Company. The electrical and mechanical specifications of these two set of motors are available in appendix. The experimental results are obtained using a digital 4-channel oscilloscope with the ability of connecting to the computer.
Figure 6a-h show the frequency spectrum for the current of stator phase a, for five different states (healthy, 1 to 3 broken bars). As shown in Fig. 6, the increase in number of broken bars results in increase of the adjacent harmonics amplitude. Figure 6a shows the stator current spectrum for both the experimentation and simulation of the healthy motor. The sensible difference between the simulation and experimental results is significantly due to some non-symmetrical properties in motor structure, such as non-axially property, imperfect injection of Aluminum to the rotor slots and etc. As shown in Fig. 6, the rotor bars breaking will change the magnitude of harmonics of stator current. It is also obvious that in healthy motor, the adjacent components (1±2s)f are appeared in two sides of the main component because the under investigation motor was a cast aluminum motor, in this type of motors the injection of aluminum to the rotor core is done at high pressure and temperature and therefore it is probable that some bubbles of air or other gases create in rotor cage, which result in increment of the local resistance of some bars or aluminum penetration in the rotor core.
Figure 6 shows the comparison of frequency spectrums, resulted from the computer simulation and experimental measurements of motor, for the conditions of 1, 2 and 3 broken bars and the healthy motor. It is obvious that, the magnitude of the components (1±2s)f are increased by increment of nonsymmetrical condition in rotor from the healthy state to the state of 3 broken bars and also the other components which are near the main component, are changed.
 | |
| Fig. 5: | (a-l) Stator current signal and its 11 levels of 12 resulted levels by filtering |
According to Fig. 6, since, the signal variations in side bands have a low sensitivity, so the fault detection is difficult using frequency spectrum analysis. Therefore the method of signal analysis is used in Wavelet conversion to detect rotor broken bars.
As already mentioned, using the latent energy in different frequency bands is a suitable method to detect the disturbances in a signal. By using this method at first, the latent energy of signal and then the summation of squared coefficients in the levels 1 to 12 are calculated for the condition of 1, 2, 3 broken bars and healthy motor. Figure 7a-c show the changes of this latent energy for different levels. Since breaking the bars will affect more on adjacent harmonics of main parameter, it caused the increase in these components as the figure shows. Also, the graphs illustrated that the level 6 which indicates the latent energy of this frequency band, can be a suitable criterion to detect the number of broken bars. The experimental results of 3 hp Motozhen and general electric motors are also shown in Fig. 7. As shown in Fig. 7, increase in the number of broken bars in both experiments have the same result in increasing the energy of components which are in adjacent of the main frequency and it is in accordance with simulation results. Table 1 shows the values of stored energy at any decomposed level in experiments and simulation results.
 | |
| Fig. 6: | The changes of stator current spectrum for healthy and 1 to 3 broken bars motor. (a) Healthy motor (experimentation), (b) healthy motor (simulation), (c) one broken bar (experimentation), (d) one broken bar (simulation), (e) two broken bars (simulation), (f) two broken bars (experimentation), (g) three broken bars (simulation) and (h) three broken bars (experimentation) |
| Table 1: | The values of stored energy at any decomposed level (practical and simulation results) |
 | |
 | |
| Fig. 7: | Latent energy changes in various levels of decomposed signals. (a) Simulation, (b) experimentation (Motozhen motor) and (c) general electric motor |
CONCLUSIONS
In this study, a new method based on the use of wavelet theory for detection of broken bars in induction motors is presented. The results of computer simulation and laboratory measurements indicate that the wavelet analysis method is very effective and reliable diagnosis method for this aim. With this method the failure can be detected during motor operation and prevent failure spread and also manufacture trip.
APPENDIX
Motor parameters |
 |
REFERENCES
- Bernieri, A., G. Betta and C. Liguori, 1996. On-line fault detection and diagnosis obtained by implementing neural algorithms on a digital signal processor. IEEE Trans. Instrument Measurement, 45: 894-899.
CrossRef - Chik, Z., T. Islam, M.M. Mustafa, H. Sanusi, S.A. Rosyidi and M.R. Taha, 2009. Surface wave analysis using morlet wavelet in geotechnical investigations. J. Applied Sci., 9: 3491-3501.
CrossRefDirect Link - Elkasabgy, N.M., A.R. Eastham and G.E. Dawson, 1992. Detection of broken bars in the cage rotor on an induction machine. IEEE Trans. Industry Appl., 28: 165-171.
CrossRef - Filippetti, F., G. Franceschini, C. Tassoni and P. Vas, 1998. AI techniques in induction machines diagnosis including the speed ripple effect. IEEE Trans. Industry Appl., 34: 98-108.
CrossRef - Haji, M. and H.A. Toliyat, 2001. Pattern recognition: A technique for induction machines rotor broken bar detection. IEEE Trans. Energy Conversion, 16: 312-317.
CrossRef - Halbaoui, K., D. Boukhetala and F. Boudjema, 2009. Speed control of induction motor drives using a new robust hybrid model reference adaptive controller. J. Applied Sci., 9: 2753-2761.
CrossRefDirect Link - Kohler, J.L., J. Sottile and F.C. Trutt, 1992. Alternatives for assessing the electrical integrity of induction motors. IEEE Trans. Industry Appl., 28: 1109-1117.
CrossRef - Lasaad, S., Z. Dalila and A.M. Naceurq, 2007. Adaptative variable structure control for an online tuning direct vector controlled induction motor drives. J. Applied Sci., 7: 3177-3186.
CrossRefDirect Link - Mirafzal, B. and N.A.O. Demerdash, 2005. Effects of load magnitude on diagnosing broken bar faults in induction motors using the pendulous oscillation of the rotor magnetic field orientation. IEEE Tran. Industry Appl., 41: 771-783.
Direct Link - Mirafzal, B. and N.A.O. Demerdash, 2006. On innovative methods of induction motor inter-turn and broken-bar fault diagnostics. IEEE Trans. Industry Appl., 42: 405-414.
CrossRef - Murray, A. and J. Penman, 1997. Extracting useful higher order features for condition monitoring using artificial neural networks. IEEE Trans. Signal Process., 45: 2821-2828.
CrossRef - Povinelli, R.J., J.F. Bangura, N.A.O. Demerdash and R.H. Brown, 2002. Diagnostics of bar and end-ring connector breakage faults in polyphase induction motors through a novel dual track of time-series data mining and time-stepping coupled FE-state space modeling. IEEE Trans. Energy Conversion, 17: 39-46.
CrossRef - Said, M.S., M.E. Benbouzid and A. Benchaib, 2000. Detection of broken bars in induction motors using an extended Kalman filter for rotor resistance sensorless estimation. IEEE Trans. Energy Conversion, 15: 66-70.
Direct Link - Sarhan, H. and R. Issa, 2006. Improving mechanical characteristics of inverter-induction motor drive system. Am. J. Applied Sci., 3: 1961-1966.
CrossRefDirect Link - Tallam, R.M., T.G. Habetler and R.G. Harley, 2003. Stator winding turn-fault detection for closed-loop induction motor drives. IEEE Trans. Industry Appl., 39: 720-724.
CrossRef - Yeh, C.C., R.J. Povinelli, B. Mirafzal and N.A.O. Demerdash, 2004. Diagnosis of stator winding inter-turn shorts in induction motors fed by PWM-Inverter drive systems using a time-series data mining technique. Proceedings of IEEE International Conference on Power System Technology, Nov. 21-24, Singapore, pp: 891-896.
- Bellini, A., F. Filippetti, G. Francsehini, C. Tassoni and G.B Kliman, 2001. Quantitative evaluation of induction motro broken bars by means of electrical signature analysis. IEEE Trans. Ind. Applied, 37: 1248-1255.
CrossRef