
M. Dababneh
Department of Electronics and Communications, Faculty of Engineermg, Alisra University, Amman, Jordan
Journal of Applied Sciences
Year: 2005 | Volume: 5 | Issue: 3 | Page No.: 597-603


ABSTRACT
Mobile system engineering encompasses the art and science of defining the best placement of transmitters to provide acceptable signal quality over a wide coverage area, (since mobile operators often cannot erect their antennas at precisely the optimum site), indicating that there is potential for further research. Mobile radio communications environment is rather a hostile environment which is subjected to continuous changes in its parameters that affect the signaling path. Hence multipath fading and its effect is noticed in the form of delay spread. Delay spread is a commonly used practical measure of the extent of time dispersion introduced by multipath channels. Delay spread measurements provide a quantitative evaluation of multipath fading. A novel technique for the estimation of delay spread has been designed and implemented. The analytical study clearly shows how delay spread fluctuations affect the mobile radio coverage area; however they are not directly proportional. It is found that delay spread is directly proportional to the minimum symbol length that can be used to avoid excessive intersymbol interference (ISI). The new GSM band 1800-1900 MHZ is considered in the measurements phase. And it is noticed that for an open area of microcell size (150x150 m) the upper delay spread limit is 180 nsec for the GSM band. Also, it is found out that in open areas where the normalised delay spread exceeds 10%, the average BER obtained is worse than 10-3. This gives rise to problems such as ISI and consequently degrades the signal quality below the required C/I of 9 dB, hence transmission problems that eventually limits the mobile radio coverage. Therefore, the existing cellular network is not fit for the emerging mobile technologies (UMTS) due to the deployment of high transmission rates.
PDF Abstract XML References Citation
How to cite this article
M. Dababneh, 2005. Mobile Environment Coverage Issues and Delay Spread Calculations in Modern Communications Systems. Journal of Applied Sciences, 5: 597-603.
DOI: 10.3923/jas.2005.597.603
URL: https://scialert.net/abstract/?doi=jas.2005.597.603
DOI: 10.3923/jas.2005.597.603
URL: https://scialert.net/abstract/?doi=jas.2005.597.603
INTRODUCTION
The mobile environment has been the subject of an enormous amount of theoretical analysis and field experimentation. The problems, however, are of sufficient complexity that mobile systems designers are still highly constrainedly performance uncertainties in different types of settings. Indeed, it should be noted that there is no such thing as a single mobile environment, describable with uniform characteristics or statistics.
Mobile radio communication systems use the atmosphere as its access medium. This environment is rather hostile and is subjected to continuous changes in its parameters. These changes affect the signaling paths causing different replicas of the signal to arrive at the receiver at different time delays, the cumulative delay between the first received signal and the last considered (intelligible) replica signal is a measure of delay spread (δ), this in turn limits the use of different systems deploying different transmission rates in their operations. The systems adopting high transmission rates (e.g. UMTS) will experience a more severe transmission problem than those using lower transmission rates; this in turn will degrade the overall system capacity performance unless some measure is adopted to alleviate this problem. The phenomenon of multipath causes a change in the fundamental radio wave parameters (amplitude, phase and frequency), giving rise to multipath fading[1].
The analysis takes into account factors such as the transmitter output power, the directional characteristics of the antenna, the height of the tower, the surrounding terrain, frenzel height and so forth. It evaluates, the signal strength contours and delay spreads for different types of microcell sites, potential co-channel and adjacent channel interference, projected availability of service and other aspects of mobile system performance in the real world, to produce an optimum and accurate system's coverage plan.
The impetus of this research is to investigate delay spread and its relation to the dimension (coverage) and material properties of the mobile radio environment. The sources and types of fading are investigated and the effect of fading on the system capacity performance is considered. A novel technique for the evaluation of delay spread is designed and implemented to assist in assessing the impulse response of the signaling path over the optimum coverage area. The effects of Doppler shifts are also studied. A hardware model is proposed to simulate Rayleigh fading, based on Gaussian noise sources[2,3] and expanded to put forward a laboratory experimental procedure to measure Doppler frequency shifts.
Mobile environment problems: Multipath propagation imposes some impairments on the system capacity performance and on the overall service quality. The major impairments are considered in this section.
Fading: The mobile environment in large cities with great many tall, man made structures is very different from the mobile environment in flat, open farm country. Hence there is no single model that can fully characterize the mobile environment.
The important variables that define the mobile environment and determine the sources of multipath fading for a particular geographical area include:
| • | Natural terrain (mountains, hills, flat land and water) |
| • | Man-made structures (buildings; height, arrangement and nature of construction material) |
| • | Foliage and vegetation characteristics (trees and forests). |
| • | Normal and abnormal weather conditions (Fog, snow, rain and lightning). |
| • | Man-made radio noise. |
Finally, the rate of fading occurrence is related to the system operating radio frequency and to the behaviour of the mobile station, i.e. the speed and direction of travel. Fast moving mobiles, for example, experience deep fades more often than slow moving ones. And for the sake of this study the new GSM band (triple band) is considered in the investigation.
Fading can be classified into two major categories according to source and duration of the fade. These are fast (short-term) fading and slow (long-term) fading. Slow fading is also known as shadowing which is the effect caused by movement over distances large enough to produce gross changes in the overall path between the base station and mobile. The depth of shadowing can be in excess of 30 dB and its effect can last up to 10 sec[4]. Although the rate of occurrence is low, it is not uncommon.
The second category is termed fast fading. It is caused by multiple reflections of the transmitted signal by local scatterers, such as houses, cars, buildings and by natural obstructions such as hills and trees located between the transmitter and the receiver.
 | |
| Fig. 1: | Fading distribution types |
Fast fading lasts only for a very short period of time. This phenomenon is less destructive than shadowing but its rate of occurrence is greater.
The sources of multipath listed above are not correlated; therefore, fast fading can further be subdivided according to the resultant received envelope distribution. If all the waves arriving at the mobile receiver are reflected and scattered, the distribution function of the received signal is similar to Rayleigh distribution as shown by curve 1 in Fig. 1. If however there exists a direct path wave of significant power level then the resulting envelope and phase distribution will no longer be Rayleigh. The relevant distribution will then be those derived by Rice[5] and is shown by curve 2 in Fig. 1. These distribution are, in general, quite complicated, but when the power of the direct path wave is significantly greater than that in the combined scattered waves, the resultant waves will be Gaussian distributed as shown by curve 3 in Fig. 1.
It can be seen from Fig. 1 the Rayleigh fading distribution is by far more dominant than the other types, as its rate of occurrence is the highest, hence this type of fading is investigated more thoroughly in this study.
Unlike shadowing, fast fading can be alleviated by considering an appropriate equalisation and/or diversity technique. However to be able to optimally cure this problem more knowledge is needed to understand the effect of delay spread on the radio link performance.
Delay spread: Multipath propagations result in different signals arrival times. The time elapsed between the arrival of the signal from the shortest path and that from the longest path is known as the time delay spread (δ). The average delay spread for the mobile environment is reported to be 5 μsec[6,7] for the operating frequency range up to 1500 MHZ. However, for the frequency band deployed in mobile applications namely the triple band (1800-1900 MHZ) no such information is available especially for microcellular coverage.
 | |
| Fig. 2: | Pulse transmitter |
 | |
| Fig. 3: | Pulse receiver |
 | |
| Fig. 4: | Typical impulse response at the receiver end |
Delay spread measurement: If the delay spread duration is large relative to the average symbol time then intersymbol interference (ISI) results, as individual symbols begin to overlap with proceeding and following ones, causing transmission errors. And the type of fading it generates known as frequency selective fading. The aim of this section is to investigate delay spread in different typical microcellular mobile environments that assists in the radio coverage and transmission rates limitation analysis[8].
Equipment and methods: The system was designed and implemented as shown in Fig. 2 and 3 to measure the impulse response of the channel.
The transmitted pulses are generated by a pulse generator and amplified to a 1-Watt peak power. The pulse repetition rate is 10Hz, as shown in Fig. 2. Two carefully designed quadrature omnidirectional antennas are used as the transmit antenna, as depicted in Fig. 2 and as the receive antenna Fig. 3.
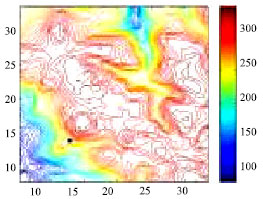 | |
| Fig. 5: | Coverage for a transmitter in open area |
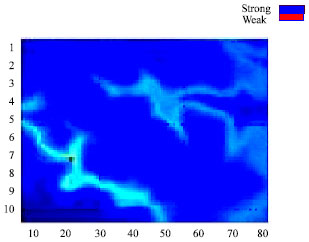 | |
| Fig. 6: | Full coverage using 10 m high Tx antenna |
Figure 3 shows that the pulse receiver consists of a front-end filter, a low noise amplifier, a mixer, an IF amplifier and a detector logarithmic amplifier. The noise floor of the receiver is -85 dBm and the dynamic range is 60 dB. Out of the logarithmic amplifier the received pulses are sampled using an advanced digital oscilloscope which is then transferred to a PC. Software is developed to calculate the delay spread for each impulse response. A typical impulse response is shown in Fig. 4.
During measurements the transmitter was placed in a fixed position giving a good coverage; however the receiver was moved slowly around the measurement site. The major problem encountered with the system was its sensitivity to interference from different noise sources at the measurement site; this problem was overcome by ignoring false impulse response readings by the data processor as also suggested by Witrisal[10].
Measurements: A number of different areas were selected for the measurement phase, the closest however to the aim of this paper is the microcellular coverage at 1800-1900 MHz and the transmitter was placed at a location to give the best coverage as shown in Fig. 5.
 | |
| Fig. 7: | CDF for measurement in microcellular area |
As depicted in Fig. 5 the transmitter is placed in a corner raised 5 m above ground, with such setting the coverage area is acceptable as 95% of the vicinity around the transmitter is covered however the power distribution varying depending on where the signal is picked and in some areas the signal level drops below the acceptable service power limit. This is all attributed to transmitter antenna height. And as the transmitter (Tx) antenna is raised to 10 m high the coverage area becomes better as shown in Fig. 6 as most of the covered area is blue coloured indicating an excellent power distribution over the whole coverage area. The cellular engineer’s objective however, as well known is not simply to blast out the maximum power in all directions. Indeed, cellular architecture calls for the creation of controlled small coverage area (microcells), such that the transmission from one cell site will attenuate sufficiently at a given distance for the frequencies to be reused. In other words, the problem of co-channel interference comes to the force.
It is noticed from Fig. 6 that there is a line of site over the whole area and the maximum distances in these measurements are 120 to 150 m. The cumulative Distribution Function (CDF) for such mobile environment is calculated and is shown in Fig. 7.
The median is computed to be 74 nsec and the first and last decentile are found to be 25 and 180 nsec, respectively. The measurements were repeated for different microcell sizes and different CDF were obtained in each case. Table 1 shows a summary of all the sizes considered in this research and the corresponding delay spreads.
It is noticed from Table 1 that the delay spread do not increase with the size of the cell considered as the obstacles and the nature of the environment directly affect the performance of the mobile communications radio link performance.
| Table 1: | Delay spread for different media |
 | |
| Table 2: | Calculated normalised delay spread |
 | |
Furthermore, the Table 1 have to be compared with the bit period of the mobile service considered or under study to obtain an acceptable quality for the radio-signaling path and hence achieve the optimum coverage required. For the current GSM system such readings will impose no problem as the percentage of rms. delay spread is way below the 10% of the bit duration and hence the BER obtained for such service is 3x10⁻³. Which means that delay spread in this case causes no catastrophic transmission errors and the C/I ratio obtained is approximately 12 dB. It is concluded that if the rms. delay spread (δ) does not exceed the 10% of the bit period an average of 10-3 BER can be obtained[6] and this implies no transmission errors. Also, it is also worth noting that delay spread is a measure of the selectivity of the channel. That is, if the normalised time delay spread is very much smaller than unity, i.e. (δ/t<<1)
Then the modulated phase fluctuation at the sampling instant will only slightly differ if the received signal envelope (amplitude) and phase of the different components are slightly changed. Therefore, there will be no significant transmission errors. Table 2 shows the normalised delay spread measurements for different digital communications systems in operation or will be operated in the near future, as presented in the following case study;
Case study: The open area (150x150 m) is considered, the delay spread for this microcell size (representing an open square) was calculated in previous section to be 180 nsec and this case study is performed for the mobile communications systems shown in Table 2.
The study, compares the calculated delay spreads to 10% of the bit period (normalised δ) and shows that difficulties arise in UMTS and DECT mobile systems giving rise to transmission (Tx) errors, particularly for the case of open areas, such as shopping centres and bus stations. However Table 2 shows that GPRS (General packet radio switched) gives the required BER of 10-3 at a delay spread of 180 nsec.
However, when the signal is in deep fade (i.e. δ/t ≈ 1) then slight changes in the signal envelope and phase of the different components produce large changes in the phase, thus the system BER performance is rather poor. Adachi[2] shows that for BER of 10-3 the allowed normalised delay spread limit is:
| (1) |
It can be concluded from (1) that a system operating at high bit rates as in modern mobile systems will experience severe ISI that degrades the transmission quality significantly. Therefore, extra measures of protection are needed to protect the signal propagating in the mobile environment. The scenario is further complicated by the fact that the longer the propagation path is the more losses the signal encounters.
Free space losses (inverse law): As the signal is radiated in all directions, assuming for the moment an Omni-directional antenna, the power of the signal at any given point steadily diminishes as a function of distance between the receiver and transmitter. In a vacuum, the signal strength is inversely proportional to the distance. In free space, if the received signal is 1 watt at 100 m distance, it will be 0.25 watt at 200 m (1/4 the power), but it is 0.04 watt at 500 m (1/5 the power) and 0.01 watt at 1000 m (1/100 the power), assuming the same antenna. Figure 8 shows simulation results of the power versus distance for High Street Kensington (central London).
The fundamental equation for free space transmission is expressed in terms of frequency (f) in MHZ and distance (D) in meter (m) as follows:
| (2) |
Figure 8 shows the signal power drops with distance and a drop of 20 dB in the signal level is noticed for a distance travel from 0 to 100 m. And indeed this is a significant drop in the power level over such a short propagation path. This is mainly due to the nature of the mobile environment’s microcell with such a highly constructed well-populated site.
Doppler shift: Typically, in mobile radio communications one station (base station) is stationary while the other (mobile station) is moving. As the mobile station moves, from one location to another, not only does the phase relationship between the spectral components change, but also different Doppler frequency shifts are incurred in the spectral components within the received signal (i.e. different replicas of the received signal due to multipath phenomena undergo different Doppler shifts).
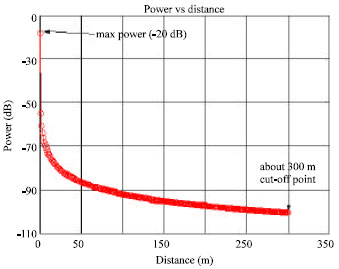 | |
| Fig. 8: | Power vs. distance |
Therefore, radio transmission is frequency shifted due to the relative motion of the receiver. Not only does frequency shift (fm) change as the mobile station alters the speed, but also as the direction of travel and the carrier frequency are changed, as follows;
| (3) |
Where, θ: is the angle between the signal arrival and mobile station direction of travel,
| λ: | is the carrier frequency (f) wavelength. |
| V: | mobile station speed of travel. |
Therefore, the maximum Doppler frequency shift is incurred when θ=0. It affects all multiple propagation paths, some of which may exhibit a positive shift while others exhibit negative shift at the same instant of time. The difference in the Doppler shift signal, exhibited by different spectral components, depends on the direction of component arrival. Therefore it is important to have accurate information about the Doppler frequency performance in the mobile environment. An accurate method for measuring Doppler shift is proposed, it provides the mobile communications system designer with additional information for designing a more reliable and robust system.
It was mentioned earlier that Rayleigh fading is the most dominant type of fading that affects the radio link performance and subsequently the overall system capacity in mobile communications. Therefore, is it important to fully understand this phenomenon to be able to counter measure it? The remainder of this paper describes a hardware model for the simulation of Rayleigh fading and proposes a novel technique for the accurate measurement of Doppler shift and phase fluctuations.
 | |
| Fig. 9: | Block diagram of Rayleigh fading simulator |
 | |
| Fig. 10: | Set-up procedure to measure Doppler shift |
A hardware modelling of Rayleigh fading and Doppler shift measurements: It was shown in Fig. 1 that the Rayleigh fading distribution function is very similar to the Gaussian distribution. Clarke[2] shows that when two uncorrelated (orthogonal) Gaussian noise sources with identical spectrum are added in quadrature, the RF output then has a Rayleigh distributed envelope. The same technique was adopted[3,7] to generate Rayleigh fading signal. A very similar method is proposed here Fig. 9 shows a schematic block diagram of the proposed Rayleigh fading simulator.
The Gaussian noise generator uses a noisy Zener diode[2,3] operating near cut-off for the generation of noise; the Zener output is then amplified to give the desired noise signal. This signal is divided into two noise signals, one of which is 90° shifted relative to the other, thus two uncorrelated Gaussian noise signals are generated.
These two signals are then passed through identical shaping filters, the function of this filter is to simulate the theoretical fading spectrum S(f), so that the output from the simulator is a Rayleigh distributed signal. The characteristics of this signal can be investigated for different situations, e.g. Doppler frequency shifts and different vehicle speeds.
The network analyser (TR 4623) used in Doppler frequency measurements, shown in Fig. 10, has three RF inputs, two of which (A, R) are used to perform the Doppler frequency measurements.
The RF signal generator output is directly connected to input A, supplying the reference RF input to which the analyser is tuned. The other input R is connected to an omnidirectional antenna via the RF tuned circuit to receive the transmitted Rayleigh signal. The analyser compares the two inputs, the signal from input A and the perturbed signal from input R. The difference signal (information about the corresponding Doppler shift) is then displayed on the analyser screen. The same procedure can be repeated for different vehicle speeds, by altering the components values of the twin-T circuit in the Rayleigh fading generator. Precise values of Doppler frequency shifts are then obtained by processing the collected information using a spectrogram[7]. A 25Hz Doppler shift, corresponding to 1890 MHZ operating frequency and 30 km/h vehicle speed is obtained, such value is enough to introduce sufficient (ISI) distortion that degrades the service quality. Increasing the C/I ratio in the design's setting reduces the impact of Doppler effect. But clearly, any increase in the C/I results in worse spectrum efficiency performance, it is also shown by Rappaprot[10] a full study of delay spread and its relation to ISI.
Such Doppler shift measurements provide the system designer with valuable information to be considered in the design of more reliable and efficient mobile communication systems. And this would be the subject of further research in this area.
CONCLUSIONS
Fading is the immediate consequence of multipath phenomenon. Rayleigh by far is the most dominant type of fading affecting the radio link performance and coverage area in the mobile environment. Delay spread (δ) provides a quantitative measure of multipath fading and it is found that δ is related to the coverage area but is not directly proportional to it. And the new technique presented for the measurement of δ over microcellular sites (ranging from 20 to 250 m) at the new triple band, indicates that delay spread is related to the digital mobile system's transmission rate, in the form of minimum symbol length that can be used to avoid excessive ISI. The performance study shows that modern 3G (third generation) UMTS systems will not be suitable in microcellular architectures, as the normalised δ is over 40%. And this introduces high ISI (BER>10-3) and dramatic transmission errors. Therefore, at such sites extra measures are needed to counter balance the mobile environment coverage problems, to be able to use the modern and emerging technologies.
ACKNOWLEDGMENTS
The author would like to thank Dr. Prof. F. Halsall (University of Wales, UK) and Dr. F Adachi (R and D NTT, Japan) for the comments and discussions that led to the idea of this research.
REFERENCES
- Clarke, K.K., 1967. Discriminator response to an FM signal in a fading channel. IEEE Trans. Commun. Technol., 15: 252-263.
CrossRefDirect Link - Gaston, A.A., 1973. A multipath fading simulator for mobile radio. IEEE Trans. Vehicular Technol., 32: 241-244.
Direct Link - French, R.C., 1979. The effect of fading and shadowing on channel reuse in mobile radio. IEEE Trans. Vehicular Technol., 28: 171-181.
Direct Link - Justin, C.I., 1986. Modeling and analysis of a digital portable communications channel with time delay spread. Proceedings of the 36th IEEE Vehicular Technology Conference, May 20-22, IEEE Inc., New York, pp: 246-251.
Direct Link - Chung, J.C., 1987. The effect of time delay spread on portable radio communications channels with digital modulation. IEEE J. Selected Areas Commun., 5: 879-889.
Direct Link - Witrisal, K., 2001. On estimating the RMS delay spread from frequency-domain level crossing rate. IEEE Commun. Lett., 5: 287-289.
Direct Link