
M.A. Xin
Harbin Institute of Technology, School of Management, Harbin, 150001, China
X.I. Bao
Harbin Institute of Technology, School of Management, Harbin, 150001, China
Information Technology Journal
Year: 2013 | Volume: 12 | Issue: 11 | Page No.: 2146-2152


ABSTRACT
Image files become an important resource for its characteristics such as rich information, intuitive vivid content etc. In recent years, the technology on image retrieval achieved rapid development. This study centers around the development and evaluation of the image retrieval system based on the content. The research work had been carried out as following: Firstly, designed the image retrieval method and image retrieval system based on the three color edge characteristics; Secondly, made a performance test and user’s satisfaction evaluation of the designed system. In the process of system design, a novel image retrieval method is built in this study. Using the methods such as three component of color image, edge detection, image block technology realized a image retrieval system which the precision rate and recall rate are satisfying. In using the satisfaction evaluation, 14 indicators are built in the questionnaire. Determined five common factors by the factor analysis and used the regression analysis to obtain the user’s satisfaction of the software designed in this study.
PDF Abstract XML References Citation
Received: January 22, 2013;
Accepted: May 21, 2013;
Published: July 24, 2013
How to cite this article
M.A. Xin and X.I. Bao, 2013. Design and Evaluation of Image Retrieval System Based on Three Color Edge Feature. Information Technology Journal, 12: 2146-2152.
DOI: 10.3923/itj.2013.2146.2152
URL: https://scialert.net/abstract/?doi=itj.2013.2146.2152
DOI: 10.3923/itj.2013.2146.2152
URL: https://scialert.net/abstract/?doi=itj.2013.2146.2152
INTRODUCTION
With the improvement of computer hardware, image has become more and more important information carrier and all kinds of image database have been also constructed. In order to find out the image needed by user, image retrieval technology has been researched. Image retrieval methods are generally two ways: one is text-based image retrieval and another is content-based image retrieval (Apostolova et al., 2013).
In fact, text-based image retrieval is the process of searching homonymy image. So, errors often appear in text-based image retrieval. Therefore, content-based image retrieval has gradually become the main technology in the field of image retrieval (Schaefer, 2011). In content-based image retrieval, image features can be divided into three categories such as color feature, texture feature, shape feature (Lai, 2013). Because human eye is more sensitive to color, color becomes a feature in common use. Shape and texture feature is used to judge edge direction or image contour.
Because single feature may reduce the accuracy, it is more effective that many features are combined to finish image retrieval. A multi-feature fusion method had been proposed. First, original image was segmented some sub-blocks. Then, colour feature and texture feature was extracted on every sub-blocks. Finally, Euclidean distance measure is used in retrieval query image (Vimina and Jacob, 2012). To extract colour feature and texture feature, wavelet transform and K-mean algorithm is used in forming feature vectors (Bai et al., 2012). Shape feature is also used in image retrieval and a new method was proposed with feature points. In this method, similarity measure was computed with a stretch matching algorithm and a descriptor which could weaken noise (Pedrosa et al., 2011).
Many objective parameters can be used in evaluating the performance of image retrieval, including retrieval accuracy, retrieval speed, recall ratio. For image retrieval system or software, statistics method is more suitable to test users’ satisfaction. A predicted model has been built for satisfaction evaluation of software system. This model can gather feedback by analyzing influence factors to users and it can obtain a good approximation of actual satisfaction (Rumyana and Barbara, 2013). Correlation analysis, regression analysis, factor analysis is also used in judging satisfaction and these methods can be combined to improve evaluation accuracy (Xie and Lianguang, 2013; Shuangping et al., 2013; Xiaoxi, 2012).
In this study, an image retrieval system was built based on three colour edge features and factor analysis method and other statistical method was used evaluating users’ satisfaction for this retrieval system.
DESIGN OF IMAGE RETRIEVAL SYSTEM BASED ON THREE COLOR EDGE FEATURE
Framework design of image retrieval system: In order to build an efficient image retrieval system, multi-feature fusion strategy is still used in core retrieval method.
 | |
| Fig. 1: | Framework design of image retrieval system |
First, original image need be segmented to several sub-blocks. Second, three color components are extracted according to every sub-block image. Third, MP edge detection is used in extracting edge for every color component. Fourth, similarity measure is formed by computing edge pixel percentage of three color components of all sub-blocks. Finally, image retrieval is carried out by using this similarity measure. The framework of image retrieval system is designed as Fig. 1.
Feature extraction: Image size is an important cause which can determine the speed of image processing and image retrieval. In this study, every image is segmented into some blocks and feature extraction is carried out on these sub-blocks.
Three color components computation: Color feature is extracted on every sub-block image. Because color format is RGB model commonly, sub-block image is first divided into three color components such as red, green and blue. Then, color mean value is calculated for each color component image as followings:
| (1) |
| (2) |
| (3) |
where, ![]() and
and ![]() is the mean value of red component, green component and blue component, respectively. When there are k sub-blocks of original image, SIk is the kth sub image. w and h is the width and height of every sub image. r(i, j), g(i, j) and b(i, j) is the red value, green value and blue value of every pixel.
is the mean value of red component, green component and blue component, respectively. When there are k sub-blocks of original image, SIk is the kth sub image. w and h is the width and height of every sub image. r(i, j), g(i, j) and b(i, j) is the red value, green value and blue value of every pixel.
Edge detection: Edge feature of each color component image is used in retrieving image. In this study, Canny operator is selected for edge detection. Compared with other operators, Canny edge detection has two advantages: accurate location and single pixel edge. Canny edge detection is carried out as follows:
| • | Gauss filter is used in smoothing image. If g(x, y) describes original image and f(x, y) describes smoothed image, Gauss filter can be shown as Eq. 4: |
| (4) |
| • | Edge intensity and direction is calculated by using partial derivative of smoothed image. This process is just like Eq. 5: |
 | (5) |
| where, f’x(x, y) is the first order partial derivative of x direction, f’y(x, y) is the first order partial derivative of y direction, M(x, y) is the edge intensity, θ(x, y) is edge direction | |
| • | False edge information is depressed. After partial derivative solution, a large number of edge will be calculated but many of them are not true edges which should be removed. In Canny algorithm, all edges will be taken to compare with neighbourhood gradient extreme value. If they are smaller than neighbourhood gradient extreme value, these edges are false edges |
| • | Discontinuous edge feature will be connected into a complete edge. In this procedure, discontinuous two non-zero pixels should be connected in a neighbourhood |
Similarity measure: Use the color feature and edge feature extracted previous, you can compare two similar degree of the image. Firstly, Eq. 1-3 were used one by one to compare the three color component information of the two corresponding sub-block images. In this way can form the first screening of image retrieval. Afterwards, edge percentage was used as secondary retrieval features to obtain the final retrieval results.
Assuming that the original image was separated into nxm sub blocks and then through calculating the red, green and blue three color components, so there are 3xnxm sub blocks in total. After Canny edge detection in anterior segment, each sub image only have edge pixels and background pixels. Thus, each sub image’s edge percentage only requires the statistic of different gray level and it can be realized.
According to the Eq. 6, calculate the margin percentage for each child images, respectively:
| (6) |
In Eq. 6, f%i on behalf of the edge of the percentage of the image, Num(E) on behalf of the number of edge pixels, Num(B) on behalf of the pixel number in the all sub image.
In this way, the set of the sub image percentage’s feature can use Eq. 7 said:
| (7) |
In carrying out the second retrieval, a method was taken base on edge percentage feature’s similarity measure, as shown in Eq. 8:
| (8) |
In Eq. 8, Q on behalf of the queried image, D on behalf of the database image in the database.
Image retrieval experiment: According to former method of sub image edge feature detection base on three color components, this study constructed the corresponding image retrieval system. And use different image to retrieve query images in the database, in this way to test the system’s performance. There are 1000 color pictures in the test image library, the image formats are JPG format, Image content related to landscape, scenery, flowers, animals, cars, buildings, people, etc. As shown in the Fig. 2 are the image results of three color extraction, edge detection and block processing.
Use the original image in Fig. 2 as a query image, the retrieval result in the database is shown in Fig. 3 which were ranked for its similarity.
It can be seen from the figure that satisfactory result could be obtained by using the retrieval methods and the retrieval system built in this study, the former six image’s precision is 100%. For tiger’s image, the curve of the precision and the entirety was shown in Fig. 4.
In fact, retrieval experiments are also do with images of other content, respectively and make a comparison using based on color feature retrieval (method 1), based on edge feature retrieval (method 2) and the retrieval method in this study (method 3). The final retrieval results as shown in Table 1.
It can be seen from the data in Table 1 that the method of this study has been achieved higher retrieval accuracy when the content of image is different and it didn’t take too much time.
SATISFACTION EVALUATION OF IMAGE RETRIEVAL SYSTEM BASED ON THREE COLOR EDGE FEATURE
Satisfaction evaluation method: The final purpose of the image retrieval system built in this study is to be popularized and applied in more fields. Therefore, this system had been tried among some users and use the questionnaire to know the user’s satisfaction for the usage of this software system.
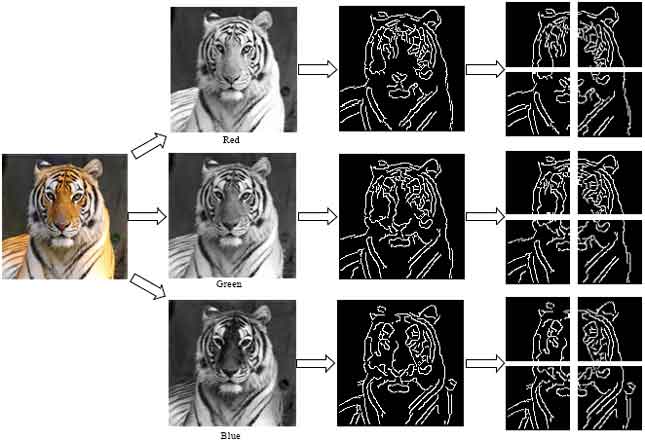 | |
| Fig. 2: | Result of three color extraction, edge detection, block processing. From left to right, the original image is first divided into three color component images. After that, each color component image is carried out edge detection. Finally, the edge detection image is segmented four pieces |
| Table 1: | Retrieval accuracy and retrieval time of different methods. According to three different retrieval methods, six different query images are carried out image retrieval and retrieval precision and retrieval time are all listed |
 | |
However, excessive question is unfavorable for subsequent statistical analysis. On one hand, too many question causes the complexity of the statistical work; on the other hand, too many questions will increase the risk of "collineation" issue. So-called "collineation" problem is that multiple questions might point to the same problem, the coexist itself is redundant and unnecessary. Therefore, it is necessary to simplify multiple questions and the most commonly used means is factor analysis.
Factor analysis: The essence of the factor analysis is make a new expression for the original question set , every question will be regarded as combination of a common factor and characteristic factor. The subsequent statistical analysis will focus on common factor rather than the original question. Because the number of common factors is much less than the number of original questions so as to achieve the aim of reduction.
Supposed there are n questions in the original question set Z, its factor analytical form as shown in Eq. 9:
 | (9) |
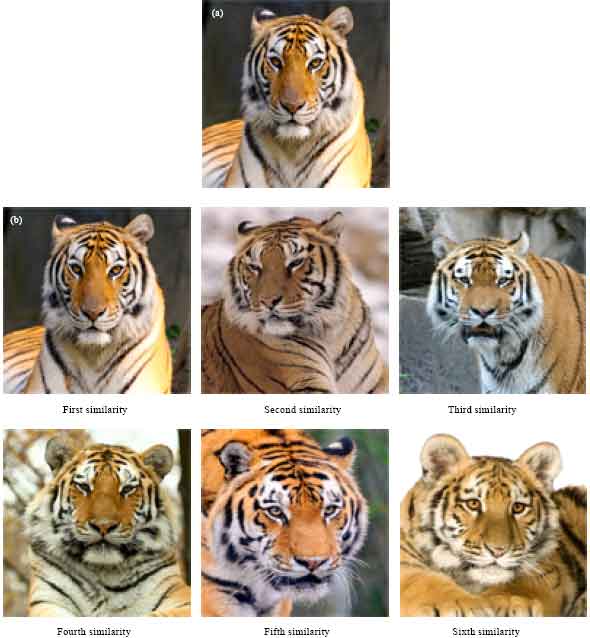 | |
| Fig. 3(a-b): | Retrieval results using the tiger image. The above image is the query image, the lower is the retrieval results according to the query image. Image sequence is set according the value of similarity (a) Query image and (b) Retrieval results |
In Eq. 9, Fi is the common question factor of every question, Uj is the characteristic factor of every question, aij is the common factor load parameter. All aij compose the load matrix as shown in Eq. 1:
 | (10) |
Use the load matrix to calculate the sum of the squares of line j element to obtain the communalities corresponding to Zj shown in Eq. 4:
| (11) |
Communality represents the common factor’s explained ability for the original question. The higher it is, the closer it gets to the real situation of the original question. Generally speaking, if Communality larger than 0.8, it can be concluded that common factor is available.
Regression analysis: After determined the common factor by factor analysis, the connection degree should be determined between each common factor and total goal. At this time, some analysis methods should be used including correlation analysis, regression analysis and other methods.
The status of the variability to be analysed in the correlation analysis are equal but there are both variable and dependent variable in regression analysis. And regression analysis can test the relation between multiple variables and the dependent variables at the same time. This is multiple linear regression analysis, its mathematical description as shown in Eq. 5:
| (12) |
In Eq. 12, Y on behalf of the dependent variable, Xi(i = 1, 2,…, n)on behalf of the variable, β0 on behalf of the constant, βi(i = 1, 2,…, n) on behalf of the regression coefficient, ε on behalf of the error correction term.
 | |
| Fig. 4: | Tiger image’s precision and entirety of the retrieval result |
Satisfaction evaluation experiment
Questionnaire design: In the satisfaction assessment questionnaire about the usage of the image retrieval platform in this study, a questionnaire was designed containing 14 indexes, as shown in Table 2.
Factor analysis: It can be seen from Table 1 that 14 questions are designed in order to investigate the user’s degree of satisfaction with image retrieval system in this study. Factor analysis should be used for simplify subsequent statistical analysis and to find out the common factor of the 14 questions.
The results of the factor analysis as shown in Table 3.
It can be seen from Table 3 that there are five common factors in the 14 questions which can be used as a simplified representation of the original question. It can be used in the subsequent regression analysis.
In order to make these common factors more practical, the five variable factors were named as F1, F2, F3, F4, F5, for operational satisfaction, satisfaction interactivity, functional satisfaction, trustworthiness satisfaction, quality satisfaction, respectively.
Regression analysis: Use the regression analysis model shown in Eq. 12 to distinguish the user’s satisfaction degree of the image retrieval system further. Use the Eviews software to deal with the raw data and get the regression equation between the satisfaction degree and five factors which is shown in Eq. 13:
| (13) |
According to the survey data in the original questionnaire, the score could be obtained for F1, F2, F3, F4, F5, is 0.903, 0.864, 0.877, 0.915, 0.727, 0.801, respectively.
| Table 2: | Question design of questionnaire. The questionnaire consists 14 items and their mathematical description is from Z1-Z14. Meaning of every item is listed at the right side of the question |
 | |
| Table 3: | Results of factor analysis. The results of factor analysis show that there are 5 principal component factors among these 14 items |
 | |
| Z1, Z2, Z3, Z4, Z5, Z6, Z7, Z8, Z9, Z10, Z11, Z12, Z13, Z14 is item in questionnaire, F1, F2, F3, F4, F5 is principal component factor of these 14 items | |
In this way, the software’s overall satisfaction is 0.92 eventually. It shows that the tested users are very satisfied with the image retrieval system which is designed in this study.
CONCLUSION
This study regards the content-based image retrieval technology as the research object, carried out a designation of related retrieval method and related retrieval system. System’s core retrieval method was realized by following these steps: Firstly, calculate the trichromatic components in RGB of the query and database images; Then make edge detection for every color’s component and split the edge image into blocks; Finally, by calculating the edge percentage of each color component’s edge sub-block and build the corresponding similarity measure to complete the image retrieval. Image retrieval’s confirmatory experiment confirmed the effectiveness of the developed system in this study. After that, the image retrieval system was tested in this paper among users to investigate the user’s satisfaction of the software.
After the data’s process methods such as the design of corresponding questionnaire, factor analysis and regression analysis, the user’s satisfaction was got with the software is 0.92. Consequently, it confirmed that the software designed in this paper obtained satisfied result in the practical application.
REFERENCES
- Apostolova, E., Y. Daekeun, X. Zhiyun, A. Sameer and D.F. Dina et al., 2013. Image retrieval from scientific publications: Text and image content processing to separate multi-panel figures. J. Am. Soc. Inform. Sci. Technol., 64: 893-908.
CrossRefDirect Link - Lai, C.H., 2013. A colour image retrieval scheme based on Z-scanning technique. Imag. Sci. J., 61: 320-333.
CrossRefDirect Link - Bai, C., W. Zou, K. Kpalma and J. Ronsin, 2012. Efficient colour texture image retrieval by combination of colour and texture features in wavelet domain. Elect. Lett., 48: 1463-1465.
Direct Link - Pedrosa, G.V., C. Barcelos and M.A. Batista, 2011. An image retrieval system using shape salience points. Proceedings of the International Symposium on Circuits and Systems, May 15-18, 2011, Rio de Janeiropp, pp: 2797-2800.
CrossRefDirect Link - Rumyana, P. and P. Barbara, 2013. Factors influencing user feedback on predicted satisfaction with software systems. Proceedings of the 19th International Conference on Requirements Engineering: Foundation for Software Quality, Volume 7830, April 8-11, 2013, Essen, Germany, pp: 96-111.
CrossRefDirect Link - Xie, Z. and M. Lianguang, 2013. Grey relevance analysis of real estate prices influencing factors: Taking Changsha as an example. Proceedings of the 3rd International Conference on Intelligent System Design and Engineering Applications, January 16-18, 2013, Hong Kong, pp: 800-802.
CrossRefDirect Link - Vimina, E.R. and K.P. Jacob, 2012. Image retrieval using local colour and texture features. Proceedings of the International Conference on Mechanical Engineering and Technology, November 24-25, 2011, London, UK., pp: 767-772.
CrossRef