
A.V. Ram Prasad
Not Available
M. Meenakshi
Not Available
Information Technology Journal
Year: 2006 | Volume: 5 | Issue: 4 | Page No.: 735-741


ABSTRACT
Dense Wavelength Division Multiplexing (DWDM) transport systems offer large capacity with small number of channels achieving high spectral efficiency and can be limited by fiber non linearities. Propagation of optical signals through fiber is governed by Nonlinear Schrödinger Equation (NLSE) whose solution must be derived employing numerical methods. In this study, we have focused on the split step Fourier method, to simulate the fiber link system and its efficiency depending on both the time domain resolution and on the distribution of step size along the fiber. One of the most critical problems in numerical analysis of DWDM is to take into account an inaccurate way the Four Wave Mixing (FWM) contribution to the total field propagating into the fiber. An accurate choice of step size is required any time we run split step Fourier method. In this study results has been simulated by taking variable and constant step size in split step Fourier method by solving NLSE. To the first time of author`s knowledge analytical expressions for the mark and space states of the receiver current was obtained and the probability density function for both the mark and space state of the receiver current was computed by random numerical simulations.
PDF Abstract XML References Citation
How to cite this article
A.V. Ram Prasad and M. Meenakshi, 2006. A Study on the Statistical Behaviour of Receiving Currents in the Presence of Four Wave Mixing Effect in DWDM Optical Systems. Information Technology Journal, 5: 735-741.
DOI: 10.3923/itj.2006.735.741
URL: https://scialert.net/abstract/?doi=itj.2006.735.741
DOI: 10.3923/itj.2006.735.741
URL: https://scialert.net/abstract/?doi=itj.2006.735.741
INTRODUCTION
The most commonly used method in the fiber span simulation is Split Step Method (SSM) discussed in Agarwal (1995) which is based on the partition of the fiber spans into several spatial steps. Over each step the linear (dispersion) and nonlinear operators (Kerr Effect) operators of the NLSE are considered separately therefore these phenomena are supposed to act independently to each other. In this study we have simulated the fiber model and the spurious tones are suppressed by choosing proper step size. The numerical solution of NLSE through SSM converge to the exact solution when the split step tends to zero. But since smaller is the step size higher is the computational time and a trade off between these two opposite requirements must be found out. In this study we have found that the step size is related to the nonlinear phase shift and we have also included the higher order dispersion components in our analysis of NLSE which is discussed in section1. In our simulation the side components can be suppressed by varying (reducing) the step size of the fiber. As referred in the literature an improper selection of step size not only lead to reduction of accuracy but also to numerical artifacts. Forgheri (1997) has demonstrated that the power of FWM is over estimated by the constant step size. Bosco et al. (2000) used a logarithmic distribution of the step size to keep the spurious FWM components limited. Francia (1999) has kept constant numerical step size for suppression of spurious components. In this study of our work the results have been shown for both the step size is constant and varied for the Gaussian pulse generator. Forgheri (1997) has analyzed the modeling of the FWM noise and Inoue et al. (1994) has taken the FWM noise as Gaussian distribution. In the second half of this study we have analytically derived the photocurrents of both cases assuming FWM noise as Gaussian and non Gaussian distributions we have conducted the random experimental simulation for sixteen channels and found out that the statistical distribution of the noise is non Gaussian which is an important result of the present research in this study Generally the FWM noise is due to inter modulation products where one component depends on another therefore the Gaussian distribution is not exact.
NUMERICAL SIMULATION OF NLSE
The Nonlinear Schrödinger equation has been shown to govern the propagation of light in a lossless optical fiber with second order dispersion as shown by Agarwal (1995).
| (1) |
In the above equation A is the complex field envelope, Z is the distance, β2 is the second order dispersion, γ is the nonlinear coefficient. The quantity t = (τ – Z /Vg) is the retarded time where τ is physical time and Vg is the group velocity. We can modify Eq. 1 to incorporate the effects of third order dispersion, amplification, amplified spontaneous noise and polarization mode dispersion to obtain a more realistic model of optical fiber transmission. In this study we have focused on the split step Fourier method. To understand the philosophy behind the Split step method it is useful to rewrite the Eq. 1 as
| (2) |
Where L is the linear part and N is the Nonlinear part. When the electric field has propagated from Z to Z+h then the split step approximation is given by
| (3) |
The accuracy can be improved by including the effect of non linearity in the middle of the segment. Here the fiber is divided into large number of segments of width h. The optical pulse is propagated down segment from segment in two stages at each step. First the pulse is propagated a distance h/2 with dispersion only then at Z+h/2 it is multiplied with the non linearity term that represents the effect of non linearity over the whole segment Finally the pulse is propagated the remaining h/2 distance with dispersion only. In effect the nonlinearity is assumed to be lumped at the mid plane of each segment
Algorithm for the split step model: Step(1) This corresponds to the first half dispersion only as shown in Fig. 1.
| (4) |
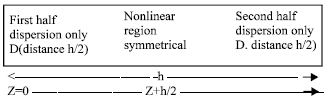 | |
| Fig. 1: | Schematic illustration of SSM method |
Where F is the fast Fourier Transform and A0 (0, T)) is the optical multiplexed signals of the optical channels of different carriers or that of a single channel or it can be that of a fundamental soliton given by
| (5) |
Where τ and ζ are normalized time and distance The WDM Signal is in fact all the summation of all the electric fields representing the optical intensity channels propagating along the fiber line.The linear operator D(jω) is obtained by replacing the differential operator jω where ω is the fourier frequency. Thus the equation is given by
| (6) |
Step 2. The split step model can be expressed in the following expression
 | (7) |
Where the integral has to be evaluated,ore accurately employing the trapezoidal rule and the approximated integral is given by
| (8) |
However the implementation is not simple since N(z+h) is not known at the middle of the segment located at z+(h/2). It is necessary to follow the iterative procedure that is initiated by replacing N(z+h) by N(z). Thus the overall algorithm of step 2 is given by
| (9) |
| (10) |
| (11) |
Hence the predicted N( z+h) is found to be
| (12) |
The predicted N(z+h) is substituted in the Eq. (10) to get the accurate prediction of above Eq. 12. Thus this process is done iteratively.
Step 3: The predicted N (z+h) is used to calculate the lumped region. In this process the nonlinear operator acts alone and D= 0.
| (13) |
Step 4: This step corresponds to second half dispersion region shown in Fig. 1. In this process only the dispersion acts alone and N=0
| (14) |
Step 5: Repeat Step 1 by substituting A (z+h,T) from Eq. 14 into A0(0,T) for further propagation it the next segment.
SIMULATION MODEL
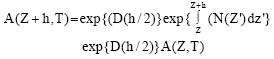
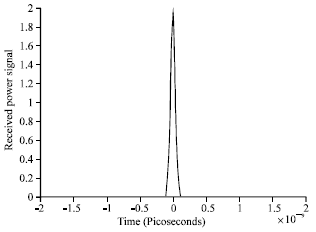
Applying this algorithm we have simulated a Gaussian pulse 2 mw initial power peak of signal source for varying chirp parameter, variable propagation distance, center wavelength of 1550 nm power loss of 0.2 db km-1, optical power amplifier of 20 db power gain. In our simulation we can fix the step size as a constant or variable length. In this study for a step size h the effect of non linear operator N is to increment the phase of A (complex field envelope) by an amount ΦNL= γ |A|2h. Here an upper limit to the nonlinear phase increment has been set up to bound the step size. Figure 2 shows the simulated receiver output on numerically solving the NLSE using the designed simulation model with the step size h = 20 of constant length as similar to that discussed by Francis (1999).
 | |
| Fig. 2: | Z=100 km, γ=2/w km, β2 Ps2 km, α=0.25 db/km |
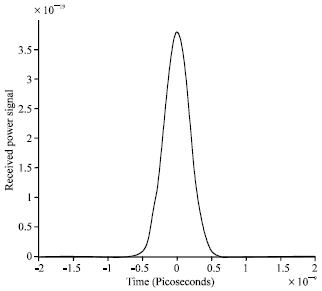
This output shows the side tones where the peak value is not converging and the side tones can be suppressed by reducing the step size. The parameters chosen in our model are as follows initial peak power of the signal source is 4 mw, dispersion parameter is -40 ps nm-1 km, non linear phase shift is 0.01. Figure 3 shows the suppressed side bands by reducing the step size to h = 10 of constant length in our simulation with other parameters unchanged. Figure 4 shows the output with the initial peak power of 2 mw initial pulse width of 50 e -12 sec, dispersion parameter (with beta three term ignored ) of -2 ps nm-1 km and the step size formulated is related to the maximum nonlinear phase shift. of 0.06 with the attenuation of 0.02 db km-1. Figure 5 is the desired output of the simulation model where a Gaussian pulse is assumed as the input signal with the chirping parameter zero (Ramprasad and Meenakshi, 2005). In the receiver side of our simulation, the optical amplifier with the gain of 20 db with flat response is assumed.
 | |
| Fig. 3: | 100 km, γ=2/w/km, β2=2 ps2 km-1, α=0.25 db km-1 |
 | |
| Fig. 4: | α=0.02 db km-1, D = -10 ps nm km, Φmax= 0.06 |
 | |
| Fig. 5: | α = 0.2 db km-1, D = -2ps nm km, Φ = 0.01, z=100 km |
THEORETICAL TREATMENT
The performance of WDM networks are strongly influenced by both linear and nonlinear phenomena that determines the signal propagation inside the fiber. However linear propagation effects are compensated and there is a class of nonlinear effects that pose additional limitations in DWDM systems. Four wave mixing in optical fibers is likely to degrade system performance in optical multi channel transmissions. It is a parametric interaction among optical waves which is analogous to inter modulation products in electrical systems. In a multi channel system the beating between two or more channels cause generation of one or more new frequencies at the expense of power depletion in the original channel. Since these mixing products can fall directly on signal channels, proper FWM suppression must be required to avoid interference between channels. In this treatment we consider multi channel systems in which one of the multiplexed light is selected by an optical filter in the receiver. We have assumed all the lights have an identical state of polarization which corresponds to considering the worst situation for system degradation. The light amplitude at the selected signal frequency E is given by equation
| (15) |
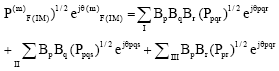
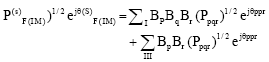
Where Ps and θs are the peak power and the phase, respectively of the selected signal light. As Ppqr and θpqr are those of FWM light generated from a channel combination of p, q and r th channels that satisfy p+q- r =s and Bi= 1 or 0 when the ith channel is mark or space (Inoue et al., 1994). The summation term in Eq. 15 contains all channels combinations satisfying p + q – r = s Here we classify those channel combinations into three categories. One is the case where all the channels including the selected channels are different (p ≠ q ≠ r ≠ s). The second case is when p, q and r channels are different but the rth channel is identical to the selected channel (p ≠ q ≠ r = s). The third case is when p and qth channels are identical (p = q ≠ r). We can express the above classifications as follows.
| (16) |
where summations I, II and III denote for p ≠ q ≠ r ≠ s, p ≠ q ≠ r =s and p = q ≠ r, respectively using the above Eq. 16 we can rewrite Eq. 15 as
 | (17a,b) |
 |
In Eq. 17a and 17b, E (m) represents the mark state and E(s) represents the space state (Eiselt, 1999).
Where the values in Eq. 17a and 17b is
 | (18) |
 | (19) |
In the direct detection scheme the selected light is directly coupled to the detector and the photo current is proportional to the optical power.
The signal current is written as
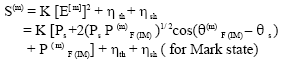 | (20) |
| (21) |
With K= ηe/hf is the receiver responsivity, where the signal current for mark and space states are S(m) and S(s) and η is the quantum efficiency of the detector, e is the electronic charge, h is the plank’s constant, f is the light frequency and the thermal noise and shot noise current expressions are also included. Equation 21 and 22 are basic expressions for evaluating the power penalty In our analysis we assume that Ps >> P( m) F (IM) in Eq. 20 hence this is rewritten as
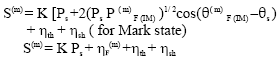 | (22) |
with
 | (22a) |
The second term in Eq. 22 is the noise component due to FWM which can be obtained from Eq. 17 and 18. Since Bi and θpqr randomly changes which can be treated as Gaussian noise and we assume the mean value and variance of FWM noise is < ηF (m) > = 0.
Calculation of the photocurrent: At the receiver the photocurrent is proportional to the optical power and hence to |E |2,where E = E(m) or E(s). In practical applications it can be assumed that for large L distance exp (-αL) <<1. Hence in our simulation we have assumed a single fiber span without optical amplification and all other noises at the receiver are ignored (Inoue, 1992). This is true for high input powers and in this case the photocurrent at the detector is written from Eq. 22. where all the other noises are ignored. Thus we get
| (23) |
by squaring Eq. 17a and substituting in Eq. 23 we get approximated value as
| (23a) |
Substituting the value for P (m)FIM from Eq. 18 in the above equation we get
| (24) |
Similarly for the space current
| (25) |
using the Eq. 17b and 19 and substituting in the Eq. 25 we get is
 | (26) |
Variables Im and Is are related to the optical phases and to the value of optical bits (Hill et al., 1978).
STATISTICAL BEHAVIOUR OF PHOTOCURRENTS
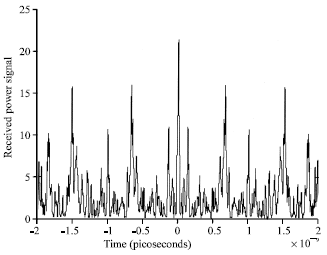
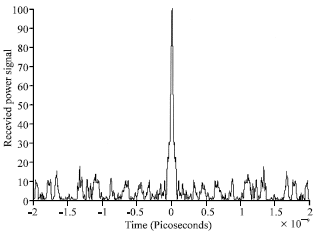
Eiselt (1999) has discussed the four wave mixing noise as the Gaussian as described in the above section and for the first time we have taken the random simulation to study about the nonguassian nature of FWM noise where in this section the pdfs of Im and Is are computed by Monte Carlo simulations. Where the FWM noise as Gaussian distribution discussed in the previous section. In Monte carlo simulation the mathematical formulation of C = Aebx and the value of A and b is calculated by random experiments for values of N = 16. The value of A is taken equal to the peak of the pdf of Im and is the same for Im> 0, Im< 0. Optical phases of all the channels is assumed to be uniformly distributed with in [0 2π] and the data bits are assumed to be in the mark and space states with equal probability P(Bi =0)=P(Bi = 1) = 0.5. Hence the statistics of Im and Is will depend only on the total number of channels N and on channel number n, which is assumed to be the central channel n we obtain the pdfs of these two variables through which the pdfs of S(m) and S(s) will be determined (Yevick, 2003). Ideally we have to extrapolate the results under the assumptions that the electrical voltage at the receiver after the narrowband filtering is distributed in a guassian shape in the mark state In this study we have performed a series of p MC experiments where p=1011for N=16 channels has been computed.
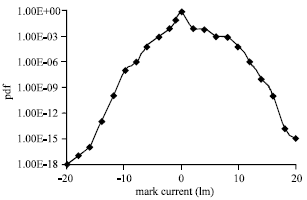 | |
| Fig. 6: | pdf of the mark space recived current |
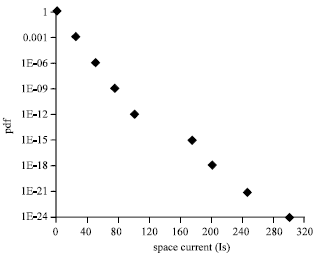 | |
| Fig. 7: | pdf of the space state received surent |
It is easily deduced that in all cases the pdf exhibits as almost exponential behaviour (Kamalakis and Spicopolous, 2003). Figure 6 shows the pdf of the mark state Im receiver current by the random experiments (Ronald and Curtis, 2003). In this research we have determined the probability density functions of Im and Is using the signal currents S(m) and S(s) by performing series of random experiments for N = 16 channels in our simulation (Kamalakis et al., 2004). Similarly Fig. 7 is plotted for the space current probability distribution function which is exponential decay and the FWM noise in the zero state (space) will be decaying for the random trial.
COMPARISON WITH OTHER MODELS
In this research we have found that the probability distribution of the mark space current is not Gaussian distribution and in the previous literatures it was found that the distribution is Gaussian and symmetrically exponent. In this research we have taken FWM noise alone and concluded that FWM noise in the mark state is asymmetric and hence the symmetrical approximation may prove inaccurate, although this approach might provide a first insight in to the implications of the FWM noise, its validity is examined because the assumption of Gaussian statistics is some what arbitrary and may not be valid in this case. In future we can incorporate other noises like Amplified spontaneous noise and thermal noise in our model.
RESULTS AND DISCUSSIONS
The main objective of this research is to determine the FWM noise in the receiver photocurrent of the DWDM multiplexed systems with N = 16 channels and has been found that the distribution is not symmetrically exponent or Gaussian as it was presented in the literatures by Song et al. (2000). In the earlier works the probability distribution function of the Mark state is obtained as the Gaussian response and for the first time we have arrived to the conclusion that the distribution of the Mark current is not Gaussian and in this study propagation of the fiber link has been simulated by solving the nonlinear Schrödinger equation and output has been displayed by keeping the maximum limit to the nonlinear shift which is related to the step size of the fiber link. In the second half of the paper the statistical behavior of the four wave mixing noise has been analyzed and an expression for the probability density function for the Mark state (one state) and Space state (zero state) of the detector current in the multi channel system is plotted separately. It is shown that by conducting random experiment the pdf in the mark state is asymmetric. It is also concluded that the assumption of the Gaussian statistics is somewhat arbitrary. Indeed FWM noise is the sum of large number of components that depends on one another.
CONCLUSIONS
In the first half of the study the Nonlinear Schrödinger equation is solved and the relation between nonlinear phase shift and the split step length is found out. It is observed that the pdf in the space state is distributed as exponential decay and in the mark sate it is distributed as asymmetrically double sided exponential decay.
REFERENCES
- Bosco, G., A. Carena, V. Curri, R. Gaudino, P. Poggiolini, and S. Benedetto, 2000. Suppression of spurious tones induced by the split step method in fiber simulation. IEEE Photonics Technol. Lett., 2: 489-491.
CrossRef - Eiselt, M., 1999. Limits on wdm systems due to Four wave mixing a statistical approach. J. Light Wave Technol., 7: 2261-2267.
CrossRef - Francia, C., 1999. Constant step-size analysis in numerical simulation for correctfour-wave-mixing power evaluation in optical fiber transmission systems. IEEE Photonics Technol. Lett., 11: 69-71.
CrossRefDirect Link - Hill, K.O., D.C. Johnson and B.S. Kawasaki, 1978. CW three wave mixing in single mode optical fibers. J. Applied Phys., 49: 5098-5106.
Direct Link - Inoue, K., 1992. Phase mismatching characteristic of four wave mixing in fiber lines with multistage optical amplifiers. Opt. Lett., 17: 801-803.
Direct Link - Inoue, K., K. Nakanishi, Koda and H. Tuba, 1994. Crosstalk and power penalty due to fiber four wave mixing in multi channel transmissions. J. Light Wave Technol., 12: 1423-1439.
CrossRef - Kamalakis, T. and T. Spicopolous, 2003. Asymptotic behaviour of inband crosstalk noise in wdm networks. IEEE Photonics Technol. Lett., 15: 476-478.
CrossRef - Song, S., C.T. Allen, K. Remarestand and R. Hui, 1999. Intensity dependent phase matching effects on four wave mixing in optical fibers. J. Light Wave Technol., 17: 2285-2290.
CrossRef - Yevick, D., 2003. Multicanonical evaluation of joint probability density functions in communication system modeling. IEEE Photonics Technol. Lett., 15: 1540-1542.
CrossRef