
T. Sathya
Post Harvest Technology Centre, Tamil Nadu Agricultural University, Coimbatore-641003, India
C. Sekar
Post Harvest Technology Centre, Tamil Nadu Agricultural University, Coimbatore-641003, India
Trends in Agricultural Economics
Year: 2012 | Volume: 5 | Issue: 2 | Page No.: 31-47


ABSTRACT
A study was conducted to analyze the direct and indirect benefits of Pitchavaram Mangrove Forests (PMF)in the south east coast region of Tamil Nadu, India, where the concentration of mangrove biosphere is substantial. For the study,30 numbers each of i. Fishermen and ii. Tourists were personally contacted. About 75% of the respondents depended mangrove area for fishing while coastal area was the source of fish catch for only 25% of sample respondents. Among the tourists respondents, only 3.3% were foreigners, 10% were from other states and the rest were domestic visitors. Most of tourists were young and middle aged and about 43% had a monthly income of Rs.15001 to 30000. It is understood that high income and educated people showed more interest in visiting places of natural origin. People who travelled by own vehicles had higher visitation rate of 50% than those travelling by hired vehicles owing to the high cost of hired vehicles. The principal products collected by local stakeholders were firewood, fodder and timber. The Individual Travel Cost Method (ITCM) was used to estimate the recreational value and the determinants of visitation rate. The marital status had a negative influence on visitation rate. It was found out that bachelors had made more frequent trips to PMF than the families. The monthly income was also significant and had the expected relationship. Travel cost had a significant influence on frequency of visits. The price elasticity of demand for recreational visit was estimated to be -0.1566. It indicated that the visitation rate was inelastic with respect to the travel cost i.e. one per cent increase in travel cost would result in only 0.1566% reduction in visitation rate. The option value of conserving the PMF was estimated using contingent valuation method using the bidding game technique. The fishermen were willingness to pay an amount of Rs.1763 towards internalizing externalities. The catchment area, monthly income and duration of fishing were positively related to Willingness To Pay (WTP) and were significant. It is implicit from the analysis that duration of fishing and fishing area (near mangrove) influenced the WTP significantly. Household expenditure of a fisherman had been positively related to the duration of fishing. The major findings of the regression results regarding the overall impact of PMF was that the people who entered into fishing and other mangrove dependent occupations had extensively improved their standard of living. The additional money generated from tourism by tourist dependents encouraged the households to incur more on luxurious goods. Positive externalities like shoreline protection, increased fish catch and enhanced income, utilization of non â-“timber forest products, control of soil erosion, water retention and purification of water by mangrove forests were the other environmental benefits. The study came out with the policy that the optimal exploitation of mangrove biosphere by the end users should be ensured by the enforcement authorities. Both the state and central institutions should protect the mangrove ecology and sea-shore through stringent adoption of regulatory mechanisms. The local institutions should also be empowered adequately to deal with the free-riders; so that the mangroves will be promoted on large scale since off-shore fishing has been the lifeline of the poor and marginalized fisher folk in coastal regions.
PDF Abstract XML References Citation
Received: August 04, 2011;
Accepted: October 16, 2011;
Published: January 14, 2012
How to cite this article
T. Sathya and C. Sekar, 2012. Mangrove Eco-system and their Multifunctionalities: An Analysis of the Provision of Economic and Environmental Livelihoods to the Fishermen Communities in the South-East Coast of India. Trends in Agricultural Economics, 5: 31-47.
DOI: 10.3923/tae.2012.31.47
URL: https://scialert.net/abstract/?doi=tae.2012.31.47
DOI: 10.3923/tae.2012.31.47
URL: https://scialert.net/abstract/?doi=tae.2012.31.47
INTRODUCTION
Wetlands are considered the most biologically diversified ecosystem. Wetlands are among the earth’s most productive ecosystems. Coastal ecosystems which are important part of the natural resource base in India, include several ecosystems like salt marshes, mangroves, coral reefs, sea grass etc. Of these, mangroves are particularly important in view of its pivotal role both from the ecological and economic points of view. Mangroves occurring along estuaries, backwaters and the deltas function as the most important links between the land and sea. Mangrove forests are estimated to cover an area of about 17 million hectares world over. The total area of mangroves in India is estimated to be 6,740 sq km and in Tamil Nadu, mangrove coverage is about 150 sq km at Pitchavaram and Muthupet areas.
Problem focus: The general cause of mangrove destruction and degradation has been due to the preference for short-term exploitation (immediate economic benefit) rather than long term and sustainable exploitation. Mangrove deforestation in general results in reduction in fish catch, degradation of clean water supplies and salinisation of coastal soils, erosion and land subsidence, as well as the release of carbon dioxide into the atmosphere. In fact, mangrove forests fix more carbon dioxide per unit area than any other phytoplankton. Mangrove forests once covered three fourth of the coastlines but today less than 50% remain and of this remaining forest, over 50% is degraded and not in good form. Hence, the degradation of coastal ecosystems has real and profound economic and social costs, not just in terms of losing shoreline protection services but also in terms of loss of livelihoods of local stakeholders, particularly fishermen. As such, coastal ecosystems provide products and services which yield both direct and indirect benefits to residents in coastal areas.
The continued decline of the forests is caused by conversion to agriculture, aquaculture, tourism, urban development and overexploitation. About 35% of mangroves were lost from 1980 to 2000 (MEA, 2005) and the forests have been declining at a faster rate than inland tropical forests and coral reefs (Duke et al., 2007). Relative sea-level rise could be the greatest threat to mangroves (Gilman et al., 2008). The sustainable, multi-functional use of an ecosystem is usually not only ecologically sound but also economically more beneficial, both to local communities and to society as a whole (Balmford et al., 2002). Thus, much effort has been expended to create awareness on the importance of integrating coastal wetland ecosystem restoration and rehabilitation.
Selvam et al. (2008) pointed out that the mangrove wetlands were prominent features of the coastal zone of tropical countries. A mangrove wetland had consisted of a mangrove forest and its associated water bodies. A mangrove forest harbours a group of plant species that grow well in the estuarine areas, where salinity undergoes constant changes due to freshwater flow and where the substratum was composed of accumulated deposits of river borne sediment. A mangrove forest was intersected by a number of tidal canals, channels and creeks and large open water bodies, where the water level varies daily due to tidal inflow and outflow, as well as seasonally due to freshwater discharge.
According to Duke et al. (2007) about 90% of the global mangroves are in developing countries and many are under the condition of critically endangered and nearing extinction in 26 countries. The world mangrove experts are of the opinion that the long term survival of mangroves is at great risk due to fragmentation of the habitats and that the services offered by the mangroves may likely to be totally lost within 100 years.
Amirnejad et al. (2006) determined the existence value of the north forests of Iran. They measured individual’s willingness to pay based on Contingent Valuation (CV) and dichotomous choice. A logit model was used and estimated using maximum likelihood technique. Results showed that 65.80% individuals were willing to pay for the existence of the forest, while about 20% individuals did not visit and 41% of them only visited once. The mean WTP for existence was US $ 2.51 per household in a month.
Turpie (2003) reported that WTP increased dramatically when respondents were faced with a predicted impact of climate change in biodiversity in the Fynbos Biome in South Africa. It was found to be a better estimate of the full existence value of biodiversity than simple WTP conservation, since respondents were faced with absolute losses. The study used a logit model with log transformed WTP as the independent variable. The ‘before change’ situation was assumed to reflect the option value and the after change WTP as the existence value of the biome.
Burke and Maidens (2004) pointed out that in addition to direct-use values, mangrove functions also indirectly supported economic activity-for example through nutrient recycling, water purification and flood control. One key indirect value was the protective function of coastal ecosystems against wave and storm energy, both in terms of ongoing coastal erosion and from potentially destructive cyclones or typhoons. However, decision-makers often undervalue these shoreline protection services.
Suthawan (2003) reported that the indirect use value was determined by the contribution of resources in terms of their environmental and ecological services to support current production and consumption. One important ecological service of mangroves was the support to off-shore fisheries by serving as a nursery ground. Even though reduced production of off-shore fisheries had normally attributed to overfishing (the off-shore area was generally subject to open access), the situation worsened as a result of the decrease in mangrove areas.
From the foregoing analysis, it is apparent that mangroves occupy a pride of place in the day-to-day life of the communities, particularly for the people living close to coastal ecosystem. Among the various stake holders, the fishermen derive lots of direct and indirect benefits from the mangroves. Even though number of studies have been undertaken in different areas of the globe to estimate the present level of benefits enjoyed by the local stakeholders, not much work has been done to understand the status and the economic and ecological impacts of wetland biodiversity particularly with respect to the mangrove ecosystem in India in general and in Tamil Nadu state in particular. Hence, an effort was made in the present study to analyze the costs and benefits of mangrove ecosystems in the east coast region of Tamil Nadu, where the concentration of mangrove biosphere is substantial.
The overall objective of the study was to understand the relationship between mangrove ecosystem and the livelihood security of the fisherman as well as to estimate the economic and environmental benefits of mangrove ecosystem to the fishermen communities. The specific objectives of the study are:
| • | To analyze the direct and indirect use values of mangrove ecosystem |
| • | To study the impact of mangroves on the livelihood security of the fisher man and |
| • | To assess the stakeholders’ attitude and WTP (Willingness To Pay) towards the conservation of mangrove ecosystem |
MATERIALS AND METHODS
Pichavaram the second largest mangrove forest in the world, located near the temple town of Chidambaram in the State of Tamilnadu is one of the unique eco-tourism spots in South India. Pichavaram is situated in the southeast coast of India in the Tamil Nadu State. It is located at about 225 km south of Chennai, the capital city of Tamilnadu state and about 5 km north east of Chidambaram, Cuddalore district, Tamil Nadu, between latitude 11°20' to 11°30' North and longitudes 79°45' to 79°55' East. It is an estuarine mangrove situated at the confluence of Uppanar, a tributary of the Coleroon River. Fishing villages, croplands and aquaculture ponds surround the area. Flora and fauna of mangrove ecosystem are presented in Fig. 1.
Two major rivers viz. Vellar and Coleroon drain into the Bay of Bengal in this area. The area between the two rivers has brackish water with mangrove vegetation. The area is covered by alluvium in the western part and fluvial marine and beach sands on the eastern part. Based on the available satellite data IRS 1C LISS-III of 1998, the Pichavaram Mangrove wetland has been demarcated into three zones viz., Agriculture zone, Wetland zone with vegetation and Non-Vegetation wetland. The map of Tamil Nadu and Pichvaram forest area are presented in Fig. 2 and 3, respectively.
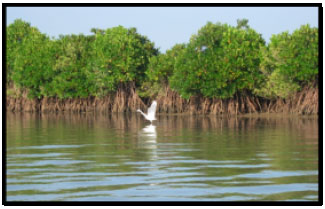 | |
| Fig. 1: | Flora and fauna of mangrove ecosystem |
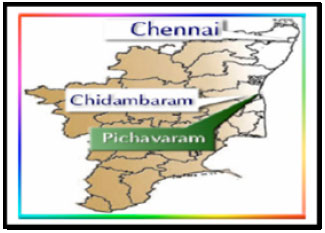 | |
| Fig. 2: | Map of Tamil Nadu State |
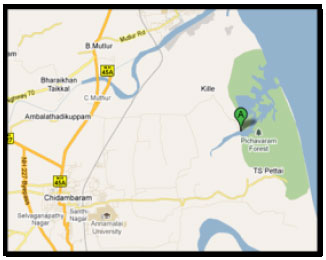 | |
| Fig. 3: | Map of Pichvaram forest area |
Sampling design: Data were collected from Fishermen and Tourists visiting the Pichavaram Mangrove Forest (PMF). Purposive random sampling technique was employed in selecting two different groups of respondents based on the nature of usage of wetland ecosystem (mangrove ecosystem). There were 30 fisher folks, who were generating more than 50% of income through fishing activity. The respondents were selected purposively from the fringe areas viz., Killai, Pichavaram, Thandavarayan Sozhagan Pettai (T.S.Pettai) and Thillaividangan villages. Besides the above samples, a random sample of 30 exclusive tourists, visiting the Pichavaram bioreserve was also selected for accessing the recreational value of the Pichavaram Mangroves. Respondents below the age of 18 years were not interviewed for obvious reasons. Thus a total of 60 respondents were considered for the study. The reference year for the study was the calendar year 2010.
Data analysis: A semi-log linear model was chosen to estimate the consumer surplus for an individual making visits to the site. In case of a linear form it was given by Consumer Surplus (CS) = Frequency of visit per annum divided by travel cost per visit. The consumer surplus in case of semi log-linear function implies a finite number of visits at a zero cost and never predict negative visits, even at a high cost. Having tried various functional forms, it was decided that the linear functional form would be the best fit for the data.
The model used for the present study was of the following form:
FOVPA (Y) = f {AGE, GND, MST, EDU, INC, LTC, MOST, DST} |
| Where: | ||
| FOVPA (Y) | = | The quantity of recreational occasions demanded by the ith visitor per year (Frequency of visit per annum). |
| Independent variables | |
 |
Multiple-linear regression model for fisherman:
HHEXPND = f {AGE, GND, EDU, HHSIZE, INC, LAND, LVSTOCK, TIME, AREA} |
| Where: | ||
| HHEXPND | = | The household expenditure in terms of rupees per month. |
| Independent variables | |
 |
Bidding game technique: The respondent was asked whether he/she was willing to pay a given amount of money for a change in the provision of additional mangrove ecosystem services. If he/she refused, the proposed amount was reduced by a given percentage. The procedure was repeated until the respondent provided a positive answer. The ultimate amount proposed was taken as his/her maximum WTP for obtaining the environmental improvement of Pichavaram Mangrove Forest (PMF). If the individual accepted the proposed amount, it was increased by given percentage. The procedure continued until the individual answered negatively and the penultimate amount was taken as maximum WTP.
Multiple-linear regression model for fisherman: The model adopted for estimation of WTP of fisherman and fisherman cum farmer was described below:
WTP= f {AGE, GND, EDU, HHSIZE, MST, INC, LAND, LVSTK, TIME, AREA} |
| Where: | ||
| WTP | = | Willingness of the visitors to pay for conservation of PMF in rupees. |
| Independent Variables | |
 |
The dependent variable in the model was the actual amount stated by the respondent as his/her WTP. The independent variables considered were age, gender, marital status, education, monthly income, land, livestock, time and area of fishing. Ordinary least square method was employed to estimate the co-efficient. A linear function form was used for estimation.
Garrett’s ranking technique: Garrett’s ranking technique was employed to understand the positive externalities enjoyed by the local people attached to various functions the PMF had been performing. The respondents were asked to rank the given functions, considered most important. The orders of merit given by the respondents were converted into ranks using the following formula:
| Where: | ||
| Rij | = | Rank given for ith factor by jth individual |
| Nj | = | Number of factors ranked by the jth individual |
The percent position of each rank, were converted into scores by referring the table. The mean score values were arrived for each factor and the factors were arranged in the order of their mean score value.
RESULTS AND DISCUSSION
Socio-economic characteristics of fisherman: The overall age distribution showed the dominance of middle age groups who would readily accept the issues related to the conservation of natural resources and protection of biodiversity. Literacy level of fisherman was very low and more than 50% were illiterates. A vast majority of the respondents (about 42%) earned between Rs.3001 to Rs.6000 a month and only seven per cent of them earned greater than Rs. 8000 a month.
Distribution of respondents based on fishing area: Fishing area was classified in to Mangrove area and Coastal area. In mangrove area (mangrove swamps) water has more salinity than fresh water but not as much as seawater. It may result from mixing of seawater with fresh water, as in estuaries or it may occur in brackish fossil aquifers. Coastal area is where the sea extends into major bays but not into channels, creeks, rivers, estuaries and lagoons and mangrove growth were found only in shoreline but not in deep sea. Among the respondents, 75% of them, depended mangrove area for fishing while coastal area was the source of fish catch for only 25% of sample respondents. Hence, it is obvious that majority of the respondents depended on mangrove forest area for their livelihood sustenance.
Socio-economic profile of the tourists: Among the tourists respondents, about three percent were foreigners, 10% were from other states and the rest were only domestic visitors. The flow of tourist was regular and maximum during the months of April and May. It is understood that majority of the tourists were middle aged and only 10% were elderly people. Among the visitors, about 43% were graduates and professional degree holders were 40%. Tourists also included students, Government employees, the businessmen, non-working home executives and retired persons. Majority of tourists were employees of private firms and college students had been visiting the PMF in groups of four to eight members, particularly during weekends. About 43% had a monthly income of Rs.15000 to 30000. It is understood that high income and educated people showed more interest in visiting places of natural origin.
About 50% of the tourists used own vehicles for logistics and the remaining used either hired vehicles (30%) or used the public transport services (20%). People who travelled by own vehicles had a higher visitation rate of 50% than those traveling by hired vehicles owing to convenience and cost economy. Nearly 70% of tourists visited the PMF during forenoon, particularly during weekends; so that they could spent more time than visiting during week days and in the evening.
More than 40% of the respondents were first time visitors, 30% were on their second visit to the mangrove forest and about 27% had already visited the place more than twice (i.e., Frequent visitors). The number of visit increased with shorter travel distance. People from nearby areas tended to visit the mangrove forest more often than those living far away. People had a propensity to repeat visit when they incur lower costs per trip.
Occupational structure of the tourists: It is interesting to note that people with different occupational structure visited the PMF. About 23% of the visitors were professionals like doctors and engineers. Employees in private firms and students comprised 20% each and about 17% were in Government service.
Tourists also included the businessmen, non-working home makers, retired persons and others. Private firm employees mainly from Chidambaram and Pudhuchery areas were large in large numbers because the reserve was easily accessible to them due to its proximity. This place is emerging as a tourist attraction of South India in recent times. The occupational details of the tourists are presented in Fig. 4.
Travel mode of tourists: Details of mode of travel used by the visitors and the number of days they preferred to stay expressed their interests in visiting the mangroves. People travelled by owned vehicle were 50% and the rest of them used either a hired vehicle (30%) or used the public logistical services (20%).
About 50% of the respondents preferred own vehicle to visit PMF due to convenience, minimizing the travel time etc. Respondents, who did not own vehicle, preferred hired vehicles and public utilities. Hired vehicles gave opportunity to the tourists to visit PMF at any time while the public transport was available only at specific time.
 | |
| Fig. 4: | Occupational Structure of Respondents |
 | |
| Fig. 5: | Mode of Travel by Tourist Respondents |
Though the public transport was the cheapest mode, people preferred hired vehicle due to the specific time schedule of public transport as well as owing to convenience and high opportunity cost of time (Fig. 5).
People who travelled by own vehicles had a higher visitation rate of 50% than those traveling by hired vehicles owing to the high cost of hired vehicles.
Nearly 70% of tourists visited the place during morning since they can spend more time than visiting in the evening. Only 10% preferred to stay at least one day. Foreign tourists were more interested to stay for a day or more.
Visitation behavior of the tourists: More than 40% of the respondents were first time visitors, 30% were on their second visit to the mangrove forest and about 27% had already visited the place more than twice (i.e., Frequent visitors). Average age, distance travelled, travel cost and monthly income of respondents were compared among first time visitors, two time visitors and frequent visitors. The average age of single, two-time and frequent visitors was 35, 31 and 29 years, respectively. The socio economic characteristics of the tourists are presented in Table 1.
Average distance travelled for the single, two time and frequent visits were 402, 180 and 110 km, respectively. The number of visits increased with shorter travel distance. People from nearby areas tended to visit the mangrove forest more often than those living far away.
The average travel cost for the single, two times and frequent visitors were Rs. 1560, Rs. 758 and Rs. 252, respectively. People tended to repeat visit when they spent lower costs per trip.
| Table 1: | Visitation behavior of tourists |
 | |
| *Figures in parentheses represent percentage to total | |
| Table 2: | Frequency of visits to forest |
 | |
| Table 3: | Quantity of forest products collected by fisherman |
 | |
| *Values in parentheses represent percentage to total. **On a single day, often more than one collection had been performed by some of the user groups | |
Direct use value: The fishermen dwelling near the PMF area visit the mangrove forest ecosystem regularly. They used to collect and consume various mangrove forest products accumulating direct use value. The frequency of visit made by fisherman is reported in Table 2. Fishermen visit the mangrove forests more than twice a week to collect fire woods, fodder and other minor mangrove products. Majority of fisherman (33%) used to undertake five visits in a week to collect firewood, fodder and grazing animals etc.
The minimum number of visits by fisherman to the mangroves was thrice a week. The principal produces collected were firewood, fodder and timber for their own use and occasionally they used to collect medicinal plants and that too for self consumption. Women, most of them home makers, used to make visits to PMF for collection during the morning and afternoon hours. Apart from collection of products, the fishermen enjoyed grazing their livestock in the mangrove wetland eco-system.
Produce collected by fisherman households: The households dwelling in the mangrove wetland area depended on the mangrove eco-system for several resources. The products collected by the fishermen are detailed in Table 3. Most of the fishermen households depended on the forest for firewood and fodder for animals. Firewood and fodder were estimated as quantities collected per year since the collection was regular. The weight of firewood head loads varied between 12 to 20 kg with an average weight of 16 kg per head load. The average collection of firewood per household was 7.90 kg in a day since it was one of the sources of energy. The collection depended on the family size.
| Table 4: | Possession of cattle and grazing pattern |
 | |
| Table 5: | Estimated results of semi-log linear regression equation |
 | |
| *Significant at ten percent level, **Significant at five percent level, ***Significant at one percent level | |
The larger the size, greater had been the use and thus the collection of firewood. Women collected firewood at least twice a week and in some cases they collected firewood daily. Almost 80% of households collected fodder for animals. An average collection of fodder was 9.60 kg per household per day. About 17% of the households collected timber to build shelters for their own dwelling as also to shelter livestock.
Grazing benefits: Grazing was yet another important mangrove resource usage that people acquired from PMF. The number of livestock per household was three.
It could be understood from Table 4 that 21 households owned livestock and the average grazing hours was estimated to be 21. It was reported that the average minimum daily requirement of green fodder per cattle was 15 kg. It was realized that almost all cattle were milking and about 25% were calves. Fodder requirement for calves were 75% of adult requirement. From this available information the annual fodder requirement per cattle was estimated to 5475 kg and for calf it was 4106 kg.
Recreational value: A semi-log functional form was used in this study to estimate the recreational value of PMF. Because of the dependent variable consists mostly of low values, the logarithm of the dependent variable helps to adjust its skewed to normal distribution.
Individual travel cost model: A semi-log functional form (i.e., log-lin) of Individual Travel Cost Model (ITCM) was used in this study to estimate the recreational value and the determinants of visitation rate. Number of visits per year was the dependent variable. Age, gender, marital status, education, income, travel distance, mode of travel and travel cost were used as independent variables. The results of the analysis are presented in Table 5.
It is obvious from the Table 5 that young and educated people made frequent visits to mangrove wetland eco-system than adults.
| Table 6: | Mean value of the important independent variables of the model |
 | |
The marital status had a negative influence on visitation rate indicating that bachelors had made more frequent trips to PMF than the families, since families had to make all necessary arrangements in advance and the preference of children in choosing the tourists site was also the most dominant and deciding factor among other things. But on many occasions children have less knowledge and information on the importance of such valuable resources.
The variables viz., education, travel cost were significant at one per cent level and exhibited the expected signs, while the variables age, marital status were significant at five per cent level. The monthly income was significant at ten per cent level and had the expected relationship. As indicated clearly, education had a significant and positive influence on number of visits; higher the level of education, greater the number of visits. It is a matter of fact that the educated people understand the significance of the eco-system services and their importance and hence tended to visit such places and enjoy the onsite and off-site benefits. The mean value of independent variables results are presented in Table 6.
Awareness was less for the people with lower levels of education. The travel mode indicated that people who owned or hired a vehicle had higher visitation frequency than those who depended on public transport for logistical services. Personal vehicles were preferred to public transport system, owing to their convenience and flexibility in scheduling the programme. Travel cost had a significant influence on frequency of visits. The negative sign is consistent with the theoretical concepts of an inverse relationship between travel cost and visitation rate. People who earned more used to spend more, every trip they made but did not make more frequent visits. Costs of travel was composed of both out of pocket costs and opportunity cost of making the recreational trip (time). Opportunity cost of the trip was the foregone income. Higher the opportunity cost, lower would be the time spent in the absence to work.
Elasticity of travel cost: The price elasticity of travel cost was estimated through the given regression result. The elasticity was derived by using the following formula:
The price elasticity of demand for recreational visit was estimated to be -0.1566. It indicated that the visitation rate was inelastic with respect to the travel cost; one percent increase in travel cost would result in only 0.1566% reduction in visitation rate. It emphasized the fact that though the travel cost was a deciding factor in finalizing the number of visits, the non price determinants like age, education, marital status and income also had considerable influence on visitation rate.
WTP for internalizing externalities: The opinion of respondents was sought to know about their willingness to pay for internalizing externalities and the outcome is shown in Fig. 6. It could be observed that 40% of fishermen were ready to pay between Rs. 500 to Rs. 1000 per annum.
 | |
| Fig. 6: | Fisherman’s WTP |
| Table 7: | Average willingness to pay |
| Table 8: | Reason for WTP |
 | |
| *Values in parentheses represent percentage to total | |
| Table 9: | Mode of payment for WTP |
 | |
Average willingness to pay: The average willingness to pay of the fisher folk was estimated to be Rs.1763/annum, towards internalizing externalities (Table 7).
Reason for WTP of local stakeholders: The respondents were asked to indicate the reasons for their WTP for the conservation of the PMF and the results obtained are presented in the Table 8. A set of reasons were presented based on the a priori knowledge to the respondents to choose from and an option to indicate if the respondents had a different reason other than those indicated. Majority of the respondents (50%) expressed that the conservation of mangrove forest was good for them and to the society at large for future generation. About 20% were of the opinion that the indicated amount was reasonable and another 20% of respondents concerned about the biodiversity and hence they are willing to contribute.
Mode of payment of WTP: It is obvious from the Table 9 that for about 60% of the respondents, the mode of payment was cash and only the remaining preferred to share through kind.
Frequency of payment: One could understand from the Table 10 the frequency of payment of the respondents. A little over 33% of the respondents were willing to pay in two installments while 20% preferred quarterly payment.
| Table 10: | Frequency of payment |
 | |
| Table 11: | Factors influencing the WTP of fisherman |
 | |
| * Significant at ten percent level, ** Significant at five percent level, *** Significant at one percent level | |
Factors influencing the WTP of the fisherman: The various factors influencing WTP were determined using a linear relation between the WTP amount and socio economic characteristics of fisherman. The statistical properties of the linear functional form of the resulting estimators are easier to determine hence linear regression form was used. The results are reported in the Table 11.
The respondent’s catchment area, monthly income and duration of fishing were positively related to WTP and were significant. It is implicit from the analysis that long duration of fishing and fishing area (near mangrove) of the respondents influenced the willing to pay significantly. Higher the income, higher was the WTP, People earning more tended to pay more towards a cause of conservation. The family size of respondents was significant and negatively related to WTP. It revealed that higher the family size of the respondents, less would be the WTP of the respondents.
Household welfare: The household welfare attributes were analyzed and the details are reported in Table 12. The distribution of households across Monthly Per-Capita Consumption Expenditure (MPCE) class showed the average value of Rs. 853 for fisherman in PMF.
The household expenditure in general depended on variables like age, sex, education, household size, monthly income, livestock population, duration of fishing and area of fishing. The equation for the components of expenditure was estimated as a multiple linear regression model. From the regression results presented in Table 13, it could be noted that there had been an increase in household expenditure with respect to enhancement in monthly income, livestock population, duration of fishing and fishing near the mangrove forest.
| Table 12: | Household’s welfare attributes |
 | |
| Table 13: | Regression result for fisherman |
 | |
| * Significant at ten percent level, ** Significant at five percent level, *** Significant at one percent level | |
The regression results indicated that the household size, monthly income, duration of fishing and area of fishing were highly significant. The variables time and area showed a significant and positive impacts on household expenditure and therefore higher duration of fishing time (Fish catch is the positive function of fishing time) and fishing near the mangrove area appeared to forward household’s expenditure. The negative co-efficient in the family size indicated that greater the family size lower would be the level of household consumption expenditure. Positive co-efficient of income indicated that people earning more would be prepared to pay more towards consumption of food and non food items.
Economic environmental benefits: The major findings of the regression results regarding the overall impact of PMF was that the people who entered into fishing and other mangrove dependent occupations had extensively improved their standard of living. The additional money generated from tourism by tourist dependents encouraged the households to consume more and spend more on luxurious items.
| Table 14: | Positive externalities of PMF |
 | |
| NTFP: Non timber forest products | |
They had also enhanced their expenditure on non-food items proportionately more than food items.
Garrett’s ranking technique was employed to understand the positive externalities enjoyed by the fishermen attached to various functions, the PMF had been performing. The respondents were asked to rank the given functions, considered most important. A set five important benefits derived from mangrove forests by fisherman and fisherman cum farmer was presented to them with a brief description of each function. They were asked to rank the benefit based on the importance, from individual’s perspective and the rankings obtained are presented in Table 14.
The performance of shoreline protection such as protection from storm, tsunami and flood by mangrove forest scored a mean value of 72 and ranked first. Next to that increased income due to increased fish catch was ranked. Utilization of non timber forest products ranked third followed by control of soil erosion and water retention and purification.
CONCLUSIONS
The results have clearly shown that the educated, young and high income groups made fewer visits to PMF. People from nearby areas tended to visit the PMF more often. Marital status, travel cost and distance had a negative influence on the frequency of visit to PMF. Respondents involved in the fishing activity were willing to pay more for conserving mangrove eco-system. Mangrove encapsulated seashore was the main source of fishing activity for fisherman. Grazing was one of the important resources for the people owning livestock in the PMF. Education positively influenced the people’s income level and it was estimated that the fisherman were used to spend more on consumption of food and non-food items. The people who entered into fishing occupations had extensively improved their standard of living. Positive externalities like shoreline protection, increased fish catch, enhanced income, utilization of non timber forest products control of soil erosion, water retention and purification were the benefits realized from mangrove forests by fisherman.
POLICY PRESCRIPTION
The following policy prescription could be suggested from the findings of the study:
| • | The increasing dependence of mangrove ecosystem by the fisher folk underlines the need to protect this vital wetland ecosystem for providing a better livelihood opportunity to them |
| • | The optimal exploitation of mangrove biosphere by the end users fishermen should be ensured by the enforcement authorities for the sustainable use of mangroves |
| • | Since the flow of tourist to PMF has been on the raise during the recent years, the local institutions should provide adequate facilities to the visitors for enhancing the visitation rate. By doing so more people would be attracted towards PMF and the economic and ecological prospects of the mangrove wetland ecosystem could be popularized among the various sections of the society |
| • | An important ecological function of mangrove ecosystem is to support off-shore fisheries as a breeding ground. Hence the mangroves should be promoted on large scale service off-shore fishing has been the lifeline of the poor and marginalized fisher folk to take out a descent living |
REFERENCES
- Balmford, A., A. Bruner, P. Cooper, R. Costanza and S. Farber et al., 2002. Economic reasons for conserving wild nature. J. Sci., 297: 950-953.
CrossRef - Amirnejad, H., S. Khalilian, M.H. Assareh and M. Ahmadian, 2006. Estimating the existence value of North Forests of Iran by using a contingent valuation method. Ecol. Econ., 58: 665-675.
CrossRef - Duke, N.C., O.J. Meynecke, S. Dittmann, A.M. Ellison and K. Anger et al., 2007. A world without mangroves? Science 317: 41-42.
PubMed - Gilman, E., J. Ellison, N.C. Duke and C. Field, 2008. Threats to mangroves from climate change and adaptation options: A review. Aquat. Bot., 89: 237-250.
Direct Link - Turpie, J.K., 2003. The existence value of biodiversity in South Africa: How interest, experience, knowledge, income and perceived level of threat local willingness to pay. J. Ecol. Econ., 46: 199-216.
CrossRef