
H. Emari
Islamic Azad University, Bonab Branch, East Azarbaijan, Iran
S. Iranzadeh
Islamic Azad University, Tabriz Branch, East Azarbaijan, Iran
S. Bakhshayesh
Islamic Azad University, Bonab Branch, East Azarbaijan, Iran
Trends in Applied Sciences Research
Year: 2011 | Volume: 6 | Issue: 1 | Page No.: 57-64


ABSTRACT
The main objective of this research was to determine the dimensions of service quality in the banking industry of Iran. For this purpose, The study empirically examined the European perspective (i.e., Gronroos’s model) suggesting that service quality consists of three dimensions, technical, functional and image. This research is an applied research and its strategy is casual strategy. A standard questionnaire was used for collecting the data. Two hundred and eighty seven customers of Pasargad Bank of Northwest were selected through cluster sampling and were studied. The results from a banking service sample revealed that the overall service quality is influenced more by a consumer’s perception of technical quality than functional quality. So, the Gronroos model is a more appropriate representation of service quality than the American perspective with its limited concentration on the dimension of functional quality in the banking industry of Iran. So, knowing the key dimensions of the quality of services in this industry and planning for their improvement can increase the satisfaction of customers and productivity of this industry.
PDF Abstract XML References Citation
How to cite this article
H. Emari, S. Iranzadeh and S. Bakhshayesh, 2011. Determining the Dimensions of Service Quality in Banking Industry: Examining the Gronroos’s Model in Iran. Trends in Applied Sciences Research, 6: 57-64.
URL: https://scialert.net/abstract/?doi=tasr.2011.57.64
URL: https://scialert.net/abstract/?doi=tasr.2011.57.64
INTRODUCTION
The economic share of services currently accounts for more than half the sum of all GNPs worldwide (Akan, 2005). In today’s market place, many service companies need to mobilize their internal energies in order to meet the challenges of a changing environment. One of these challenges includes customers demands as the quality of service improves (Wong and Sohal, 2002).
Service quality is increasingly becoming a major strategic variable (Robledo, 2001; Terziovski and Dean, 1998). And This construct has received increased scrutiny during the last few decades (Svensson, 2004).
In the 1980, large organizations became more interested in the development of service quality measures (Dedeke, 2003). Much of the research has focused on measuring service quality using the SERVQUAL instrument (Kang, 2006; Ladhair, 2008).While, the SERVQUAL technique has attracted a lot of attention for its conceptualization of quality measurement issues, it has also attracted criticism (O’Neill et al., 1998). One criticism of SERVQUAL has been the point that the instrument mainly focuses on the service delivery process.
That is, while the contemporary studies on service quality seemingly focused on the process of service delivery, additional aspects to be considered have already been suggested, especially by European scholars (Kang and James, 2004).
For example, Gronroos noted that the quality of a service as perceived by customers has three dimensions: functional (or process) dimension, technical (or outcome) dimension and image (Kang and James, 2004).
Thus, the European perspective versus American perspective suggests that service quality considers two more components, technical quality and image. No efforts have been made to test the European perspective to determine the dimensions of services quality in banking industry of Iran. The purpose of this study is to extend our understanding of service quality by empirically examining the conceptualization of service quality suggested in the European perspective (i.e., Gronroos’s model) (Kang and James, 2004).
Service quality: Researchers have tried to develop conceptual models to explain the service quality and to measure consumers perceived service quality in different industries (Seth et al., 2005).
A good operational example of a standardized framework for understanding service quality is the SERVQUAL instrument developed by Parasuraman. The researchers discovered five general dimensions with focus group interviews which they labeled: Areliability, Aresponsiveness, Atangibles, Aassurance and Aempathy (Wong and Sohal, 2002).
Service quality is an important factor for success in the banking sector.Thus, some bank managers emphasize the various dimensions of service quality (Glaveli et al., 2006).
Bahia and Nantel consequently developed a specific new scale for perceived service quality in retail banking. This Bank Service Quality (BSQ) model is an extension of the original 10 dimensions of the model of Parasuraman. In addition, Bahia and Nantel incorporated additional items such as courtesy and access, as proposed by Carman and items representing the marketing mix of the A7Ps (product/service, place, process, participants, physical surroundings, price and promotion) from the Boom and Bitner framework (Petridou et al., 2007).
Aldlaigan and Buttle have developed and validated a new 21 item scale that describes customers service quality perceptions comprising four dimensions: service system quality, behavioral service quality, service transactional accuracy and machine service quality (Petridou et al., 2007).
In comparing BSQ with SERVQUAL, Bahia and Nantel argued that the main advantage of BSQ for banks is related to its content validity. For example, the services portfolio dimension and the price dimension of BSQ are absent from SERVQUAL (Petridou et al., 2007).
The current study doesn’t emphasis the various dimensions of service quality and assesses a Gronroos’s comprehensive three-dimensional model in the banking industry of Iran.
The research model: Over 20 years ago, Gronroos first proposed that customers overall evaluations of service quality were a result of their assessment of two dimensions, which he termed functional and technical service quality. He proposed that customers compared their expectations to their experience of service quality in forming their judgment (Gronroos, 1984) and defined service quality as follows: (Fig. 1).
The Gronroos’s model proposes that service quality consists of technical and functional dimensions and that a service organization’s image functions as a filter in the perception of service quality (Gronroos, 1994). The model also proposes that there are direct relationships between service quality perception and the technical and functional quality dimensions, in addition to the indirect effects of technical and functional quality on service quality perception. Finally, the model suggests that service quality leads to customer satisfaction (Kang and James, 2004).
The research model was tested using a structural equation modeling approach. LISREL 8.52 was used to estimate the parameters and assess the fit of the model (Fig. 2).
The LISREL methodology development started in 1970, when Karl Joreskog presented a first LISREL model at a conference. The first generally, available LISREL program was published in 1975. The name LISREL is an acronym for Linear Structural Relations. The qualifier linear is to restrictive for the current version of the LISREL program, but the name LISREL has become synonymous with structural equation modeling or SEM.
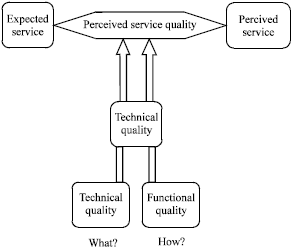 | |
| Fig. 1: | Gronroos's service quality model (Gronroos, 1984) |
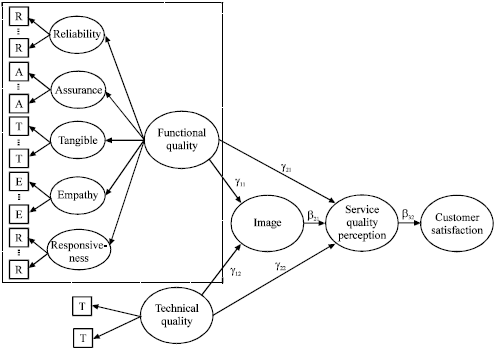 | |
| Fig. 2: | Research model |
Since, there are two approaches available in the structural equation modeling approach, it would be necessary to address each approach and the one that the study employs. In this research, all responses about questions utilized an appropriate Likert scale and a path analysis with latent variables-the common factor of the sets of item-scores was used.
MATERIALS AND METHODS
This study is an applied research and its strategy is casual. The statistical society of the research included the customers of Pasargad Bank of Northwest who had current accounts at this bank. Banking users were selected as participants because banking service is considered to have an experience property whose technical quality is easily discernible by consumers. Nineteen male undergraduate students were trained for the data collection. Two hundred and eighty seven customers of this bank (Bank A:119, Bank B:90, Bank C:69) were selected through cluster sampling and were studied. The sample consisted of 150 men and 128 women.
Instruments: For each of the constructs in our model we adapted multi-item measurement scales that had been empirically tested in the service marketing context. The scales were designed in English for different industries and then were translated (back translation) into Farsi by two Iranian translators. Ultimately, all scales were reworded to better suit the service marketing context and were evaluated during the pre-test.
Functional quality: The modified SERVQUAL scale was used to measure functional quality. Because it has been argued that modifications to the SERVQUAL scale might be required to reflect a particular industry specific characteristic, separate interviews were held with the managers and staff of Pasargad Banks. The interviews provided valuable insights into the special tasks and service areas of the banking business and resulted in the development of 26 items related to the five service dimensions of the original SERVQUAL scale (Eda et al., 2005). All responses about questions utilized an appropriate Likert scale from 1 to 5.
Technical quality: Banking service users should be able to easily discern the service outcome. In-depth interviews with banking users and service providers were conducted to generate items to assess technical quality in the current study. Three items developed by the researchers were measured using Likert scale from 1 to 5.
Image: Separate interviews with the managers and marketers of Pasargad Banks at the time of the data collection suggested that rating a brand image would be more appropriate than measuring the company’s overall or product image in banking industry of Iran. The measures for organizational image were developed specifically for this study by the researchers.
This study defines brand image as a subjective, perceptual phenomenon of brand that is reflected by a network of associations in the memory of the consumers. Four items based on the work of Roth were developed for this study. These items contain two factors: functional/ sensory and social image (Chang and Chieng, 2006). Each item was measured using a Likert scale from 1 to 5.
Overall service quality: The users were asked to rate the overall service quality of their current banking service provider using a Likert scale from 1 to 5.
| Table 1: | Reliability and validity test |
 | |
Customer satisfaction: Much research has stressed the positive relationship between service quality and customer satisfaction. According to Berry, service has become a powerful and competitive weapon for a company in achieving customer satisfaction (Lu and Seock, 2008).
Customer satisfaction was measured using a scale developed by Oliver and Swan (Burns and Neisner, 2006). The scale was necessary to modify the items to relate to banking service. All responses about questions utilized an appropriate Likert scale from 1 to 5.
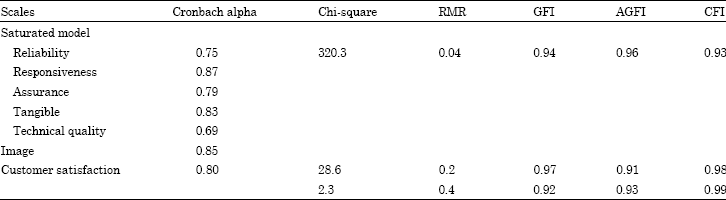
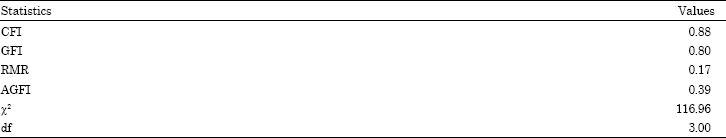
Validity test: Confirmatory Factor Analysis (CFA) was utilized to verify the construct validity of scales (Kang et al., 2002). In order to have a valid construct, all scales must be congener (i.e., measure one and only one latent construct) even though the latent constructs themselves may be inter-correlated. The psychometric properties of each construct were evaluated in separate confirmatory factor models using LISREL 8.5. The model fit for each CFA was evaluated using the Bentler’s Comparative Fit Index (CFI), the Goodness-of Fit Index (GFI) and Adjusted Goodness of Fit Index (AGFI). The root-mean-square residual (RMR) and the chi-square values were also reported as references for model fit (Albright and Park, 2009).
Reliability test: Reliability is the extent to which a measure is free from variable errors (Keating et al., 2003). For the purposes of this study, the internal consistency method is used. The internal consistency method assesses the Cronbach alpha statistics. Notably, Nunnally and Bernstein suggested that 0.7 should be used as the cut off point for reliability with items that did not significantly contribute to the reliability (item to total coefficient alpha 0.5) being deleted for the purpose of parsimony (Chang and Chieng, 2006). As a result, 40 items were retained for five variables in this research. Table 1 shows the outcome of validity and reliability test.
RESULTS
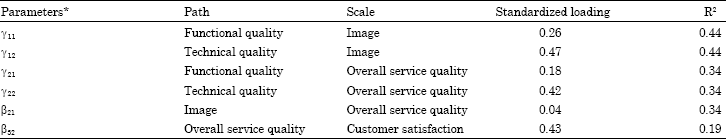
The final model (standardized path coefficient) is shown in Fig. 3.The model was defined by 40 items that identified the five factors in the banking industry of Iran, respectively the covariance matrix among the variables was used to test the model. The results of the LISREL estimation of the structural model are summarized in Table 2.
Goodness-of-fit statistics summarized in Table 3. These statistics, indicating the overall acceptability of the structural model analyzed. A large class of omnibus tests exists for assessing how well the model matches the observed data. The model fit was evaluated using CFI, GFI, AGFI, RMR and the chi-square values (Albright and Park, 2009).
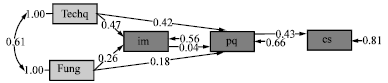 | |
| Fig. 3: | Validated structure model. χ2 value = 95.41 df = 3, p-value = 0.000, RMSEA = 0.335 |
| Table 2: | The results of structural equation model testing |
 | |
| *All significant , FQ: Functional quality, TQ: Technical quality , IM: Image , PQ: Overall service quality, CS: Customer satisfaction | |
| Table 3: | Goodness-of-fit statistics |
 | |
The important finding was that all of the causal relationships among functional quality, technical quality, image, perceived quality and customer satisfaction are significant in the banking industry of Iran.
The path coefficients for the full model are reported in Table 2. All path coefficients are positive and significant. The result shows a positive relationship between functional quality and image (γ11 = 0.26) and technical quality and image (γ12 = 0.47). The direct relationship between functional quality and overall service quality was (γ21 = 0.18) the relationship between technical quality and overall service quality was (γ22 = 0.42). There was also a positive relationship between image and overall service quality (β21 = 0.04) and between overall service quality and customer satisfaction (β32 = 0.43).
One implication of this finding is that the overall service quality is influenced more by a consumer’s perception of technical quality than functional quality.
It is necessary to compare the paths leading to overall service quality to understand the role of image in the perception of service quality. That is, if the magnitude of the path between the image and the overall service quality is larger than the individual paths between functional quality/technical quality and overall service quality, then the role of image as a mediating factor in the perception of service quality would be supported. The results show that the path between functional quality and overall service quality (γ21 = 0.18) and the path from technical quality to overall service quality (γ22 = 0.42) is larger than the path between image and overall service quality (β21 = 0.04). Thus, the role of image as a mediating factor in the perception of service quality is rejected.
DISCUSSION
One of the major conclusions that can be drawn from this research is that no simple generalization of relative importance of determinants of service quality is possible.
Thus, it must be noted that the importance of determinants of quality for customers would vary across different service types. This could be expected because different services are structured and delivered in different contexts and providers consciously position them at different levels of variables of concern.
The current study sought to verify the European perspective that conceptualizes service quality in relation to functional quality, technical quality and image. Several interesting results emerged from the study. First, the initial results did confirm the five-factor structure of the SERVQUAL instrument.
A second finding of the current study is that the overall service quality is influenced more by a consumer’s perception of technical quality than functional quality.
A third finding is that the role of image as a mediating factor in the perception of service quality is not confirmed.
A final finding of the current study is that the Gronroos’ model is a more appropriate representation of service quality than the American perspective with its limited concentration on the dimension of functional quality in the banking industry of Iran.
The confirmation of the research model has the potential to help managers better understand how customers assess the quality of services. The results from the study suggest that technical quality, functional quality and image should be measured to fully capture an individual’s overall perception of service quality.
ACKNOWLEDGMENT
The authors would like to thank the reviewers for the constructive comments and illustrative suggestions.
REFERENCES
- Akan, P., 1995. Dimensions of service quality: A study in Istanbul. Managing Serv. Qual., 5: 39-43.
CrossRefDirect Link - Albright, J. and H. Park, 2009. Confirmatory Factor Analysis Using AMOS, LISREL ,Mplus, SAS, STAT CALIS. Indiana University, Bloomington, pp: 1-85.
Direct Link - Atilgan, E., S. Aksoy and S. Akinci, 2005. Determinants of the brand equity: A verification approach in the beverage industry in Turkey. Market. Intell. Plann., 23: 237-248.
CrossRefDirect Link - Burns, D.J. and L. Neisner, 2006. Customer satisfaction in a retail setting: The contribution of emotion. Int. J. Retail Distrib. Manage., 34: 49-66.
CrossRef - Chang, P. and M. Chieng, 2006. Building consumer brand relationship: A cross-cultural experiential view. Psychol. Marketing, 23: 927-959.
Direct Link - Dedeke, A., 2003. Service quality: A fulfillment–oriented and interactions–centered approach. Managing Service Quality, 13: 276-289.
Direct Link - Glaveli, N., E. Petridou, C. Liassides and C. Spathis, 2006. Bank service quality: Evidence from five balkan countries. Managing Service Quality, 16: 380-394.
Direct Link - Gronroos, C., 1984. A service quality model and its marketing implications. Eur. J. Market., 18: 36-44.
CrossRefDirect Link - Gronroos, C., 1994. From scientific management to service management: A management perspective for the age of service quality competition. Int. J. Service Indus. Manage., 5: 5-20.
Direct Link - Kang, G.D., J. Jame and K. Alexandris, 2002. Measurement of internal service quality: Application of SERVQUAL battery to internal service quality. Managing Service Quality, 12: 278-291.
Direct Link - Kang, G.D., 2006. The hierarchical structure service quality: Integration of technical and functional quality. Managing Service Quality, 16: 37-56.
Direct Link - Kang, G.D. and J. James, 2004. Service quality dimensions: An examination of gronrooss service quality model. Managing Service Quality, 14: 266-277.
CrossRefDirect Link - Keating, B., R. Rugimbana and A. Quazi, 2003. Differentiating between service quality and relationship quality in cyberspace. Manage. Serv. Qual., 13: 217-232.
Direct Link - Ladhair, R., 2008. Alternative measures of service quality: A review. Managing Service Quality, 18: 65-86.
Direct Link - Lu, Y. and Y. Seock, 2008. The influence of grey consumers service quality perception on satisfaction and store loyalty behavior. Int. J. Retail Distrib. Manage., 36: 907-918.
Direct Link - O’Neill, M.A., A.J. Palmer and R. Beggs, 1998. The effects of survey timing on perceptions of service quality. Managing Service Quality, 8: 126-132.
Direct Link - Petridou, E., C. Spathis, N. Glaveli and C. Liassides, 2007. Bank service quality: Empirical evidence from Greek and Bulgarian retail customers. Int. J. Qual. Reliab. Manage., 24: 568-585.
CrossRefDirect Link - Robledo, M.A., 2001. Measuring and managing service quality: Integrating customer expectations. Managing Service Quality, 11: 22-31.
Direct Link - Seth, N., S.G. Deshmukh and P. Vrat, 2005. Service quality models: A review. Int. J. Quality Relaibility Manage., 22: 913-949.
Direct Link - Svensson, G., 2004. Interactive service quality in service encounters: Empirical illustration and models. Managing Service Quality, 14: 278-287.
Direct Link - Wong, A. and A. Sohal, 2002. Customers perspectives on service quality and relationship quality in retail encounters. Managing Service Quality, 12: 424-433.
Direct Link