
M. Alipour
National Iranian Copper Industries Co., Kerman, Iran
R. Derakhshani
Department of Geology, Shahid Bahonar University, Kerman, Iran
Research Journal of Environmental Toxicology
Year: 2010 | Volume: 4 | Issue: 2 | Page No.: 67-76


ABSTRACT
In this study for evaluating the irrigation return water, the ground water model was applied to the system. The model calibrated base on prepared conceptual model. Hydrogeological models are suffered from uncertainty and validation. Data scarcity and model calibration difficulties affect the model validation and reality. Due to differences in measurement and element scale of parameter values and variable, the errors associated with input data and boundary conditions and errors of measurement of observation variables, the model validation can't achieve by calibration. For defining all of the parameters, groundwater models need data. Reliability of ground-water model predictions typically depends on several parameters include the correctness of the conceptual model. This study shows the interaction between conceptual model and calibration. This study, relies on the actual situation, shows that the conceptual model could improve during model calibration step.
PDF Abstract XML References Citation
How to cite this article
M. Alipour and R. Derakhshani, 2010. Identification of Hydrogeological Properties Using the Results of the Groundwater Modeling. Research Journal of Environmental Toxicology, 4: 67-76.
DOI: 10.3923/rjet.2010.67.76
URL: https://scialert.net/abstract/?doi=rjet.2010.67.76
DOI: 10.3923/rjet.2010.67.76
URL: https://scialert.net/abstract/?doi=rjet.2010.67.76
INTRODUCTION
However sparse subsurface data cause us to be uncertain of exact nature of groundwater system and components (Poeter and Anderson, 2005), but the groundwater quantity and quality is very important in various fields like irrigation, agriculture and public water supply (Derakhshani and Alipour, 2010; Derakhshani and Bazregar, 2010; Alipour and Derakhshani, 2010b; Shanthakumari et al., 2007; Rahmani and Kushafar, 2007). In this regard, groundwater model is a tool which can increase our understanding of groundwater system and can help us to solve groundwater problems (Mercer and Faust, 1980). The conceptual model is the foundation of model analysis (Bredehoeft, 2005). The first real modeling step is the construction of a conceptual model (Waveren et al., 1999; Bredehoeft, 2003). A groundwater model could be created by translating a conceptual model of groundwater system into a mathematical framework. A conceptual model describes the key components of the aquifer system by words and mathematical equations. These keys include the model domain area boundaries, hydrogeological framework and flow system components and the interrelationships between. Reliability of groundwater model predictions typically depends on the correctness of the conceptual model, the availability and quality of model data and the adequateness of the predictive tools (Van der Heijde and Kanzer, 1997). Difficulties in defining truly mechanistic model structures and difficulties of model calibration and validation suggest that the application of distributed hydrological models is more an exercise in prophecy than prediction (Beven, 1993).
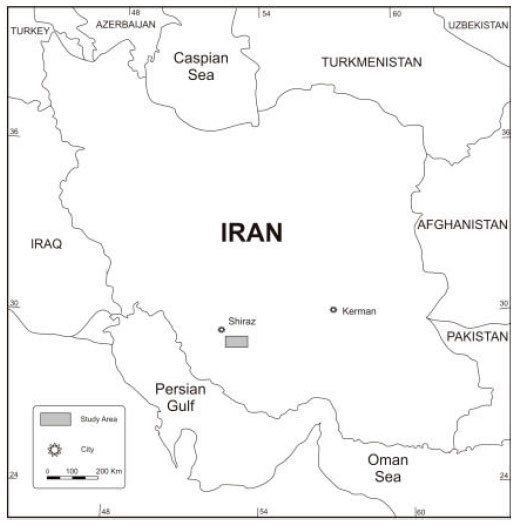 | |
| Fig. 1: | Location of the study area |
It could show that if the same model is optimized on two different periods of record, two different optimum parameter sets will be produced (Beven, 1993). Conceptual model uncertainty gets worse in making long-term prediction of system performance (Bredehoeft, 2005). The automatic calibration can improve results relative to the fully manual calibration (Solomatine et al., 1999). Model calibration with multiple targets, especially using flow path information, is helpful in identifying the best calibration among a set of possible calibration (Kim et al., 1999).
In order to evaluate the irrigation return water, the ground water model was applied to Kavar Plain. The Kavar plain is located in the South-East Shiraz (Fig. 1) (52°, 00'-52°, 30' E and 29°, 00'-29°, 30' W ) in Iran where irrigation water heavily is used for agriculture (mainly wheat and corn plants).
Kavar Plain is situated in the Zagros folded belt. Zagros mountain range in Southwestern Iran forms the extreme Western boundary of the Iranian plateau, though its foothills to the North and West extend into adjacent countries. This mountain range terminated in the Southeast by a broad discontinuity known as Oman Line (Derakhshani and Farhoudi, 2005). Various stratigraphic columns have been studied in various parts of this mountain range (Alavi, 2004; Rahnama et al., 2008; Bahroudi and Koyi, 2004; Adabi et al., 2008; Ghavidel-Syooki and Vecoli, 2008; Fakhari et al., 2008; Shirazi, 2008).
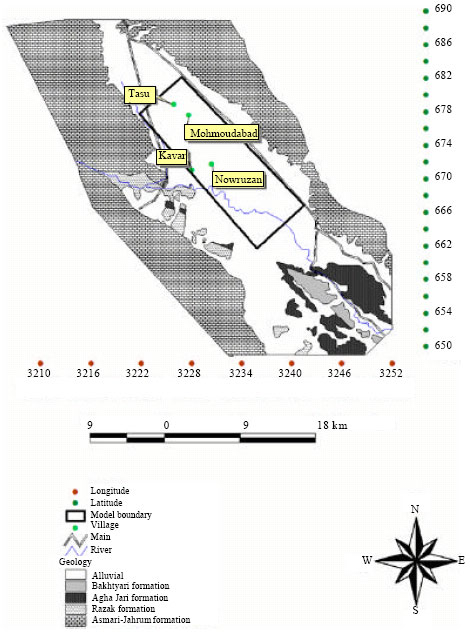 | |
| Fig. 2: | Geological map and model boundary |
The aquifer in the Kavar plain is an unconfined aquifer. Geophysical studies suggest that the depth of the upper alluvial deposits varies from about 300 m in the middle part to 50 m in other parts of the plain (Alipour and Derakhshani, 2010a). In the South and Eastern parts of the plain the bedrock is Razak formation, which is mainly clay and marl. However, these studies do not indicate the absence of this geological formation in the Northwestern part of the aquifer. Minimum water depth in this plain is 1.84 m and the maximum is 55 m. Based on exploration drilling; average thickness of alluvium is 105 m where minimum thickness of alluvium is in North and Northwest of the area. Figure 2 shows the Kavar geological map.
MATERIALS AND METHODS
This study which is concentrated on identification of hydrogeological properties using the results of the groundwater modeling in Kavar Plain, Iran. In order to evaluate the irrigation return water, the ground water model was applied to the system.
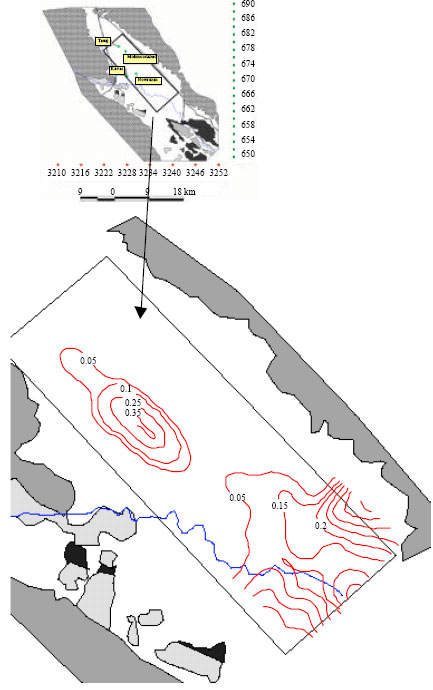 | |
| Fig. 3: | Calibrated permeability (m day-1) distribution in the study area. The calibrated permeability values decrease toward North and Northwest contrary to geological logs and soil properties |
The model calibrated base on prepared conceptual model. The conceptual model (Bredehoeft, 2005) was prepared base on hydrogeological data (Waveren et al., 1999; Bredehoeft, 2003). After satisfactory results of the calibration stage (Solomatine et al., 1999), the model was applied to evaluate the irrigation return water, considering a sink function, w (x, y, t), in the Laplace equation. A figure equivalent to 72% of the pumping water (irrigation water) was calculated and evaluated by the model; this figure was not considered acceptable due to the soil characteristics and infiltration capacity of the area. Therefore, two other attempts were made, considering slightly different parameters and data (whit tow new conceptual model); however, similar results were achieved (67 and 63%), which proves the accuracy of the model results. This value for the irrigation return indicates that there could be other source of recharge into the aquifer.
Therefore the conceptual model is reviewed. Figure 3 shows hydraulic conductivity results produced by model calibration. Based on geological logs, hydraulic conductivity in the Northern part should be larger than the value for the center of the plain. But base on the calibrated results, the hydraulic conductivity decrease in the Northern part.
RESULTS
In addition to the groundwater modeling results, another unusual data was reported as follow:
| • | Apparent specific yield (Sy) is very low and falls in between 0.0046 to 0.093 (based on nine pumping tests in 1985). In addition to this, two pumping tests conducted in 1979, also showed figures of 0.003 and 0.012 for this parameters. Since the aquifer is unconfined, apparent specific yield should be larger than this value |
| • | Based on these studies, discharge volume from all pumping wells was 120 million cubic meters per year in 1983. Based on the water balance equation study, this discharge volume from the Kavar aquifer was considered critical and further water extraction from the aquifer was banned since 1983. However, during a period of 12 years from 1983 to 1995, discharge volume increased illegally and reached 213 million cubic meters per year. Due to this increase of discharge volume, the water level should have declined about 50 m during this 12 year period. But decline in the water table was not observed |
| • | Based on hydro chemical data, water quality improves with depth in the Northwest of the Kavar plain. This was not considered usual, since water quality is expected to be better in the upper level. Also water quality is expected to be better in the wet seasons due to wet season rainfalls, but in the Kavar plain water quality decrease in the wet seasons. Also water quality improved toward water direction |
The model (calibrated hydraulic conductivity and irrigation water return volume) shows that previous assumptions are not valid. The high abnormal calculated irrigation return water by groundwater models indicates that there could be other source of recharge into the aquifer. For examination this opinion, the plain characteristics were reviewed carefully.
The aquifer characteristics review shows in some months of the year (mainly dry season) a hydraulic domes formed in the North and Northwestern parts of the aquifer (this is illustrated by the closed equipotential lines of the aquifer). This must happen due to water recharge from the bedrock. Since there are not any sources of water that could recharge the aquifer, recharge from the bedrock accepted.
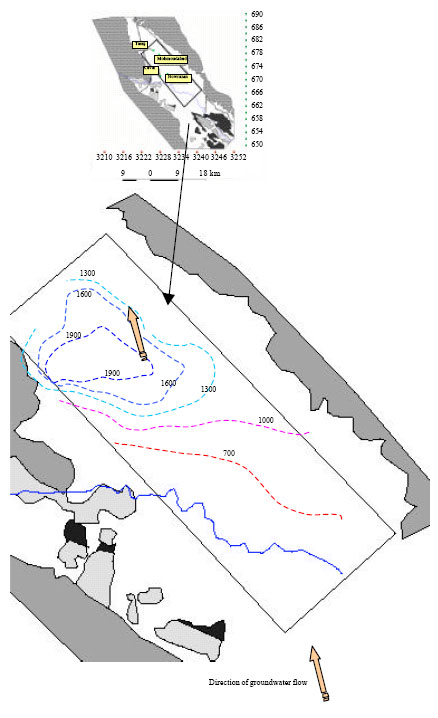 | |
| Fig. 4: | The sulphate concentration increase from 700 to 1900 mg L-1 along the direction of groundwater flow but it start to decrease from 1900 to 1300 mg L-1 in the North and Northwest parts due to intrusion of high quality water |
Study of the aquifer hydrochemical characteristic shows that the groundwater quality improves along the direction of groundwater flow. For example, isosulphate lines show that the sulphate concentration decreased in the direction of groundwater flow contrary to usual condition (Fig. 4). In normal situation, groundwater quality decreased and element concentration increased along the direction of groundwater flow due to water contacts with geological setting. But in the study area the elements concentration (for example sulphate concentration) decreased and groundwater quality improved along the direction of groundwater flow. This means that high quality water is introduced to the aquifer in the water flow direction and improved the groundwater quality. Therefore, the boundary of improved water quality is the boundary of water intrusion from the bedrock (limestone of the Asmary-Jahrum formation).
The applied model is a two dimensional models. Therefore, it can't simulate the three dimensional groundwater systems. However, a two dimensional model was applied for calibration a three dimensional groundwater system. Therefore, it could not be calibrated well in the aria that vertical flow is dominant (in Northern parts). The vertical flow effects on the calibration results are shown in the Fig. 3. Based on geological logs, hydraulic conductivity in the Northern part should be larger than the value for the center of the plain. But base on the calibrated results, the hydraulic conductivity decrease in the Northern part. It could be due to vertical flow effects on the calibration results. Therefore, the conceptual model should be reviewed. Base on the groundwater model results and aquifer characteristic, the aquifer conceptual model was reviewed.
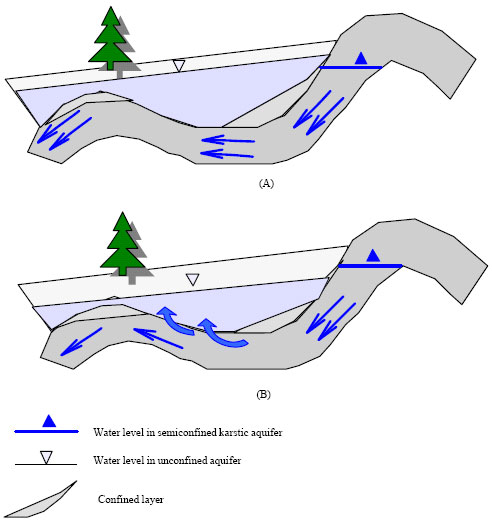 | |
| Fig. 5: | The Kavar aquifer recharge by semi confined aquifer in the dry season; (A) Wet seasons and (B) Dry seasons |
Figure 5A and B demonstrate a model of water intrusion in to the Kavar plain. The following are some previous assumptions, which are believed to be erroneous. These apparent erroneous could explain by reviewed conceptual model.
Low apparent specific yield was evaluated; because this solution was used for calculating apparent specific yield in the Kavar plain considering only one-dimensional flow. However, three-dimensional flows governed behavior of the aquifer.
DISCUSSION
Based on the water balance study which showed an increase in extracted water, the water table level should have declined about 50 m during 1983-1995. However, this decline was not observed and suggests that bedrock acts as a source of recharge. Since in dry seasons and high discharge season, ground water level in the upper aquifer is standing below the piezometric surface and vertical hydraulic gradient must force water into the upper unconfined aquifer. This means the excess removal of water during 1983 to 1995 was replaced by water from the underlying confined aquifer (Kavar aquifer).
Based on hydrochemical studies, water quality improves with depth. This could be due to high quality water intrusion from the bedrock. Due to entrance of this high quality water to the North and Northwest, the water quality in this region improves and the iso-sulphate lines are closed with lower concentrations in the inner lines. Therefore in the dry seasons when the volume of water intrusion is high, the water quality gets better compared to the wet season. This fact clearly is observed in the Kavar plain.
Disagreement between calibrated hydraulic gradient coefficients and hydrogeological properties is due to the effect of water intrusion. Three-dimensional flows governed behavior of the aquifer in the North and Northwest. Therefore, hydraulic conductivity is increased in these regions. Since the "PLASM" models only can simulate two-dimensional flows, the vertical direction is not considered in calibration stage and this affects the calibrated hydraulic gradient coefficient.
Present results show that the flow system in the Kavar aquifer is three-dimensional. However, we could calibrate a two-dimensional model successfully. Also, calibration step achieved by three different parameter sets. Therefore, our study not only confirms strongly the Keith Beven results (Beven, 1993) but also shows that several optimum parameter sets could be produced for the same periods of record. Actually, we can choose a wrong conceptual model and calibrate it successfully. Therefore, good calibration of a model doesn't mean a correct conceptual model. Also, our results show that the model results, even in worst situation, could be used for identification hydrogeological properties. This confirms the Mercer and Faust (1980): ground-water modeling is a tool that can help analyze many ground-water problems.
CONCLUSION
It is easy to show that if the same model is optimized base on several conceptual models, several optimum parameter sets could be achieved. A three dimensional system could be simulated by a two dimensional model. Achieving model calibration could not confirm the optimized parameter set. Professional judgment is very important step in model calibration process. Choosing appropriate conceptual model is a matter of professional judgment. However, model results could be used to improve conceptual model and hydrogeological properties identification. Model calibration steps could be repeated after correcting and improving conceptual model.
ACKNOWLEDGMENTS
This study is dedicated to the memory of the founder of Kerman University, Mr. Alireza Afzalipour, on the occasion of the centenary of his birth. The authors would like to express their gratitude to Dr. M. Zare for his valuable comments. This paper has greatly benefited from the changes suggested by two anonymous reviewers.
REFERENCES
- Adabi, M.H., A. Zohdi, A. Ghabeishavi and H. Amiri-Bakhtiyar, 2008. Applications of nummulitids and other larger benthic foraminifera in depositional environment and sequence stratigraphy: An example from the Eocene deposits in Zagros Basin, SW Iran. Facies, 54: 499-512.
CrossRef - Alavi, M., 2004. Regional stratigraphy of the Zagros fold-thrust belt of Iran and its proforeland evolution. Am. J. Sci., 304: 1-20.
CrossRefDirect Link - Bahroudi, A. and H.A. Koyi, 2004. Tectono-sedimentary framework of the Gachsaran Formation in the Zagros foreland basin. Marin Petroleum Geol., 21: 1295-1310.
CrossRefDirect Link - Beven, K., 1993. Prophecy, reality and uncertainty in distributed hydrological modeling. Adv. Water Resour., 16: 41-51.
Direct Link - Bredehoeft, J.D., 2005. The conceptualization model problem-surprise. Hydrogeol. J., 13: 37-46.
CrossRefDirect Link - Bredehoeft, J.D., 2003. From models to performance assessment: The conceptualization problem. Ground Water, 41: 571-577.
Direct Link - Derakhshani, R. and M. Alipour, 2010. Remediation of acid mine drainage by using tailings decant water as a neutralization agent in sarcheshmeh copper mine. Res. J. Environ. Sci., 4: 250-260.
CrossRefDirect Link - Derakhshani, R. and A. Bazregar, 2010. Estimation of two dimensional solute transport parameters using tracing experiment data. Trends Applied Sci. Res., 5: 48-55.
CrossRefDirect Link - Derakhshani, R. and G. Farhoudi, 2005. Existence of the oman line in the empty quarter of Saudi Arabia and its continuation in the red sea. J. Applied Sci., 5: 745-752.
CrossRefDirect Link - Fakhari M.D., G.J. Axen, B.K. Horton, J. Hassanzadeh and A. Amini, 2008. Revised age of proximal deposits in the Zagros foreland basin and implications for Cenozoic evolution of the High Zagros. Tectonophysics, 451: 170-185.
CrossRef - Ghavidel-syooki, M. and M. Vecoli, 2008. Palynostratigraphy of Middle Cambrian to lowermost Ordovician stratal sequences in the High Zagros Mountains, southern Iran: Regional stratigraphic implications, and palaeobiogeographic significance. Rev. Palaeobot. Palynol., 150: 97-114.
CrossRef - Kim, K., M.P. Anderson and C.J. Bowser, 1999. Model calibration with multiple targets: A case study. Ground Water, 37: 345-351.
Direct Link - Mercer, J.W. and C.R. Faust, 1980. Ground-water modeling: An overview. Ground Water, 18: 108-115.
Direct Link - Poeter, E. and D. Anderson, 2005. Multimodel ranking and inference in ground water modeling. Ground Water, 43: 597-605.
Direct Link - Rahmani, H.R. and M. Kushafar, 2007. Investigation of ground water nitrate concentration in Ardestan, Iran. Res. J. Environ. Toxicol., 1: 92-97.
CrossRefDirect Link - Rahnama, R.J., R. Derakhshani, G. Farhoudi and H. Ghorbani, 2008. Basement faults and their relationships to salt plugs in the arabian platform in Southern Iran. J. Applied Sci., 8: 3235-3241.
Direct Link - Shanthakumari, D., S. Srinivasalu and S. Subramanian, 2007. Fluoride contaminated water and its implications on human health in Vellore district, Tamil Nadu, India. Res. J. Environ. Toxicol., 1: 16-26.
CrossRefDirect Link - Solomatine D.P., Y.B. Dibike and N. Kukuric, 1999. Automatic calibration of groundwater models using global optimization techniques. Hydrol. Sci. J., 44: 879-894.
Direct Link