
R. Arunachalam
Environmental Nanotechnology Division, Sri Paramakalyani Centre for Environmental Sciences, Manonmaniam Sundaranar University, Alwarkurichi - 627 412, Tamil Nadu, India
G. Annadurai
Environmental Nanotechnology Division, Sri Paramakalyani Centre for Environmental Sciences, Manonmaniam Sundaranar University, Alwarkurichi - 627 412, Tamil Nadu, India
Research Journal of Environmental Sciences
Year: 2011 | Volume: 5 | Issue: 4 | Page No.: 366-376


ABSTRACT
The aim of the present study was to discover the effect of low-cost and ecofriendly nano-porous adsorbent (orange peel) as an ideal alternative to the current expensive methods of removing dye Bromophenol blue (Bb) from aqueous solution. The effects of various experimental parameters (e.g., dye concentration, temperature and pH) were investigated by batch equilibrium experiments. The fitness of Langmuir model in the present system shows the formation of monolayer coverage of the adsorbate at the outer space of the adsorbent. Freundlich model isotherm was analyzed. The monolayer adsorption capacity determined was reasonably high (mg g-1) at Temperature (30, 45, 60°C) 88.11 (mg g-1) and pH (5.5, 6.8, 7.8) 149.760 (mg g-1) for adsorption of Bromophenol blue dye, respectively. The values of dimensionless equilibrium parameter like separation factor (RL) at different particle size and temperature indicates the favorability of the process described in the present study. The kinetics of Bromophenol blue dye adsorption nicely followed pseudo-first and second order rate expression and a significant role in the adsorption mechanism. Langmuir and Freundlich models could be used to describe dye sorption on nano porous adsorbent at equilibrium and also the kinetic data gave a better fit. The model fits the second order equation well with correlation coefficients of 0.99967. The adsorption behavior of Bb on orange peel was investigated by FT-IR technique. We concluded on the basis of the results shown in this study that orange peel was an attractive candidate for removing Bb dye from the dye wastewater.
PDF Abstract XML References Citation
How to cite this article
R. Arunachalam and G. Annadurai, 2011. Nano-porous Adsorbent from Fruit Peel Waste for Decolorization Studies. Research Journal of Environmental Sciences, 5: 366-376.
DOI: 10.3923/rjes.2011.366.376
URL: https://scialert.net/abstract/?doi=rjes.2011.366.376
DOI: 10.3923/rjes.2011.366.376
URL: https://scialert.net/abstract/?doi=rjes.2011.366.376
INTRODUCTION
Many industries which used dyes and pigments generated wastewater, characteristically high in color and organic content. Presently, it was estimated about 10,000 of different commercial dyes and pigments exists and over 7x10⁵ tones are produced annually world wide (Grag et al., 2004). Dyes are widely used in industries such as textile, rubber, paper, plastic, cosmetic etc. Among these various industries, textile ranks first in usage of dyes for coloration of fiber (Azahar et al., 2005; Grag et al., 2004).
Many techniques have been found for removal of dye-containing wastewater such as chemical oxidation, membrane filtration, biodegradability, separation and adsorption techniques (Koyuncu, 2009; Choy et al., 1999). Among these, the adsorption process is one of the effective methods for removal dyes from the waste effluent. The process of adsorption has an edge over the other methods due to its sludge free clean operation and completely removed dyes, even from the diluted solution. Activated carbon (powdered or granular) is the most widely used adsorbents because it has excellent adsorption efficiency for the organic compound. But, commercially available activated carbon is very expensive. Furthermore, regeneration using solution produced small additional effluent while regeneration by refractory technique results in a 10-15% loss of adsorbents and its uptake capacity (Azahar et al., 2005; Wang et al., 2005).
Nowadays, there is numerous numbers of low cost, commercially available adsorbents coal, fly ash, wood, silica gel, clay materials (bentonite, montmorillonite, etc.), agricultural wastes (bagasse pith, maize cob, coconut shell, rice husk, etc.) and cotton wastes and cellulose based wastes such as orange, lemon, banana and lychee (Bhatnagar and Minocha, 2010; Thirumavalavan et al., 2010; Bhatnagar et al., 2010; Memon et al., 2009; Achak et al., 2009) which had been used for the dye removal (Azahar et al., 2005; Annadurai et al., 2002; Juang et al., 1997; Theng and Wells, 1995; Singh and Rawat, 1994). Thereby, the present investigation was made on cellulose-based wastes of Citrus reticulata for adsorption removal of dye Bromophenol blue from aqueous solution. The amounts of equilibrium adsorption were measured. The batch contact time method was used to measure the adsorption rate. Kinetic parameters were then evaluated and were finally correlated with process variables such as dye concentration, solution pH, contact time and temperature.
MATERIALS AND METHODS
Adsorbents and dye: Citrus reticulata (orange) peels were obtained from a local fruit stall at Tirunelveli, India on November, 2009. The peels were cut into small pieces, crushed and washed thoroughly with deionized water to remove the adhering dirt. They were air dried in an oven at 40-50°C for 48 h. The BET surface areas of orange peels were in the range 0.0263-0.6719 m2/g obtained from N2 adsorption isotherms by sorptiometer (Quantochrome NOVA 1000). The FR-IR spectra were obtained on Neclit 6700 model. Bromophenol blue was obtained from Merck Co. The solution pH was adjusted by adding a small amount of 0.1 M HCl or NaOH.
Adsorption studies-Batch equilibrium experiments: Bromophenol blue dye solutions were prepared by dissolving dye in deionzied water to the required concentrations. In experiments of equilibrium adsorption isotherm, the mixture of dried absorbent (containing 0.1 g dry basis of dye solution (50 cm3) and acetic acid buffer solution with desired pH value were shaken for 24 h using a water bath to control the temperature at 30±1°C. The effect of the adsorption isotherm was determined by examining the series of isotherms at different temperatures (30, 45 and 60°C) and for pH (5.5, 6.8, 7.8), respectively. The concentrations of dyes were measured with an UV/Visible spectrometer (JASCOV-530). The amount of dye absorbed onto the peels, qe (mg g-1), was calculated by a mass balance relationship (Eq. 1). The procedures of kinetic experiments were basically identical to those of equilibrium tests. The aqueous samples were taken at preset time intervals and the concentrations of dyes were similarly measured.
RESULTS AND DISCUSSION
Langmuir and freundlich isotherm: The equilibrium adsorption isotherm is of fundamental importance in the design of adsorption systems. The isotherm expresses the relation between the mass of dye adsorbed at a particular temperature and pH and liquid phase of dye concentration. For any adsorption investigation one of the most important parameters required to understand the behavior of the adsorption process in the adsorption isotherm. The shape of an isotherm not only provides information about the affinity of the dye molecule for adsorption, but it also reflects the possible mode of adsorbing dye molecule. The most common way of obtaining an adsorption isotherm, is to determine the concentration of dye solution before and after the adsorption experiments, although several attempts have been made to find the adsorbed amount. A basic assumption of the Langmuir theory (Langmuir, 1918) is that sorption takes place at specific sites within the adsorbent (Chen et al., 2008; Asfour et al., 1985; Poots et al., 1976). The data obtained from the adsorption experiment conducted in the present investigation was fitted in different temperature and pH in isotherm equation as shown in Fig. 1A and B. The saturation monolayer can be represented by the expression.
| (1) |
| (2) |
A plot of (1/qe vs 1/Ce) resulted in a linear graphical relation indicating the applicability of the above model as shown in (Fig. 2A, B). The values are calculated from the slope and intercept of different straight line representing the different pH and temperature (b) energy of adsorption and (k) adsorption capacity and Qo is represented by (K).
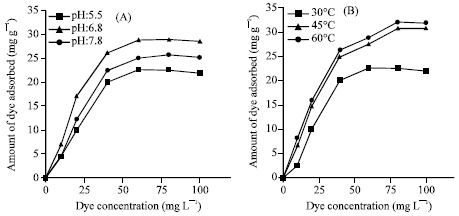 | |
| Fig. 1: | Effect of specific dye uptakes (A) at different pH with dye concentration; (B) at different temperatures dye concentration |
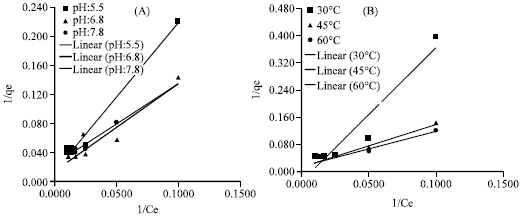 | |
| Fig. 2: | Langmuir isotherm for the adsorption of dye using orange peels (A) at different pH with dye concentration; (B) at different temperature with dye concentration |
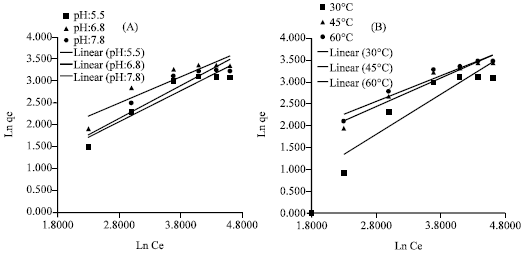 | |
| Fig. 3: | Freundlich isotherm for the adsorption of dye using orange peels (A) at different pH with dye concentration and (B) at different temperature with dye concentration |
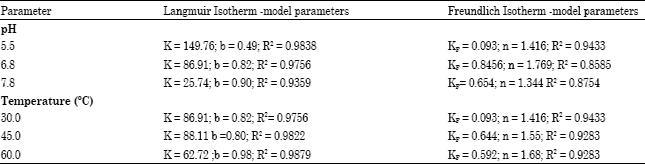
The Langmuir isotherm constant (Qo) in eqn (1) is a measure of the amount of dye adsorbed, when the monolayer is completed. Monolayer capacity (Qo) of the adsorbent for the dye is comparable obtained form adsorption isotherm. The observed statistically significant (at the 95% confidence level) linear relationship as evidenced of these by the R2 values (close to unity) indicate the applicability of the isotherm (Langmuir isotherm) and surface.
Freundlich isotherm (Freundlich, 1906) is used for heterogeneous surface energies system. The sorption isotherm is the most convenient form of representing the experimental data at different pH and temperature as shown in Fig. 3A and B. Figure 3A and B show the batch isothermal data fitted to the linear form of the Freundlich isotherm (Poots et al., 1976; Ho and McKay, 1998, 1999; Mckay et al., 1987; Namasivayam et al., 1998):
| (3) |
| (4) |
The various constants, associated with the isotherm are the intercept, which is roughly on indicator of sorption capacity (kf) and the slope (1/n) sorption intensity values are recorded in (Table 1). Freundlich of isotherm has been illustrated to be a special case of heterogeneous surface energies and it can be easily extended to this case. It has been stated by Poots et al. (1976), Ho and McKay (1998, 1999), Mckay et al. (1987), Namasivayam et al. (1998) that magnitude of the exponent 1/n gives an indication of the favorability and capacity of the adsorbent/adsorbate system. The values n>1 represents favorable adsorption conditions. Most of the cases the exponent between 1<n<10 shows the beneficial adsorption.
Adsorption kinetics: The kinetics of adsorption is important from the point of view that it controls the process efficiency. Various kinetic models have been used by various workers and different systems conform to different models but the Langergrens rate equations (Lagergren, 1898) for the sorption of a solute form liquid solution.
| Table 1: | Langmuir and freundlich isotherm constants at different pH and temperature |
 | |
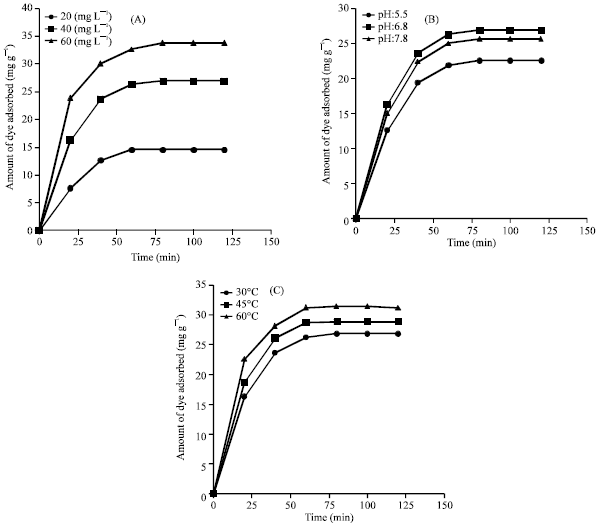 | |
| Fig. 4: | Effect of specific dye uptakes (A) at different dye concentration with time (mints); (B) at different pH with time (mints) and (C) at different temperature with time (mints) |
In order to examine the controlling mechanism of adsorption processes such as mass transfer and chemical reaction, several kinetic models are used to test experimental data (Namasivayam et al., 2001; Namasivayam and Kavitha, 2002). Figure 4A-C had shown the adsorption of dye at different dye concentration, pH and temperature by using environmental nanomaterial. This may be due to the number of positive charges on the sorbent surface which leads to the no rejection of the negatively charged dye molecule and thereby increasing the adsorption. In general, the uptakes are much higher in acidic solutions than those in neutral and alkaline conditions. This explanation agrees with our data on pH effect. It can be seen that the pH of aqueous solution plays an important role in the adsorption of Bromophenol blue dye onto Environmental Nanomaterial. This result is contrary to the results of Habib et al. (2006). Temperature is an important parameter for the adsorption process. A plot of the Bromophenol blue uptake as a function of temperature (30, 45 and 60°C) is shown in Fig. 4C. The adsorption of dye at higher temperature was found to be greater compared to that at a lower temperature. The curves indicate the strong tendency of the process for monolayer formation (Lucarelli et al., 2000; Poots et al., 1976; Ho and McKay, 1998, 1999; Mckay et al., 1987; Namasivayam et al., 1998, 2001). The increase in temperature would increase the mobility of the large dye ion and also produces a swelling effect with in the internal structure of the environmental nanomaterial, thus enabling the large dye molecule to penetrate further (Namasivayam et al., 2001; Namasivayam and Kavitha, 2002; Ho and McKay, 1999). Therefore, the adsorption capacity should largely depend on the chemical interaction between the functional groups on the adsorbent surface and the adsorbate and should increase with temperature rising. The adsorption of dye at higher temperature was found in the present investigation is similar to results of Namasivayam et al. (2001), Namasivayam and Kavitha (2002) and Ho and McKay (1999).
Pseudo-first and second-order equation: In system design viewpoint, a lumped analysis of adsorption rates is thus sufficient to practical operation. A simple kinetic analysis of adsorption is the pseudo-first-order equation:
| (5) |
After definite integration by applying the initial conditions qt=0 at t=0 and qt=qt at t=t, Eq. 4 becomes:
| (6) |
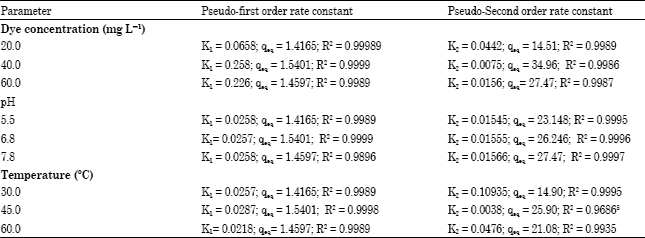
where, qeq and qt are amount of dye adsorbed at equilibrium and at time, in mg g-1, respectively and K1 is the first order rate constant, was applied to the present studies of dye adsorption. As such the values of log (qe-qt) vs t were calculated form the kinetic data of Fig. 5A-C and plotted against time. The first-order rate constant calculated form the plots are shown in Table 2. Adsorption kinetics for some system can also be described by a pseudo-second order reaction (Ho and McKay, 1998, 1999; Mckay et al., 1987; Namasivayam et al., 1998, 2001; Namasivayam and Kavitha, 2002).
The pseudo-second-order equation based on adsorption equilibrium capacity may be expressed in the form:
| (7) |
where, k2 is the rate constant of pseudo-second-order adsorption. Integrating Eq. 6 and applying the initial conditions, we have
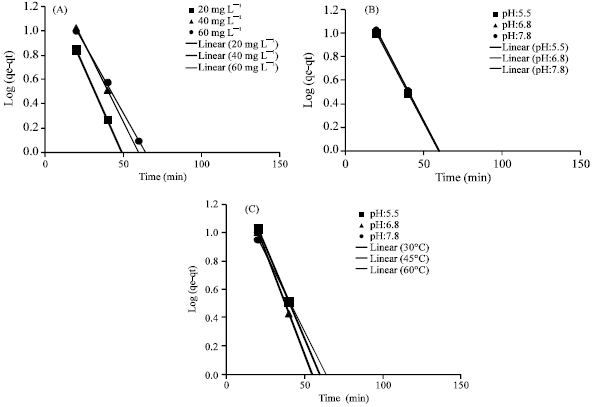 | |
| Fig. 5: | Pseudo-first order plot for the adsorption of dye using orange peels (A) at various plots at dye concentration; (B) at various plots at pH and (C) at various plots at temperatures |
| Table 2: | Pseudo-first and Pseudo-Second order rate constant at different dye concentration, pH and temperature |
 | |
| (8) |
or equivalently,
| (9) |
The equilibrium adsorption capacity (qeq) and the second-order constants k2 (g/mg min) can be determined experimentally from the slope and intercept of plot t/qt versus t. The applicability of the pseudo-second order models can be examined by linear plot t/q vs t respectively as shown in Fig. 6A-C.
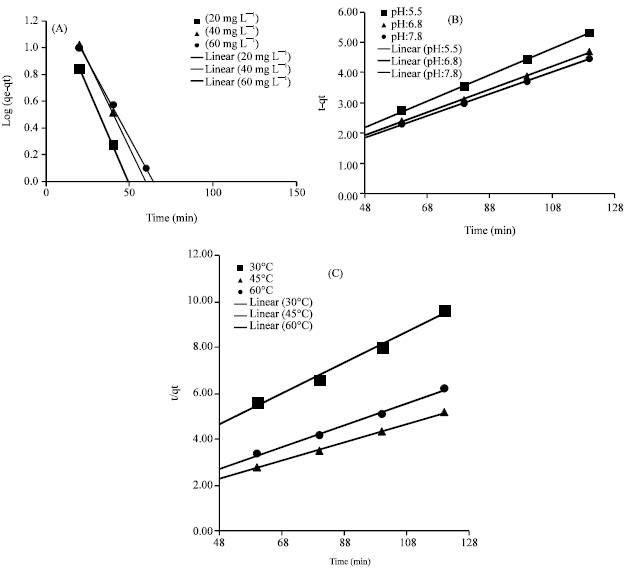 | |
| Fig. 6: | Pseudo-second order plot for the adsorption of dye using orange peels (A) at various plots at dye concentration; (B) at various plots at pH and (C) at various plots at temperatures |
The correlation coefficient R2 shows that the pseudo-second order model an indications of a chemisorptions mechanism, fits the experimental data slightly better than the pseudo-first order model. Therefore the adsorption of Bromophenol blue dye can be approximated more favorably by the pseudo-second order model. This model has been successfully applied to describe the kinetics of many adsorption systems. Calculated correlations are closer to unity for second-order kinetics model; therefore the adsorption kinetics could well be approximated more favorably by second-order kinetic model for dye adsorption. The k2 (mg g-1 min-1) and qeq (mg g-1 min-1) values as calculated are listed in Table 2.
Characterization of orange fruit peels: The constituents of these peels were determined and characterized by FT-IR as shown in Fig. 7. The FT-IR spectra of these peels indicated that these adsorbents contained carboxyl groups between 1257-1244 cm-1 and hydroxyl groups at 3423 cm-1 were determined.
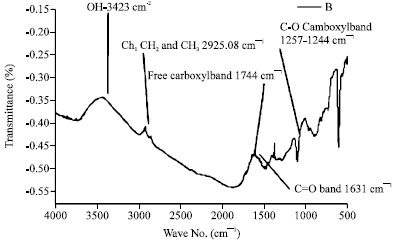 | |
| Fig. 7: | Orange fruit peel cellulose FT-IR Spectrum |
It clearly revealed that the carboxyl and hydroxyl groups content will influence the adsorption capacities and higher the group’s content, the better was the adsorption capacities.
CONCLUSION
The adsorption of dye from aqueous solution using orange cellulose-based waste peels has been investigated, under different reaction conditions in batch and equilibrium mode. The fitness of Langmuir model in the present system shows the formation of monolayer coverage of the adsorbate at the outer space of the adsorbent. Freundlich model isotherm was analyzed. The monolayer adsorption capacity determined was reasonably high (mg g-1) at n, Temperature (30, 45, 60°C) 88.11 (mg g-1) and pH 149.760 (mg g-1) for adsorption of Bromophenol blue dye, respectively. The values of dimensionless equilibrium parameter like separation factor (RL) at different particle size and temperature indicates the favorability of the process described in the present study. The kinetics of Bromophenol blue dye adsorption nicely followed pseudo-first and second order rate expression and a significant role in the adsorption mechanism. Langmuir and Freundlich models could be used to describe dye sorption on environmental nanomaterial at equilibrium and the kinetic data also gave a better fit. The data reported here should be useful for the design and fabrication of an economically viable treatment process using batch (or) stirred tank reactors and also it’s revealed that the waste orange peels were the potential materials for dyes removal from aqueous solutions.
ACKNOWLEDGMENT
Authors thanks University Grants Commission (UGC), New Delhi, INDIA for the financial assistance to carry out this work under grant of Major Research Project (F. No. 36-173-2008(SR)).
REFERENCES
- Achak, M., A. Hafidi, N. Ouazzani, S. Sayadi and L. Mandi, 2009. Low cost biosorbent banana peel for the removal of phenolic compounds from olive mill wastewater: Kinetic and equilibrium studies. J. Hazard. Mater., 166: 117-125.
PubMed - Annadurai, G., R.S. Juang and D.J. Lee, 2002. Use of cellulose-based wastes for adsorption of dyes from aqueous solutions. J. Hazard. Mater., 92: 263-274.
CrossRefPubMedDirect Link - Asfour, H.M., M.M. Nasser, O.A. Fadali and M.S. El-Geundi, 1985. Colour removal from textile effluents using hardwood sawdust as an absorbent. J. Chem. Technol. Biotechnol., 35: 28-35.
CrossRefDirect Link - Bhatnagar, A. and A.K. Minocha, 2010. Assessment of the biosorption characteristics of lychee (Litchi chinensis) peel waste for the removal of Acid Blue 25 dye from water. Environ. Technol., 31: 97-105.
CrossRef - Bhatnagar, A., A.K. Minocha and M. Sillanpaa, 2010. Adsorptive removal of cobalt from aqueous solution by utilizing lemon peel as biosorbent. Biochem. Eng. J., 48: 181-186.
CrossRef - Choy, K.K.H., G. Mckay and J.F. Porter, 1999. Sorption of acid dyes from effluents using activated carbon. Resour. Conserv. Recycl., 27: 57-71.
CrossRef - Grag, V.K., R. Kumar and R. Gupta, 2004. Removal of malachite green dye from aqueous solution by adsorption using agro-industry waste: A case study of Prosopis cineraria. Dyes Pigments, 62: 1-10.
CrossRefDirect Link - Habib, A., Z. Hasan, A.S.M. Shajedur-Rahman and A.M. Shafiqul-Alam, 2006. Tuberose sticks as an adsorbent in the removal of methylene blue from aqueous solution. Pak. J. Anal. Environ. Chem., 7: 112-115.
Direct Link - Ho, Y.S. and G. McKay, 1998. Kinetic models for the sorption of dye from aqueous solution by wood. Process Saf. Environ. Prot., 76: 183-191.
CrossRefDirect Link - Ho, Y.S. and G. McKay, 1999. A kinetic study of dye sorption by biosorbent waste product pith. Resour. Conserv. Recycling, 25: 171-193.
CrossRef - Juang, R.S., F.C. Wu and R.L. Tseng, 1997. The ability of activated clay for the adsorption of dyes from aqueous solutions. Environ. Technol., 18: 525-531.
CrossRefDirect Link - Koyuncu, M., 2009. Removal of maxilon red GRL from aqueous solutions by adsorption onto silica. Int. J. Chem. Tech. Res., 1: 332-337.
Direct Link - Lagergren, S., 1898. About the theory of so-called adsorption of soluble substances. Kungliga Svenska Vetenskapsakademiens Handlingar, 24: 1-39.
Direct Link - Langmuir, I., 1918. The adsorption of gases on plane surfaces of glass, mica and platinum. J. Am. Chem. Soc., 40: 1361-1403.
CrossRefDirect Link - Lucarelli, L., V. Nadtochenko and J. Kiwi, 2000. Environmental photochemistry of surface: Adsorption studies and quantitative FT-IR spectroscopy during photo-catalyzed degradation of Azo-dye orange II on TiO2 surfaces. Langmuir, 16: 1102-1108.
CrossRef - Mckay, G., M. Geundi and M.M. Nassar, 1987. Equilibrium studies during the removal of dyestuffs from aqueous solutions using bagasse pith. Water Res., 21: 1513-1520.
CrossRef - Memon, J.R., S.Q. Memon, M.I. Bhanger, A. El-Turki, K.R. Hallam and G.C. Allen, 2009. Banana pee: A green and economical sorbent for the selective removal of Cr (VI) from industrial wastewater. Colloids Surf. B. Biointerfaces, 70: 232-237.
PubMed - Namasivayam, C., D. Prabha and M. Kumutha, 1998. Removal of direct red and acid brilliant blue by adsorption onto banana pith. Bioresour. Technol., 64: 77-79.
CrossRef - Namasivayam, C., R. Radhika and S. Subha, 2001. Uptake of dyes by a promising locally available agricultural solid waste: Coir pith. Waste Manage., 38: 381-387.
CrossRefPubMedDirect Link - Poots, V.J., G. Mckay and J.J. Healy, 1976. The removal of acid dye from effluent using natural adsobents-II wood. Water Res., 10: 1061-1066.
CrossRef - Singh, B.K. and N.S. Rawat, 1994. Comparative sorption equilibrium studies of toxic phenols on fly ash and impregnated flyash. J. Chem. Technol. Biotechnol., 61: 307-317.
CrossRef - Theng, B.K.G. and N. Wells, 1995. Assessing the capacity of some New Zealand clays for decolourizing vegetable oil and butter. Applied Clay Sci., 9: 321-326.
CrossRef - Thirumavalavan, M., Y.L. Lai, L.C. Lin and J.F. Lee, 2010. Cellulose-based native and surface modified fruit peels for the adsorption of heavy metal ions from aqueous solution: Langmuir adsorption isotherms. J. Chem. Eng. Data, 55: 1186-1192.
CrossRef - Wang, S., Y. Boyjoo, A. Choueib and Z.H. Zhu, 2005. Removal of dyes from aqueous solution using fly ash and red mud. Water Res., 39: 129-138.
CrossRefDirect Link - Namasivayam, C. and D. Kavitha, 2002. Removal of Congo Red from water by adsorption onto activated carbon prepared from coir pith, an agricultural solid waste. Dye Pigments, 54: 47-58.
CrossRefDirect Link