
A.R. Saadatabadi
IR of Iran Meteorological Organization, Tehran, Iran
A.A. Bidokhti
Institute of Geophysics, Tehran University, Tehran Iran
Research Journal of Environmental Sciences
Year: 2011 | Volume: 5 | Issue: 1 | Page No.: 1-21


ABSTRACT
Forty years data (1956-1995), mainly monthly mean values of minimum and maximum daily temperatures records have been analyzed for Mehrabad, a station in the West of Tehran and Varamin, a small town Southeast of Tehran as a rural site, to look for urban climatic change. This has included the long period of annual, seasonal and daily trends. The trend is predicted by a least squares regression analysis and the significance of the observed trend is calculated by using the Mann Kendall technique. The records show that on average the annual minimum temperature has increased specially for Tehran station (typically 0.065°C year-1). Temperature trends for nighttime are steeper by about twice as large as that of daytime trends for Tehran station. The mean temperature rise for the Tehran station is largest in Autumn and is weakest in Winter; while the steepest trend in minimum temperature occurs in November. The difference in the annual mean daily minimum temperature of Mehrabad and Varamin has increased with population. Closer examination of the records shows that the trend varies during this period in response to different rates of urbanization that shows weaker variations during the period from late fifties to early seventies than the period from early seventies to the early nineties. The Mehrabad wind speed records, during this period show that the Northerly component of wind at night has been reduced indicating the surface aerodynamics resistance increase due to built up areas.
PDF Abstract XML References Citation
How to cite this article
A.R. Saadatabadi and A.A. Bidokhti, 2011. Urbanization Effects on Local Climate in Tehran Megapolis. Research Journal of Environmental Sciences, 5: 1-21.
DOI: 10.3923/rjes.2011.1.21
URL: https://scialert.net/abstract/?doi=rjes.2011.1.21
DOI: 10.3923/rjes.2011.1.21
URL: https://scialert.net/abstract/?doi=rjes.2011.1.21
INTRODUCTION
Rapid urbanization in many parts of the world is evident due to the population increase in cities and human living habits. As a result of city expansion, the atmosphere in big cities is increasingly being modified by near surface changes of atmospheric parameters, including air temperature changes, humidity, precipitation, visibility, surface energy fluxes, anthropogenic heat emission and air pollution. This can subsequently result in inadvertent local weather and climate change (Changon, 1981; Cotton and Pielke, 1995; Oke, 1982; Jauregvi and Romales, 1996; Rozoff and Cotton, 2002). El-Gammal et al. (2008) investigated the chemical composition of wet atmospheric precipitation over Damietta City-Egypt. They showed atmospheric precipitation is strongly modified due to various human activities, motor vehicles and furniture activities which are scattered all over the city. Climatic changes and weather modification in big cities have been studied extensively (Oke, 1973; Karaca et al., 1995; Montavez et al., 2000; Landsberg, 1981; Bornstein, 1968; Karl et al., 1988; Tumanov et al., 1999). However, rapid expansion, especially of large cites as Tehran, make them unique, for investigation of Urban Heat Island (UHI) effects on local climate by comparing the temperature trends of an urban location and rural site nearby. In recent decades, positive trends of surface temperature have occurred in rapidly growing urban areas. Soltani and Soltani (2008) studied the trends of historical temperature and precipitation measurements of Khorasan, Northeast of Iran. They showed minimum temperature (0.29°C/decade) at Bojnord and both minimum (0.45°C/decade) and maximum (0.24°C/decade) temperatures at Mashhad indicated significant positive trends. The rate of temperature increase in urban areas depends on various factors, such as weather condition, latitude, time, topography, stability, wind, cloudiness, snow cover, air pollution, anthropogenic and artificial heat sources and street geometry. Morris and Simmonds (2000) investigated the influences of different mean sea level pressure conditions on urban heat island magnitudes in Melbourne, Australia. These synoptic conditions included the entire range of weather conditions over a 19 year period (1973-1991). Torok et al. (2001) investigated the magnitude of the Urban Heat Island (UHI) effect in four small towns. Their results showed the urban-rural temperature difference was found to increase with increasing population. Yague et al. (1991) distinguished three synoptic conditions from two years of data of Madrid urban heat island. They found that the largest urban heat island intensities were associated with anticyclonic conditions during cold periods.
Eliasson and Holmer (1990) studied urban heat island circulation in Goteborg and they showed that this circulation develops during winter nights with anticyclonic weather conditions. So, the urban heat island circulation layer is capped by an inversion and the flow is almost independent of the direction of regional flow. There are evidence that enhancement of early morning low level local winds, under stable conditions greatly diminishes the urban heat island effect (Comrie, 2000). Wind reduces the magnitude of UHI in two ways, mixing cold air at the surface with warmer air aloft and ventilating the city. For example, Gedzelman et al. (2003) found that at midnight the urban-rural temperature difference, DTmin (u–r), for the New York City averages 4.8°C when wind speed is less than 2.5 m sec-1 but only 2.1°C when wind speed is above 7.5 m sec-1.
Various methods have been used in attempts to detect the existence of urban effects and their intensities on the local climates. Lowry (1977) proposed some methods to distinguish between the urban effects and other local and global components of the climate elements. Lowry (1977) has proposed a model in which a measured variable as T (e.g., mean temperature) in an urban environment is being influenced by global climate, Tc, local features, Tl (as mountains) and urbanization, Tu. Although, microclimatic effect associated with the measuring site as exhaust of a building could be considered as a noise, Tn in the variable. Hence, one could represent the variable as: T = Tc+Tl+Tu+Tn. If one is careful in setting up the measuring station so that any microclimatic effect are absent as is usually the case, Tn would be negligible. Hence, if one subtracts T of two urban and nearby rural station, assuming that Tc and Tl are the same for the two, the urban effect on temperature would be revealed.
Tehran is one of the growing cities of the world with a special background, Alborz Mountains range is in the North of the city and arid region known as Kavir is in the South. It has grown since 1950 and increased rate since 1970s. It is also situated in basin area, partially surrounded by mountain ranges which make it prone to acute air pollution episodes and local climate change. The mountainous characteristics of the city may lead to further complication of the urban climate, as mountain and country breeze circulations interact and change the temperature field. For example, in high-pressure weather conditions, i.e., in the absence of active synoptic forcing, mountain induces katabatic and anabatic wind systems that are very vivid in wind direction records, which can influence the urban heating. Preliminary measurements of near surface temperature field for Tehran show a complicated pattern, with a few cold and heat island centers due to non-homogenous built up area (Moradzadeh, 1999).
In order to look for local climate change due to urbanization here we analyze the existing temperature records of Mehrabad (West of Tehran) in 40 years period and compare the trends in Monthly and seasonal mean values and means of minimum and maximum temperatures, with those of Varamin station near this small town 50 km Southeast of Tehran. This includes long period, annual, seasonal and to some extent, daily trends. Along the same line, we also look at the wind components records for Mehrabad station to show that Northerly katabatic wind have been changed by the urbanization. This may have some effect on urban minimum temperature. Taking the population growth as an urbanization index, these changes are interpreted in terms of urban developments. Although, the difference between the two stations is not meant to be purely due to urban heat island as the Varamin station may be influenced by the Tehran urban environment, especially in recent years. However, we use the data which have statistical significant trends for Mehrabad but not for Varamin. The main intention of the present study was to investigate effects of urbanization on the heat island intensity in a semi-enclosed basin with high population growth recent years.
MATERIALS AND METHODS
Alborz Range is stretched from West to East in the North of Iran. Height of central chains of mountain increase from West to East and their peaks exceeds 4000 m, culminating to Damavand that its peak is 5671 m. Southern walls of the central Alborz crosses the two rivers running toward South and makes the wind regime channeled along the valleys of the rivers namely Jajerud in East and Karaj in Northwest of Tehran. There are vast plains in South of Alborz domains that begin from Ghazvin in West and continue to Varamin in the Southeast of Tehran. Vast plain of Tehran-Karaj is stretched in Northwest to Southeast direction. Area of Tehran-Karaj is about 2742 km2 and its height from MSL varies from 1450 m in the North to 1000 m in the South (Fig. 1a, Table 1).
Different geographical factors affect the climate of Tehran. These include Northern Alborz mountain chain, Kavir (an arid area) in the Southeast and Southerly to Westerly humid winds which are the most important of these factors. The last two factors affect climate of the region while the former one modifies climate of the mountainous region and nearby valleys. Mountain forcing at synoptic level, increases the precipitation, but under calm conditions mountainous areas produce thermally induced winds namely katabatic and anabatic winds. The Kavir affects Tehran climate as a source of heat and dust haze. However, it seems that, in recent decades, the urbanization caused remarkable variations in the local climate, which can also have implications for the regional climate. The city of Tehran has many orbital towns which some of them have also grown recently (since 1980s). In a short period the economical base of the city has changed from an agricultural base to an industrial-commercial one. Latest statistics indicates that population of the city exceeding 10 million; total number of vehicles is about 1,352,000 (based on 1994 data, Shafipoor, 2000) and area of the greater Tehran area is about 570 km2. Direction of the streets in the city is mainly Westeast, parallel to the Alborz range with some of them in Northsouth direction along the slope along the slope of the mountains.
| Table 1: | Weather stations site properties |
 | |
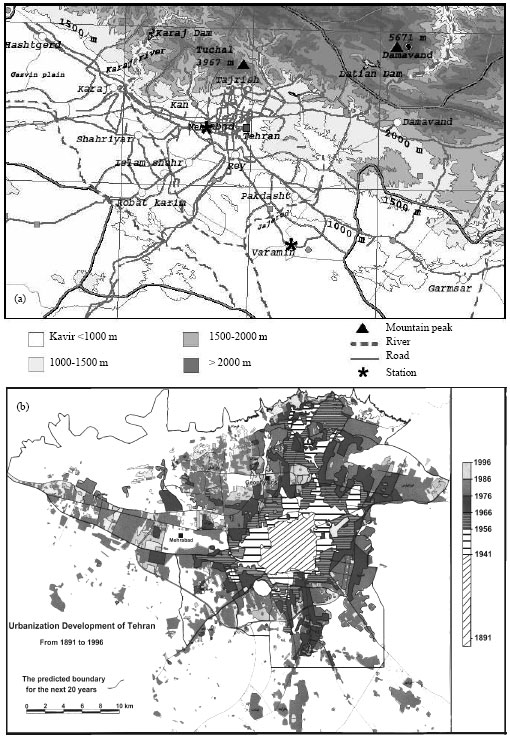 | |
| Fig. 1: | (a) A site map of the meteorological stations (Mehrabad) for Tehran and Varamin. Notice that the Alborz mountain range is in the North of Tehran and (b) a map showing the urban development of Tehran 1891-1996 (Tehran Municipality) |
Central and Southern parts of the city have short buildings with older structure compared to buildings in Northern part. The city is on the Southern slope of the Alborz mountain range. The built up areas are not uniform with some parts especially the Northern area, being covered by more recent and taller buildings. The average height of the buildings is usually less than that of the other large cities of the world (often 4-5 story buildings). The sky view factor (Oke et al., 1991) for the built up areas of the city on average is about 0.5 corresponding to height/width ratio of about one.
Most of the time during the year (about 300 days), the city is under dominant ridge condition. In wintertime often an extension of Siberian cold high (and to some extent middle latitude Westerlies) dominates and in summer time South Easterlies related to Asian monsoon affect the weather (Bitan and Sa’aroni, 1992).
Mehrabad synoptic station (a representative station of the West of Tehran) is near the Tehran main airport West of the city with no tall buildings (more than three stories) or trees, up to 1-2 km around it. The area around it is mainly dry land and small installations such as radar antennas which are more than 50 m away from the station. The main airport runway is about 100 m South of the station. The station has been on the less built-up area of the city, but since 1970s the city has expanded around the airport, especially to the West and North. Mehrabad station was outside the city of Tehran before 1966 and since early seventies urbanization around this station (considering the airport limiting area) especially towards the West have gathered pace (Fig. 1b).
The Varamin station is near the small town of Varamin 50 km Southeast of Tehran. This town is surrounded by agricultural land and the buildings heights are smaller compared to the ones in Tehran, with sky view factor of about 0.6. Varamin climate station has been in the North East of the Varamin town which is in a desert area. The area surrounding the station is mainly dry with some vine yards with no tall trees. The only three-story building is about 700 m North of the station and the main road also passes near this building. A rail road also runs some 800 m south of the station. Since, early 1990s there has been some building development around this station at some 500 m distance from it and due to this the station has been moved from 1995 to a new site further away from town that now operates as a synoptic station.
Because of closeness of Varamin to Tehran, the climate of Varamin may be slightly affected by the urban plume of Tehran, especially in recent years as a result of large urban development in Tehran greater city; however, it is the only site with good-quality long-term data records for comparison. Also we have not used the last recent 10 years data of this site. It should be mentioned that some other weather stations are also in this area but their records are either very short or discontinuous.
The data (from IRof Iran Meteorological Organization) mainly consist of monthly, seasonal and annual means and means of minimum and maximum temperatures measured at the synoptic station in Mehrabad (Tehran) and the climate station of Varamin. Data of Mehrabad (Tehran) are for a period of about fifty years from 1951 to 2000, while the data for Varamin are for the period 1956 to 1995. The levels of instruments of these stations were not changed during this period, except that in 1984 the screens have been heightened by 0.5 m in both stations.
Population data is taken from Iranian Statistics Center and the map of Tehran showing the urban development during this period is shown in Fig. 1b which was acquired from city municipality.
In this manuscript we examine two simple statistical approaches both parametric and non-parametric to detect significant trends. A simple linear regression analysis, namely the least- Squares method, was applied to detect trends over the time series under investigation and whether or not a constant increasing or decreasing trend was occurring, the non-parametric Mann-Kendall (MK) test for trend was applied; a positive (negative) Z value indicates an upward(downward) trend. The Mann-Kendall rank statistic is considered the most appropriate (Goossens and Berger, 1986) for the analysis of climatic changes in meteorological time series especially detection of a climatic discontinuity. The following are brief description of the statistical tests used in this study.
Mann-kendall test: This popular non-parametric test is used to test if the values of the studied time series are going up or down in a manner not due to chance alone. No assumption of normality is required but there must be no serial correlation in the Y values for the resulting p-values to be valid. The test is expected to be less affected by the outliers since its statistic is not directly based on the values of the random variable but on the sign of divergences (Kendall, 1975; Mann, 1945). The test is widely used in the analysis of climate changes. The method is described briefly by McBride (2000). This test is directly analogous to regression, where the test for significance of the correlation coefficient r is also the significance test for a simple linear regression. Moreover, Mann-Kendall test is an appealing and more cost-effective alternative to the parametric regression method. We are giving time series the symbol xi, a sequence of measurement over time as x1, x2,….., xn. Each data point xi is used as a reference point and compared with other data points such that:
 |
A null hypothesis, Ho (no trend in the data), was tested such that the data come from a population where the random variables are independent and identically distributed (Mann, 1945). Under the Ho, the Mann-Kendall’s test statistic (S) is:
For situation where there may be ties in the series, S is asymptotically normally distributed with zero mean and variance equaling.
where, p is the number of tie values in the data set. tj is the number of data points in the jth tied values.
The values of S and VAR(S) are used to compute the test statistic Z as follows:
 |
A positive (negative) value of Z indicates an upward (downward) trend. The statistic Z has a normal distribution. To test for either an upward or downward monotone trend (a two-tailed test) at α level of significance, H0 is rejected if the absolute value of Z is greater than ![]() , where
, where ![]() is obtained from the standard normal cumulative distribution tables. The SPSS and Excel programs were used to analyze temporal and spatial temperature changes in Tehran area. The Excel template MAKESENS (Salmi et al., 2002) was also used to detect trends in the annual values of temperature by the Mann-Kendall test. In MAKESENS the tested significance levels α are 0.001, 0.01, 0.05 and 0.1.
is obtained from the standard normal cumulative distribution tables. The SPSS and Excel programs were used to analyze temporal and spatial temperature changes in Tehran area. The Excel template MAKESENS (Salmi et al., 2002) was also used to detect trends in the annual values of temperature by the Mann-Kendall test. In MAKESENS the tested significance levels α are 0.001, 0.01, 0.05 and 0.1.
Linear regression test: Regression statistics provide an estimate of degree of association based on least-squares regression analysis of potentially false significance. Simple linear regression of Y (meteorological variable in this study) on time (x in year) is essentially a trend test. Linear trend means that rate (magnitude of change over time) of increase or decrease is constant. The null hypothesis is that there is no significant trend or increase/decrease of the studied parameters with time is zero. Analyzing linear trends of climatic elements and assessing their statistical significance are fundamental tools in the detection of climate change.
RESULTS AND DISCUSSION
Long-term trends: The data from direct long-term observations are presented (often as time series) to look for local urban temperature change in Mehrabad area West of Tehran. Linear regressions are used to discern trends in the data. Linear regression methods attempt to solve the regression problem by making the assumption that the dependent variable is a linear function of the independent variables. Also, the statistical significances of these trends are assessed using the Mann-Kendall test for trend. To estimate trends of time series the following simple linear equation is used.
| (1) |
where, y is dependent variable, c0 is the slop, x is independent variable and c1 is a constant.
The computed trends are for AmTmin (annual monthly mean daily minimum), AmTmax (annual monthly mean daily maximum) and DAmTmax-min (difference of annual monthly mean daily maximum and minimum temperatures) for Mehrabad and Varamin (Table 2). Also, the time series of the aforementioned quantities are presented in graphic forms.
| Table 2: | Results of the application of the Mann–Kendall test and of least square linear fitting to annual time series of Mehrabad and Varamin |
 | |
| The significance levels are 0.001(*** and boldface), 0.01(**), 0.05(*), 0.1(+), ns: Not significant | |
 | |
| Fig. 2: | Long-term time series of annually averaged temperatures for Tehran and Varamin, 1956-1995 (a) annual mean daily minimum temperatures, (b) annual mean daily maximum temperatures and (c) difference of annual means daily maximum and minimum temperatures |
Figure 2a-c show AmTmin, AmTmax and DAmTmax-min time series respectively for Mehrabad (Tehran) and Varamin from 1956 to 1995. Apart from the inter-variability of AmTmin at both sites, it shows increasing trends over the 40-year period, with different rates. Results from the application of Eq. 1 indicates that Mehrabad area has been warmed up substantially with a typical rate of 0.065°C year-1, which is similar to very large cities such as Mexico City (Kukla et al., 1986), while Varamin has warmed up at the rate 0.016°C year-1 which is not significant except in summer months (Table 2). About 0.01°C/decade of this trend is due to regional warming in the area (Manabe et al., 2001), Urban warming has therefore occurred at a net rate of +0.049°C year-1 (about +2°C over 40 year). The AmTmin have hardly changed in Tehran (Fig. 2b) with not much statistical significance, hence the urban and rural sites may have had very small cooling trends over this period, in this respect and the decreasing trend in Varamin (–0.013°C year-1) is greater than that of Tehran (–0.004°C year-1). It could be due to higher minimum temperature in Tehran. In spite of the fact that, air pollution reduces incident solar radiation in urban area, but minimum temperature increase can compensate for some of maximum temperature decrease.
Figure 2c shows that DAm Tmax-min has decreased for the Tehran station and to a small extent for Varamin. The rate of decrease in trend of DAm Tmax-min for Tehran station is more than twice as that of Varamin (–0.07 versus –0.03 °C year-1). This indicates that the urbanization may have reduced the amplitude of the daily temperature change.
Figure 3 shows time series of Ammin Mehrabad (Tehran) minus Varamin [i.e., DAmmin(u-r) (urban-rural differences in AmTmin)], as have been proposed by Lowry (1977) and the mean population of Tehran in the period of 1956-1995. The two correspond well with each other, although the population data is decadal as the population figures are only available every 10 year. Prior to 1970 no significant trend is observed and between 1970 and 1986 there is a significant increase in DAmmin(u-r) which corresponds to a large urban growth in the West of Tehran (Fig. 1b). Since, the late eighties also there has been some urbanization in Varamin area and also the population growth of Tehran has slowed down slightly. These two factors may have removed the increase in trend so as the value of Dammin(u-r) has not changed very much between 1986 and 1995. Also the effect due to Varamin being in environment of Tehran especially in the later years may be substantial (Lowry, 1977). This effect cannot be evaluated as the long period good data records for appropriate weather stations further away is not available in this case. Still closer examination of this record, regarding the inter-variability, also reveals another interesting point that in 1981 there is a significant decrease in DAmmin(u-r) value and then a gradual increase is observed after 1982 to 1986. In fact, in 1981 there was rationalization of fuel in the city for about a year. After that, an increase in trend can be related to the rapid urbanization in the Tehran greater area since early 1970’s.
Figure 4 shows variations of DMmmin(u-r) (difference of monthly mean daily minimum temperature) for different months of the year averaged for the whole period of study (DMmmin of Mehrabad and Varamin of the climatological records).
 | |
| Fig. 3: | Time series of annual mean daily minimum temperatures of Mehrabad (Tehran) minus Varamin and the population of Tehran (every 10 years) in period 1956-1995 |
 | |
| Fig. 4: | The averages of urban-rural (Mehrabad-Varamin) differences in Tmin for different months of the year (The averages are for the whole period of study) |
| Table 3: | Linear Regression Coefficient (b) with Associated Error (σb) and Mann-Kendall (MK) statistics for seasonal time series of surface air temperature Mehrabad and Varamin for the Period 1956-1995. Negative values indicate negative trends and positive values indicate positive trends. |
 | |
| The significance levels are 0.001(*** and boldface), 0.01(**), 0.05(*), 0.1(+), ns: Not significant | |
There is indeed a marked difference in DMmmin(u-r) values between summer and winter. DMmmin(u-r) increases from February to September and it reaches its maximum values in September and again decreases towards January reaching its minimum value in February (Fig. 4). Table 3 shows linear regression coefficient (b), associated error (σb) and Mann-Kendall statistics for seasonal time series of Tmin (daily minimum air temperature) and Tmax (daily maximum air temperature) in Mehrabad and Varamin for the period 1956-1995. Negative values indicate negative trends and positive values indicate positive trends. Seasons were defined as follows: Winter (DJF) is December To February; summer (JJA) is June to August; spring (MAM) is March to May; autumn (SON) is September to November.
The SmTmin (seasonal mean daily minimum temperature) have positive meaningful trends almost in all seasons for Mehrabad (with largest value of 0.083°C year-1 for autumn) and significant at the 0.01 for winter and 0.001 for other seasons, but not for Varamin except for summer (with a value of 0.027°C year-1) and significant at the 0.01. This may be due to the fact that the urban plume of Tehran may have increased in size particularly in summer season as the wind speed is smaller than in other seasons. This can influence the Varamin temperature records more significantly in summer.
Oke et al. (1991) points out that some cities apparently exhibit their largest heat island in summer, others in the winter. He relates a substantial portion of seasonal effects to changes of thermal admittance in summer times and anthropogenic heat in winter times. In Mehrabad, maximum trends have occurred in autumn, which could also be the result of thermal admittance in summer and early autumn; however, the rate of warming in Tehran station is more substantial. The autumn urban warming is almost five times the rate of the rural site, at a net rate of 0.0654°C year-1. This difference indicates that mean seasonal urban heat island has maximum intensity in autumn.
SmTmax (seasonal mean daily maximum temperature) does not show a remarkable trend in all seasons at Mehrabad and Varamin, except only a negative and positive trend, respectively in winter and summer at Varamin that were shown to be significant at the 0.1 level.
Figure 5 shows trends (ΔT/Δt) of the monthly absolute minimum and maximum temperatures for Mehrabad for the period of study. The MabsTmin (monthly absolute minimum temperature) trends are remarkably rising for most of the months and it has its maximum value for November. Winter MabsTmin trend has also increased substantially while MabsTmax (monthly absolute maximum temperature) trend has decreased, that may indicate that the air pollution in this city may reduce the amplitude of temperature variations. The decrease of the diurnal temperature range is approximately equal to the increase of mean temperature that has also been observed by Karl et al. (1993).
Figure 6 shows the rate of change of DMm Tmin and Tmax and MmT (monthly mean daily temperature) for Mehrabad for different months during the period of study. The DMm Tmin and Tmax trends are negative and the MmT trends are positive, while rates of decrease are generally greater than the rates of increase. These trends are consistent with the trends
observed by Shreffler (1978). Generally, maximum urban heating occurs at nights, during which surface radiation cooling results in stability in urban boundary layer. Cold air drainage flows from the North mountain may also increase this nocturnal stability in this case. In daytime due to existence of convective instability in the boundary layer, which leads to thickening of the mixed layer, the heat island effect is hence, minimum.
As Fig. 3 showed, we have different urban developments during this 50 years period; hence we have separated the records into two sections, demonstrating the conditions before the urbanization around the Mehrabad area and after that. For understanding details of variations in trends of MmTminand MmTmax in forty years of study, the period has been divided to two 20 years (Fig. 7a-c). In the first period (1951-1970) there are only small changes in MmTminand MmTmax trends with no significance in all months, with larger trend for November. As described earlier, the area around the Mehrabad was much less urbanized in this first period (Fig. 1b), hence justifying the small positive trends or even negative ones (almost no urban heating effect).
 | |
| Fig. 5: | Trends of monthly absolute minimum and maximum temperature for Mehrabad, during the period 1951-2000 |
 | |
| Fig. 6: | Trends of monthly mean daily minimum and maximum temperature difference and monthly mean daily temperature for Mehrabad, during the period 1951-2000 |
These small changes may have been the results of the airport activity change (e.g., surface changes) rather the urbanization in Mehrabad area.
In the second period (1971-1990) the increasing trends of MmTmin in all months with statistical significance are very marked. This trend almost has its maximum in the cold season of the year, as have been observed by others (Yague et al., 1991). This increase is much larger than that of the first period, especially for the cold season (Fig. 7b). As shown in Fig. 7c, the trends for Varamin in this period show no clear change except that for the summer and January for which there are small trend increases in MmTmax. This may be due to two factors, namely urbanization of Varamin itself and the urban plume of Tehran that influences the climate of Varamin. Other factors as global warming may also partially responsible for these trends increases (Manabe et al., 2001).
 | |
| Fig. 7: | Trends of monthly mean daily minimum and maximum temperatures for Mehrabad during the periods (a) 1951-1970, (b) 1971-1990 and (c) for Varamin (1971-1990) |
Diurnal changes for different months: In a finer analysis, hourly mean values of temperature trends have been considered. Dry and wet bulb temperatures data of Mehrabad (Tehran) station in every 3 h observation have been selected and linear regression trend of all observations (0000, 0600, 0900, 1200, 1500, 1800 and 2100 UTC), generally indicate positive correlations between the two, as shown in Fig. 8a-d. However, hourly daytime trend values vary for different months. Daytime observations, (0600-0900UTC and 1200-1500UTC) indicate similar trends of variation with varying rates. Nighttime observations (0000-0300UTC and 1800-2100UTC) also show similar trends. In all months nighttime trends are positive and are much greater than those of the daytime trends. However, in the cold season (January, February and March) and October and almost May the daytime trends are negative. Three main peaks are observed in all trends, one in April and one in August and the one in November. In November, due to short day length, thin mixed layer depth (Bidokhti and Banihashem, 1998), extreme inversions and absence of active synoptic systems, the temperature trends are large and positive for Mehrabad (Tehran). Pollutants which are more abundant in November, especially CO2 high concentration in a thin layer near the ground, can also produce positive trend of temperature (Saadatabadi, 2003), because of its greenhouse effect (Oke et al., 1991). Although, this factor has to be investigated separately, probable reason for different dry temperature trends between 0000 and 0300 h in May, June and July can be due to sunrise at 0300UTC in these months, its positive trend at 0300 UTC is similar to daytime trend but it is less than that of nighttime trend.
 | |
| Fig. 8: | Trends of hourly averaged daily temperatures in Mehrabad, during the period 1951-2000. (a) 00_03 UTC, (b) 18_21 UTC, (c) 06_09 UTC and (d) 12_15 UTC. D: Dry temperatures, W: Wet bulb temperatures UTC: Hours (about 3 and half hour time lag with local time) |
 | |
| Fig. 9: | Monthly mean water consumption in Tehran for 6 years (1998 and 2003) |
Wet bulb temperature trends in warm season are also higher than the dry temperature trends especially for daytimes. This may be because in warm seasons, lots of evaporative air conditioners cooler use water for cooling houses, placed on rooftops, add a lot of water vapor in to sub layers of the atmosphere in urban area. Figure 9 shows monthly mean daily consumed water for Tehran for 6 years (1998 and 2003, the only records available) and it reaches its highest rate in July and August (about 30% higher than the annual average). So, if we assume that there is an increase in water consumption due to water cooler in summers as this, in the years of study, the evaporation by water coolers may be the main reason for the increase of water consumption; hence, larger wet bulb temperature trends are expected in these months. There is an overall similarity between the rate of water consumption and the wet bulb temperature trends (Fig. 8, 9) in summer, indicating the possible correlation between the two. After August, due to weakening of heat low over this area, the dry temperature trend decreases and hence the wet bulb temperature trend tends to increase.
Some wind speed records: As wind speed has a large effect on temperature of near surface air (Landsberg, 1981) here we consider the available wind speed records. Wind speed varies with the synoptic systems and is usually larger during the time of front passages and is small when high pressure systems are present with clear skies. The latter is usually the case most of the time for Tehran, as mentioned earlier, in which mountain winds prevails.
High terrain in North and East of Tehran, usually prevents enough ventilation of the city, but katabatic winds mix cold and warm air (reduce UHI) and may cause partial ventilation. A long-term trend in components of wind speed for Mehrabad (Tehran) is shown in Fig. 10. Figure 10 shows the time series of annual mean u (positive for Westerly flow) and v (positive for southerly flow) components, for Mehrabad at 0300, 0900 and 2100 UTC. It shows that the night time v component (03 UTC) has decreased significantly; while the u component and also daytime v component show no long term trends (Table 4). This is a further indication that the increase in built up area, especially in the Northern part of the city may have hampered the katabatic winds in reaching the inner areas of the city. Closer examination of the record shows inter-variability in time periods, especially in seventies when DAmmin(u-r) shows a steady increase with time (Fig. 3), while the katabatic wind increases, probably a thermodynamic effect (larger temperature contrast between mountain and city at night).
| Table 4: | Mean, standard deviations and trends of mean annual Northerly and Westerly surface winds at Mehrabad station for 1952-2000 at the 03 local time (early morning) |
 | |
| When p = 0.05 there is statistical significance for the trend and shown in bold | |
 | |
| Fig. 10: | Time series of annual mean wind speed components (u and v) at Mehrabad during the period (1951-2000) for day and night times |
However from early eighties the katabatic wind has been reduced with time, probably indicating surface roughness increase due to city expansion and also limitation of the katabatic wind intrusion into this area (Mehrabad). The highest decrease has occurred during the eighties that are coincident with the rapid development of the city especially in the West and North (Fig. 1b). It should be mentioned that the upper air wind records do not show any substantial trend (the records are not shown).
Topographic induced drainage flows at nights and thermal breeze circulation may partially cancel the urban heat island in mountainous city as Tehran. The cold drainage flows at nights could strengthen the urban-mountain circulation and hence reduce the temperature difference and provide a built-in limit to further urban heat island growth. Part of the leveling off of the trend of DAmmin(u-r) in Fig. 3 for the early nineties may be a result of such a process in this case. The study of such circulation is presently being pursued. So far this has indicated that the flow regime near the surface in Tehran is often terrain driven at nights and mornings with, respectively Northerly and southerly winds, but the afternoon wind often follows the flow in free atmosphere above the urban atmospheric boundary layer, as Banta and Cotton (1981) have also found. Such winds also do the ventilation of the urban air.
As mountains almost surround the city and the central part is in a basin like area, the cold drainage flows from these mountains can enhance nocturnal cooling. Kondo and Okusa (1990) have shown that the nocturnal cooling can be larger by about 20% by this mechanism. The cooling could be up to a few degrees more than that purely by radiation, but correct figures needs further work for this area.
Population: Population (as an urbanization index) of Tehran has increased during this period; excluding the suburban areas, population of the main central area of the city has increased from about one million in early 50s to about ten millions in 2000. As was shown, Tmin is more sensitive to urbanization, the annual mean of difference in monthly averaged Tmin between that of Mehrabad (Tehran) and that of Varamin (as kind of urban heating effect) DAmmin(u-r) has been plotted against population for the whole period of study (1956-1996) for years that the populations were available and shown in Fig. 11. Here, the data from the months that there are significant statistical trends in Tmin for Varamin as summer months and November (Table 3) or the month with no significant statistical trend in Tmin for Mehrabad (February) were discarded. There is a positive correlation between DamTmin (u-r) and the population in this period and the following relation can be fitted to the data.
This may be called a climatic kind of heat island intensity relationship and is different from the relationship usually determined for other big cities of the world. The UHIs are related to the population of a city and have been studied extensively via direct observation (Oke, 1973). Observational results, using a population as a surrogate for degree of urban development, suggest a relationship between the maximum urban-rural temperature difference (ΔTu–r(max)) and population of: It is obvious from these studies that the UHI effect on trends in the historical record, primarily observed in the minimum temperature, is much less than the experimentally observed maximum UHI effect.
 | |
| Fig. 11: | Mean urban-rural (Mehrabad-Varamin) relation differences in mean daily minimum temperatures and logarithm of population of Tehran from 1956 to 1996 |
 |
In this study, long-term historical data from urban and rural sites were used to estimate some of the urban influences on the mean minimum temperatures, hence the UHI was climatically investigated. The correlation is surprisingly similar to the UHI-population relationship of North American cities (Oke, 1973). In fact the geometry of the internal setting of the city is more similar to some of those of North American cities.
It should be pointed out that Mehrabad station of which its data have been used here, is somewhat off the central part of the Tehran greater city, hence larger urban effect than this may be expected for the central parts, for which we do not have any data. Also, there may be some uncertainties in the DamTmin (u-r) trend due to Varamin being in environ of Tehran especially since 1990s as Tehran has grown substantially in recent years. Although, the data for the months suspected of this effect (summer months with statistical significance in MmTmin) have been discarded.
There is also inter-variability in this trend, which corresponds to the changes in Fig. 3 (DAmTmin(u-r) trend). Considering the population change for Tehran and Varamin as shown in Fig. 12, we see that prior to 1970 the population of Varamin shows a very small increase while Tehran large a steeper trend. After 1970 Tehran population has increased substantially until mid 80ties after which it tends to level off. However the population of Varamin increases, especially after 1986, leading to some UHI effect at that site (Fig. 12 shows the actual population of the two cities). In fact after 1995 the climate station of Varamin has been moved to a new site and also changed to a synoptic one (hence we did not have data from the old Varamin station after that time). This may explain the leveling off of DAmTmin(u-r) after 1986 (Fig. 3), although mountains induced winds may be important, as mentioned earlier.
 | |
| Fig. 12: | The population verification for Tehran and Varamin during the period of study |
Oke (1981) has shown that the geometry of the internal setting of the city is a major factor controlling the urban heat island and when a city attains a large heat island the urban/rural temperature gradient often becomes sufficient to induce a convergent thermal breeze circulation. This circulation can also regulate the urban heating (Haeger-Eugensson and Holmer, 1999). In this case, the mountain winds may influence such circulation that requires further study.
CONCLUSIONS
In this study we attempted to detect and quantify evidences of climatic change due to rapidly urbanization in Tehran. The study of recent temporal temperature changes indicates remarkably different annual and seasonal trends over a long observation period (1956-1995), in city (Mehrabad) and rural (Varamin). Seasonal and annual maximum air temperature records do not show clear trends, but seasonal and annual minimum temperatures remarkably have increased in Mehrabad, while the annual range of temperature have decreased. The result of urban warming rate for Mehrabad (Tehran) indicates a mean value of 0.65°C/decade which is close to that of big industrial cities defined in scientific literatures. The SmTmin trends were positive in all seasons and its maximum value in autumn (0.0827°C year-1) for Mehrabad and in summer (0.0272°C year-1) for Varamin. The SmTmin trends for Mehrabad have the lowest values in winter, (but at the same time about 5.6 times larger than that of Varamin for this season). Comparing the MmTmin trends in two 20 years periods shows that the increase in trends has been much larger in second period (especially for 1971-90) which corresponds well with urban development, especially in the West and North of Mehrabad station.
DamTmin of Tehran and Varamin, a representation of the climatic effect of urban heat island, is positively correlated with population. The population of the main city of Tehran, excluding the suburban areas, has been used here as an urbanization index. This climatic urban heat island effect may be larger for the inner city area, as Mehrabad station is somehow on the margin of Tehran.
The trends of wet bulb temperature based on three hours averages show larger positive values in warm season. This corresponds well with increase in evaporation from rooftop water coolers, especially for daytime hours, based on the increase of city water consumption in this season.
Nocturnal drainage flows from the Northern part of mountainous area may weaken the urban heat island effect of Tehran, as it was shown that such flows exist most of the nights during the year. While urban development seems to have reduced the Northerly katabatic wind in Mehrabad. That is probably related to the expansion of built-up areas towards West and North that may have hampered the intrusion of the katabatic winds into this area.
As the built-up area of the city is not uniform and rather patchy especially around the city the pattern of heat island is expected not be regular, but with a few centers. The mountain winds from the Northern part of the city may also contribute to the complex pattern of the temperature field in this large spread-out city. Hence, defining a maximum urban-rural temperature difference may not be easy. Presently, we are about to undertake a project of detail measurement of temperature over the city and around it. This would reveal some details of actual UHI intensity and its non-uniformity. Present results however, show average trends, indicating local climate change due to rapid urbanization especially since the early 1970s in the West and North of Tehran.
Changes in temperature will have significant impacts on biodiversity and food security. Development of megacities in developing countries without a balanced development strategy can cause many harmful effects on environment. To reduce and overcome problems caused by harmful effects of urbanization on climate, based on the results obtained from this study, the followings are recommended.
There is a strong need to study regional and local scale climate capacities of related environment and anticipated future interactions between the environment and other probable effects.
Later, on the planning phase, having a sustained climate in future should be an important issue in mind to be reflected in planning the buildings, size and direction of streets, location of industrial zones, transportation systems and consumption of fossil fuels and many other important factors affecting the city environment.
ACKNOWLEDGMENTS
Authors are grateful to Dr. Irannejad for his valuable comments on the early draft of this study. Authors also acknowledge IRof Iran Meteorological Organization (IMO), Tehran municipality and water supply authority of Tehran for providing the data.
REFERENCES
- Banta, R. and W.R. Cotton, 1981. An analysis of the structure of the local wind systems in a broad mountain basin. J. Applied Meteorol., 20: 1255-1266.
CrossRef - Bitan, A. and H. Sa`aroni, 1992. The horizontal and vertical extension of the Persian Gulf pressure trough. Int. J. Climatol., 12: 733-747.
CrossRef - Bornstein, R.D., 1968. Observation of the urban heat island effect in New York City. J. Applied Metorol., 7: 575-582.
CrossRef - Comrie, A.C., 2000. Mapping a wind- modified urban heat island in Tucson, Arizona (with comments on integrating to search and undergraduate learning. Bull. Am. Meteorol. Soc., 81: 2417-2431.
Direct Link - Cotton, W.R. and R.A. Pielke, 1995. Human Impacts on Weather and Climate. Cambridge University Press, Cambridge, ISBN-13: 9780521499293.
CrossRefDirect Link - Eliasson, I. and B. Holmer, 1990. Urban heat island circulation in Goteborg, Sweden. Theor. Applied Climatol., 42: 187-196.
CrossRef - El-Gammal, M.I., M.S. Ibrahim, A.A. Shakour and R.S. El-Henawy, 2008. Precipitation quality and related atmospheric chemistry over the greater damietta area-Egypt. Res. J. Environ. Sci., 2: 252-265.
CrossRefDirect Link - Gedzelman, S.D., S. Austin, R. Cermake, N. Stefano, S. Partridge, S. Quesenberry and D.A. Robinson, 2003. Mesoscale aspects of the urban heat island around New York City. Theor. Applied Climatol., 75: 29-42.
Direct Link - Haeger-Eugensson, M. and B. Holmer, 1999. Advection caused by the urban heat island circulation as a regulating factor on the nocturnal urban heat island. Int. J. Climatol., 19: 975-988.
Direct Link - Jauregvi, E. and E. Romales, 1996. Urban effects on convective precipitation in Mexico city. Atmos. Environ., 30: 3383-3389.
CrossRef - Karl, T.R., H.F. Diaz and G. Kukla, 1988. Urbanization: Its detection and effect in the United States climate record. J. Climate., 1: 1099-1123.
CrossRef - Karl, T.R., P.D. Jones, R.W. Knight, G. Kukla and N. Plummer et al., 1993. A new perspective on recent global warming: Asymmetric trends of daily maximum and minimum temperature. Bull. Am. Meteorol. Soc., 74: 1007-1023.
CrossRef - Karaca, M., M. Tayance and H. Toros, 1995. Effects of urbanization on climate of Istanbul and Ankara. Atmos. Environ., 29: 3411-3421.
CrossRef - Kondo, J. and N. Okusa, 1990. A simple numerical prediction model of nocturnal cooling in a basin with various topographic parameters. J. Applied Meteorol., 29: 604-619.
Direct Link - Kukla, G., J. Gavin and T.R. Karl, 1986. Urban warming. J. Clim. Applied Meteorol., 25: 1265-1270.
Direct Link - Lowry, W.P., 1977. Empirical estimation of urban effect on climate: a problem analysis. J. Applied Meteorol., 16: 129-135.
CrossRef - Manabe, S., T.R. Knutson, R.J. Stouffer and T.L. Delworth, 2001. Exploring natural and anthropogenic variation of climate. Q. J. Roy. Meteorol. Soc., 127: 1-24.
CrossRef - Montavez, J.P., A. Rodriguez and J.I. Jimenez, 2000. A Study of the urban heat island of Granada. Int. J. Climatol., 20: 899-911.
CrossRef - Morris, C.J.G. and I. Simmonds, 2000. Associations between varying magnitudes of the urban heat island and synoptic climatology in Melbourne, Australia. Int. J. Climatol., 20: 1931-1954.
Direct Link - Oke, T.R., 1981. Canyon geometry and the nocturnal urban heat island: Comparison of scale model and field observations. Int. J. Climatol., 1: 237-254.
CrossRef - Oke, T.R., 1982. The energetic basis of the Urban Heat Island. Q. J. R. Meteorol. Soc., 108: 1-24.
Direct Link - Oke, T.R., G.T. Johnson, D.G. Steyan and I.D. Watson, 1991. Simulation of surface urban heat islands under ideal conditions at night Part 2: Diagnosis of Causation. Boundary Layer Meteorol., 56: 339-358.
CrossRefDirect Link - Rozoff, C.M., W.R. Cotton and J.O. Adegoke, 2003. Simulation of St. Louis, Missouri, land use impacts on thunderstorms. J. Applied Meteorol., 42: 716-738.
Direct Link - Shreffler, J.H., 1978. Detection of centripetal heat-island circulations from tower data in St Louis. Boundary layer Meteorol., 15: 229-242.
CrossRef - Soltani, E. and A. Soltani, 2008. Climatic changes of Khorasan, North-East of Iran, during 1950-2004. Res. J. Environ. Sci., 2: 316-322.
CrossRefDirect Link - Tumanov, S., A Stain-Sion, A. Lupu, C. Soci and C. Oprea, 1999. Influences of the city of Bucharest on weather and climate parameters. Atmos. Environ., 33: 4173-4183.
CrossRef - Yague, C., E. Zurita and A. Martinez, 1991. Statistical analysis of the madrid heat Island. Atmos. Environ., 25: 327-332.
CrossRef