
M.A.M. Razi
Faculty of Civil and Environmental Engineering, Universiti Tun Hussein Onn Malaysia, 86400 Parit Raja, Batu Pahat, Johor, Malaysia
J. Ariffin
Flood-Marine Excellence Centre, Institute for Infrastructure Engineering and Sustainable Management, Faculty of Civil Engineering, Universiti Teknologi MARA, 40450 Shah Alam, Selangor, Malaysia
W. Tahir
Flood-Marine Excellence Centre, Institute for Infrastructure Engineering and Sustainable Management, Faculty of Civil Engineering, Universiti Teknologi MARA, 40450 Shah Alam, Selangor, Malaysia
N.A.M. Arish
Faculty of Civil and Environmental Engineering, Universiti Tun Hussein Onn Malaysia, 86400 Parit Raja, Batu Pahat, Johor, Malaysia
Journal of Applied Sciences
Year: 2010 | Volume: 10 | Issue: 11 | Page No.: 930-939


ABSTRACT
This study presented a flood estimation model for Johor River in Kota Tinggi watershed, Malaysia using HEC-HMS (Hydrologic Modeling System). Calibration and validation processes were carried out using different sets of data. Evaluation on the performance of the developed flood model derived using HEC-HMS yield a correlation coefficient R2 close to 1. The simulated Qpeak are 150.9 m3 sec-1, while the observed Qpeak for 10 years record (1997-2006) is 145.12 m3 sec-1. The percentage of error values are 4% and the performance of the developed flood model derived using the HEC-HMS with R2 value is 0.905. Based on these findings, it is suggested that the developed model using HEC-HMS can be used as a tool for estimating Qpeak .
PDF Abstract XML References Citation
How to cite this article
M.A.M. Razi, J. Ariffin, W. Tahir and N.A.M. Arish, 2010. Flood Estimation Studies using Hydrologic Modeling System (HEC-HMS) for Johor River, Malaysia. Journal of Applied Sciences, 10: 930-939.
DOI: 10.3923/jas.2010.930.939
URL: https://scialert.net/abstract/?doi=jas.2010.930.939
DOI: 10.3923/jas.2010.930.939
URL: https://scialert.net/abstract/?doi=jas.2010.930.939
INTRODUCTION
Malaysia is blessed with abundance of rainfall that contributes to an average of 2000-4000 mm a year. With the exception of extreme events, the annual average may exceed the above average. The consequences are several areas are inundated during the monsoon periods (Suhaila and Jemain, 2007).
Seasonal floods normally occur during the North-East Monsoon season between Novembers to March while Southwest Monsoon occur from May to September. The two inter-monsoon period, in April and October are generally characterized by variable wind and thunderstorm in the afternoon (Lawal et al., 2004). Historically, the frequencies of serious flood events reoccur every three years.
The cause of flooding in Malaysia is the incidences of heavy rainfall and large concentration of runoffs. Various flood forecasting and warning systems using advanced hydraulic and hydrological models were used in Malaysia, but were proved to be inadequate in terms of their ability to predict impending floods (Chan, 1997). In recent years, impacts of extreme events in Malaysia have been very much highlighted. For example, in December 2006, some parts of Malaysia were badly hit by flooding which caused most of the areas under water. Flooding is the most commonly occurring form of natural disaster and it includes both river flooding and coastal flooding. Floods often cause tremendous damage to agricultural land and infrastructure such as roads, bridges and buildings.
The flood estimation that involves the development of hydrologic models is one of the non-structural measures that may help to reduce the amount of damages incurred. Hydrologists are continuously improving the capability of hydrologic models to predict accurately the frequency of flood events in a changing climate (Pamela, 1992; Lawal et al., 2004; Knebl et al., 2005; Yener et al., 2006; Yonatan et al., 2009).
In view of the above and severity of the damages caused by extreme events, it is therefore necessary to establish a hydrologic model to simulate flood levels. This is very much necessary for the identification of possible inundated areas, so that a timely warning can be issued to the people in the affected areas. Therefore, it is timely to have more comprehensive scientific understanding of the effects of this ecosystem on the environment, particularly the hydrological regimes. Such information is crucial for the effective and improved management of water and other catchment resources.
As a means of evaluating this approach, a feasibility study has been completed on the Johor River at Kota Tinggi watershed in Johor, Malaysia. HEC-HMS was run with the historical rainfall data in order to provide a flood level evaluation entering a catchment on the Johor river. The results of this study are presented in this study, which starts with an overview of the methodology used in HEC-HMS runoff studies. After describing the computer models HEC-HMS that are used in the study, a description of the Johor river watershed used in the case study is presented, including its representation in HEC-HMS. Results of the study are then presented and discussed. The study presents the flood level characteristics and results of hydrograph modeling for a Kota Tinggi catchment.
MATERIALS AND METHODS
Kota Tinggi catchment in Johor, Malaysia is the largest district with an area of approximately 3,490 km2. Three rivers namely Sungai Johor, Sungai Semangar and Sungai Lebak have been selected to be the study site. Sungai Johor has a drainage length of 122.7 km that covers an area of 2,636 km2. It originates from Mount Gemuruh that flows through the South-Eastern part of Johor and finally into the Straits of Johor. The major tributaries are Sayong, Linggiu, Tiram and Lebam rivers. About 60% of the catchment is undulating highland rising to a height of 366 m while the remainder is lowland and swampy. The highland in the north is mainly jungle. In the south a major portion had been cleared and planted with oil palm and rubber. Reference is made to the Soil Map of Malaya, for the rate of infiltration and a range of 0.30 to 0.45 in/h were used (Department of Irrigation and Drainage, 2000). The catchment receives an average annual precipitation of 2,470 mm and the temperature in the basin ranges from 21 to 32°C. Figure 1 shows a part of Kota Tinggi watershed. The circled area in Fig. 1a shows the state of Johor which is located in the Southern part of Peninsular Malaysia and the circle area in Fig. 1b shows the district of Kota Tinggi, Johor. Figure. 1c shows the Kota Tinggi watershed area where this study was carried out.
Rainfall and runoff of 10 year period from 1997 to 2006 at Rantau Panjang streamflow gauging station and Ladang Pekan in Kota Tinggi rainfall station which is located in the upstream of Johor River are obtained from Department of Irrigation and Drainage, Malaysia (DID). Rainfall was measured by a manual tipping bucket rain gauge which records daily rainfall. The water level was measured continuously using automatic streamflow recorder. Table 1 shows the name and station number.
| Table 1: | Streamflow and rainfall stations in Kota Tinggi area |
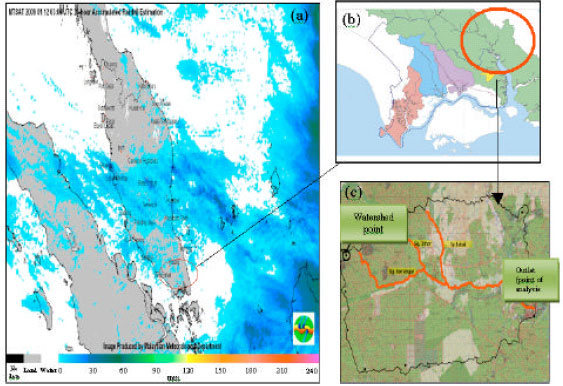 | |
| Fig. 1: | (a-c) Kota Tinggi watershed area map |
In this study, the river gauging station at Rantau Panjang, Kota Tinggi and the rainfall station at Ladang Pekan are used in the analysis to derive the observed unit hydrographs of Kota Tinggi watershed. Streamflow records and daily rainfall are used to analyze the unit hydrographs.
Total watershed area for Kota Tinggi is about 1130 km2. However, an area of 272 km2 only was taken into analysis. About 58% of the catchment consists of plantation area which is on hills and patches of log over forest towards the north of the watershed. The hydrological soil group for this catchment is group A based on soil composition. The land use of the catchment is mainly palm oil and rubber plantations, the Runoff Curve Number for this catchment are estimated based on weighted Curved Number. For constructing curve-number map (CN), two types of maps, land-use and soil, were used (Noorbakhsh et al, 2005). The land is mainly plantations for the rural areas and primary forest.
For the purpose of derivation of the peak flowrate in the observed 3 h unit hydrographs, tp is calculated first to determine the S value upon obtaining from the topographic maps. The value of CNw can be calculated using Eq. 1-4 with CN values obtained from the standard runoff curve number tables (Bedient and Huber, 1992). The Qpeak value and tR can then be read out from the 3 h unit hydrographs.
| (1) |
| (1a) |
Where:
| S | = | Potential storage |
| CNw | = | Adjusted Curve Number based on local catchment condition |
| cfn | = | Correction coefficient for Curve Number |
| CN | = | Curve Number, based on soil groups and land cover |
| (2) |
Where:
| tR | = | The length of time for the excess rainfall, (hour) |
| k’ | = | Peak Attenuation Factor |
| A | = | Catchment Area (km2 at acre) |
| R | = | Rainfall excess (mm at inch) |
| Qpeak | = | Discharge value for the event (m3 sec-1, at cfs) |
where, tR are shown in Eq. 3:
| (3) |
where, D is duration of excess rainfall, (3 h).
From the SCS Method, the time to peak tp was shown in Eq. 4:
| (4) |
Where:
| tp | = | SCS Lag Time (min) |
| L | = | Length to divide, feet (m) |
| S | = | Potential Maximum retention after runoff begins, inches (mm) |
| Y | = | Average catchments slope (%) |
Therefore, from the observed unit hydrographs, a master 3 h unit hydrograph is obtained and the value of tp, tR and QPeak can be obtained and the corresponding correction coefficient k’ and CN can be calculated for the particular catchment. Once the correction coefficient cfn are determined then the estimation of runoff for different land use can be estimated. By using SCS Unit Hydrograph method and the convolution matrix procedure the required synthetic flood hydrographs are calculated.
PROGRESS AND DEVELOPMENT OF HYDROLOGICAL MODEL: HEC-HMS
The Hydrologic Modeling System (HEC-HMS) is designed to simulate the precipitation-runoff processes of watershed systems. It is designed to be applicable in a wide range of geographic areas to solve the widest possible range of problems. This includes large river basin, water supply and flood hydrology and small urban or natural watershed runoff. In this model, interception, evaporation and infiltration processes in a catchment are determined from loss components while runoff processes are computed as the pure surface routing using transform component (Yusop et al., 2007). The initial and constant methods correspond to the interception and depression storages with an initial loss. All other losses were assumed to follow a constant loss rate.
Hydrographs produced by the program are used directly or in conjunction with other software for studies of water availability, urban drainage, flow forecasting, future urbanization impact, reservoir spillway design, flood damage reduction, floodplain regulation and systems operation. Knebl et al. (2005) integrated different model to forecast flood on a regional scale. The model consists of a rainfall-runoff model (HEC-HMS) that converts precipitation excess to overland flow and channel runoff, as well as a hydraulic model (HEC-RAS) that models unsteady state flow through the river channel network based on the HEC-HMS-derived hydrographs.
The HEC-HMS program is a generalized modeling system capable of representing many different watersheds. A model of the watershed is constructed by separating the hydrologic cycle into manageable pieces and constructing boundaries around the watershed. Any mass or energy flux in the cycle can then be presented with a mathematical model. In most cases, several model choices are available for representing each flux. Zorkeflee et al. (2009) analyzed the impact of land use change to hydrologic behavior of Sungai Kurau Basin and by using the Geographical Information System (GIS) and HEC-HMS model for catchments management. Each mathematical model included in the program is suitable in different environments and under different conditions. Making the correct choice requires knowledge of the watershed, the goals of the hydrologic study and engineering judgment (USACE-HEC, 2006). For example, (Yener et al., 2006) use HEC-HMS in event base hourly simulations and runoff scenarios using intensity duration frequency curves for modeling studies in Yuvacik Basin, Turkiye. In this study, Yuvacýk Basin is selected as the study area and basin parameters (infiltration and baseflow) are calibrated using the rainfall-runoff data of the basin that are collected by 8 rainfall and 3 runoff stations for 2001-2005 period.
In some of the application case, the capabilities of the HEC-HMS for rainfall simulation have been exploited to describe single events on which the rating curves to be estimated were tested. Thus continuous simulation are not performed and modeling is limited to single events (Pistocchi and Mazzoli, 2002). Anderson et al. (2002) used the mesoscale model, MM5, to transfer the Eta forecast data down to the appropriate space and time scales are required to link the Eta model precipitation forecast results to the watershed model, HEC-HMS, for runoff prediction. A number of flood related studies have shown that these models provide accurate and useful results. Kristina and Terri (2008) evaluated the HEC-HMS' ability to simulate discharge in prefire and postfire conditions in a semi arid watershed and the necessary parameterizations for modeling hydrologic response during the immediate and subsequent recovery, period after a wildfire.
In HEC-HMS model, some parameters are required as inputs to simulate the runoff hydrographs. Some of the parameters can be estimated through observation and measurements of stream and basin characteristics (Yener et al., 2006). The method generally uses either an empirically-derived unit hydrograph or some standard shape defined by one or two parameters, such as the time to peak (Pamela, 1992).
After HEC-HMS is applied, the results must be checked to confirm that they are reasonable and consistent with what to be expected. The model parameters are calibrated until the results are favourable with close proximity of the observed and the simulated hydrographs. Calibration is a process to determine the properties or parameters of a system. Some parameters such as initial abstraction, curve number, impervious, lag time, initial discharge, recession constant and ratio are determined through the calibration process where the parameters are adjusted until the observed and simulated hydrographs are close fit. Some parameters such as slope, Manning, n, bottom width, shape and length of river are obtained from topographic map (Zorkeflee et al., 2009). The model parameters obtained will be validated using different sets of events.
In this study, the HEC-HMS model is used to model runoff for Sungai Johor watershed. Data required for the simulation process are present and future landuse, hydrologic soil group, hydrological records, topography map, landuse maps and rainfall data.
RESULTS AND DISCUSSION
Tahir and Ali (2007) reported that the main reason of flooding in Kota Tinggi town is intense rainfall from 17 December to 20 December 2006. Table 2 shows a collection of rainfall in Kota Tinggi catchment on December 2006.
Initial loss, curve number, impervious area, lag time, initial discharge are determined through calibration process where the parameters are adjusted until the observed and simulated hydrographs are close fit. By using soil hydrologic type classifications with soil maps and land use type classification tables with land-use maps, the Curve Number (CN) map was constructed.
| Table 2: | Rainfall in Kota Tinggi catchment for December 2006 |
 | |
| Table 3: | Curve No. value at the Kota Tinggi watershed, Johor, Malaysia. |
 | |
| Table 4: | Parameters used in calibration process |
 | |
Based on the land use and soil cover of the catchment, the curve number is shown in Table 3. From Table 3, it was observed that the adjusted curve number, CNw varies between 0.78 and 35.96 for the potential storage in the catchment.
From Yusop et al. (2007) studies, rainfall and runoff data in two storm event were used to calibrate and validate the HEC-HMS. The shape of the modeled hydrograph generally follows the observed hydrographs. However, the simulated peakflow during calibration and the time to peak during validation were quite different from the observed values.
In this study, the HEC-HMS model is calibrated using a 10 year period data from 1997 to 2006. The model parameter values and the event selected during calibration are shown in Table 4. The calibration process was carried out using different sets of data. This is to confirm the suitability of the assumed values for catchment under study. Figure 2a-f show the generated hydrographs resulted from the calibration process. From the result of the calibration on 10 September to 20 September 2006, the maximum observed flowrate is 192.8 m3 sec-1 and the simulated flowrate is 173.1m 3 sec-1. The calibration process on 10 October to 23 October 2005 yield maximum observed and simulated flowrates of 105.3 and 103.3 m3 sec-1 while the maximum observed and simulated flowrates for the events from 4 November to 13 November 2000 are 52.6 and 52.6 m3 sec-1, respectively.
| Table 5: | Parameters used in the validation process |
 | |
| Table 6: | Parameters used in trial process |
 | |
The results of calibration hydrographs for 23 January to 6 February 1998 yield the maximum observed and simulated flow rates of 81.8 and 79.7 m3 sec-1. The maximum observed and simulated flowrates for 13 March to 24 March 1997 is 95.00 and 83.6 m3 sec-1, respectively. The last event tested on 14 December to 24 December 1997 yield observed and simulated flowrates of 70.2 and 70.3 m3 sec-1.
Validation was carried out to test the robustness of the developed model. The generated hydrograph is compared with the observed flow graph. The calibrated model parameters are validated using daily interval event rainfall of 4 different periods; 8 January 2007-20 January 2007; 4 January 2006-17 January 2006; 12 January 2001-25 January 2001 and 26 September 2001, 6 October 2001. Table 5 shows the parameters derived and validated using different sets of hydrological data.
Figure 3a-d show the simulated hydrographs during the validation process for the discharge station at Ladang Pekan Layang-Layang streamflow gauging station (1835001). In January 2007, the maximum observed flowrate is 267.2 m3 sec-1 and the simulated flowrate is 260.4 m3 sec-1. The validation process on 4 January to 17 January 2006 yield maximum observed and simulated flowrates of 192.8 and 173.1 m3 sec-1 while the maximum observed and simulated flowrates for the events from 12 January to 25 January 2001 are 226.1 and 220.0 m3 sec-1, respectively. The event on 26 September to 6 October was also used to further validate the model. The observed and simulated flowrates were found to be 39.5 and 39.3 m3 sec-1..
The derived parameters are required for flood level simulation and the generation of missing data. Table 6 shows the parameters used in the trial process.
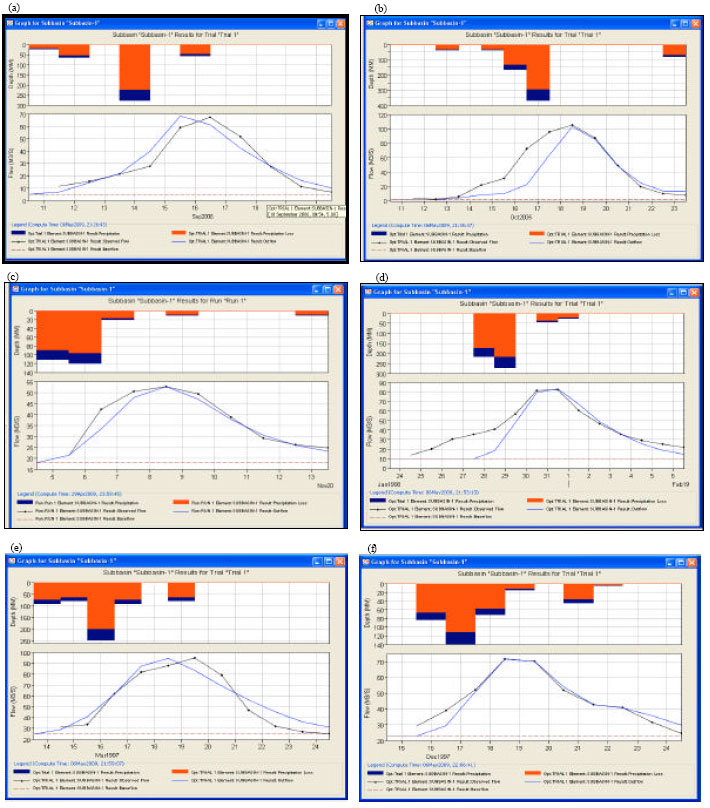 | |
| Fig. 2: | Calibration results (a) 10-20 September 2006, (b) 10-23 October 2005, (c) 4-13 November 2000, (d) 23 January-6 February 1998, (e) 13-24 March 1997 and (f) 14-24 December 1997 |
Figure 4a and b show the simulated hydrographs for the selected events. Table 7 shows the observed and simulated flowrates for the various events using the derived parameters. Trial process was carried out to test the strength of the developed model.
| Table 7: | Observed and Simulated Flowrates obtained during the trial process |
 | |
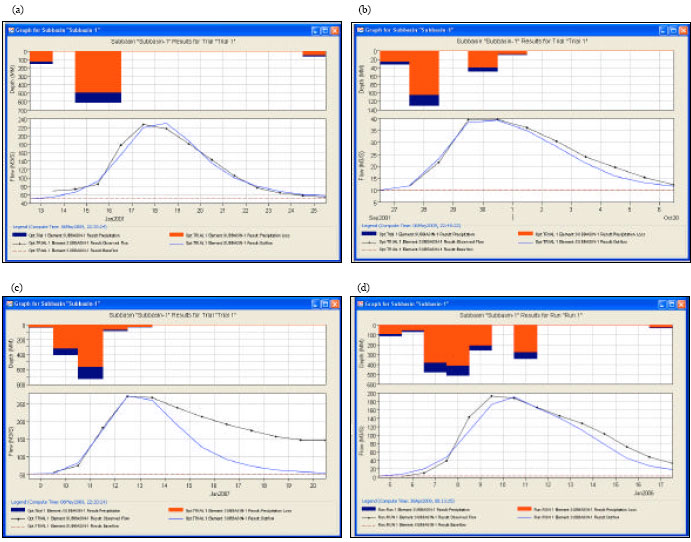 | |
| Fig. 3: | Validation hydrograph result. (a) 8-20 January 2007, (b) 4-17 January 2006, (c) 12-25 January 2001and (d) 26 September-6 October 2001 |
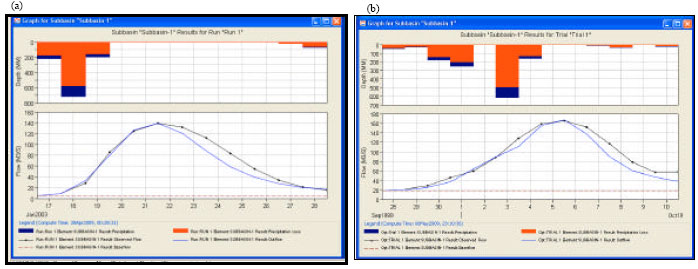 | |
| Fig. 4: | Trial result. (a) 16-28 January 2003 and (b) 27 September-10 October 1999 |
The flowrate data from the events on 16 January to 28 January 2003 had yielded maximum observed and simulated flowrate of 141.0 and 140.8 m3 sec-1, respectively. The last data set from the event of 27 September to 10 October 1999 gave 164.8 and 167.4 m3 sec-1, respectively.
EVALUATION OF THE MODEL THROUGH CORRELATION COEFFICIENT, R2 RESULT
The correlation coefficient indicates the accuracy of a model. The value of one indicates perfect prediction. Graphs of simulated versus observed flows are shown in Fig, 5a-f, 6a-d and 7a, b.
 | |
| Fig. 5: | Graphs of simulated versus observed flows for the following events, (a) 10-20 September 2006, (b) 10-23 October 2005, (c) 4-13 November 2000, (d) 23 January-6 February 1998, (e) 13-24 March 1997 and (f) 14-24 December 1997 (Calibration stage) |
 | |
| Fig. 6: | Graphs of simulated versus observed flows for the following events, (a) 8-20 January 2007, (b) 4-17 January 2006, (c) 12-25 January 2001 and (d) 26 September-6 October 2001 (Validation stage) |
 | |
| Fig. 7: | Graphs of simulated versus observed flow for the following events, (a) 16-28 January 2003 and (b) 27 September to 10 October 1999 (Trial stage) |
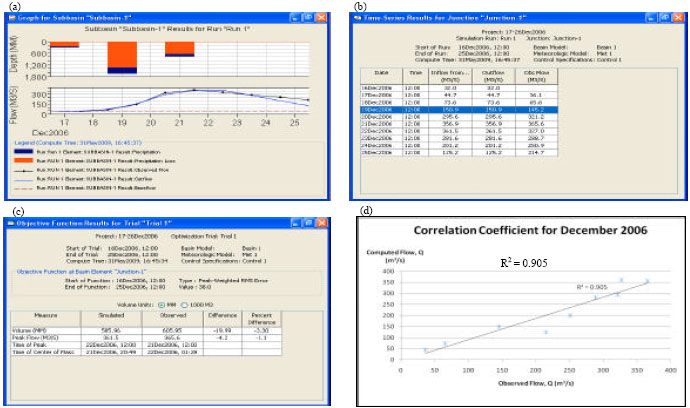 | |
| Fig. 8: | (a) Calibration results of run-off modelling using HEC-HMS (17-25 Dec 2006), (b) Daily unit hydrograph parameters for different storm events, (c) Summary of the flood event result and (d) The evaluation result on the performance using HEC-HMS |
The simulated flow was also plotted against the observed flow on a 1:1 scale. With few exceptions, the points generally fall close to the 1:1 line. HEC-HMS, however, tends to overestimate stream flows on the falling limb. Judging from the high EI values for the calibration, validation trial exercises of 0.9820, 0.9801 and 0.621, respectively, the performance of HEC-HMS for modeling runoff is considered satisfactory.
FLOOD LEVEL EVALUATION
Rainfall and runoff data on the 17th to 25th December 2006 for Kota Tinggi were used in the calibration and validation process. The corresponding storms sizes were 51, 275 and 130 mm, respectively. The model parameters values obtained were based on a storm event of 19 December 2006 that corresponds to a much higher flood event. This is shown in Table 8. All parameters were selected based on the topography and the historical flow data of Kata Tinggi catchment. Figure 8a shows a strong indication that the simulated hydrographs follow the trend of the observed hydrographs. But it should be noticed that the time to peak is lagged by one day for calibration and validation. Figure 8b shows the daily Unit Hydrograph parameters for different storm events and Fig. 8c gives the summary result of the flood events for Kota Tinggi watershed. Figure 8d shows the performance of the parameters for different storm events, (c) Performance of the derived model yields a correlation value of 0.905.
| Table 8: | Parameters used in modeling |
 | |
The derived model was verified using the event of 19 December 2006. Results have shown that there is a discrepancy of only 4.0% with the observed and simulated flowrate of 145.3 and 150.9 m3 sec-1, respectively.
CONCLUSION
Based on the results and data confirmation, HEC-HMS can be a reliable tool to model river flows. Selected model parameters are calibrated to obtain the most appropriate values for the study site. The model performance of the derived model yield coefficient values close to 1.0. Results of analysis have also found that HEC-HMS can also be used to generate missing data and estimate flood from rainfall data. In conclusion, the derived model using HEC-HMS can be used as a tool to predict flood levels, flowrates as well as for design purposes.
ACKNOWLEDGMENT
The authors would like to thank the Ministry of Higher Education Malaysia, Department of Irrigation and Drainage Malaysia, University Tun Hussein Onn Malaysia under Grant No. 566 and Universiti Teknologi MARA for the support of this research.
REFERENCES
- Billa, L., S. Mansor and A.R. Mahmud, 2004. Spatial information technology in flood early warning system: An overview of theory, application and latest developments in Malaysia. J. Disaster Prevention Manage., 13: 356-363.
CrossRef - Chan, N.W., 1997. Increasing flood risk in Malaysia: Causes and solution. J. Disaster Prevention Manage., 6: 72-86.
CrossRef - Cydzik, K. and T.S. Hogue, 2008. Modeling postfire response and recovery using the Hydrologic Engineering Center Hydrologic Modeling System (HEC-HMS). J. Am. Water Resour. Assoc., 45: 702-714.
CrossRef - Anderson, M.L., Z.Q. Chen, M.L. Kavvas and A. Feldman, 2002. Coupling HEC-HMS with atmospheric models for prediction of watershed runoff. J. Hydrol. Eng., 7: 312-318.
Direct Link - Yusop, Z., C.H. Chan and A. Katimon, 2007. Runoff characteristics and application of HEC-HMS for modelling stormflow hydrograph in oil palm catchment. Water Sci. Technol., 56: 41-48.
Direct Link - Naden, P.S., 1992. Spatial variability in flood estimation for large catchments: The exploitation of channel network structure. Hydrol. Sci. J., 37: 53-71.
CrossRef - Knebl, M.R., Z.L. Yang, K. Hutchison and D.R. Maidment, 2005. Regional scale flood modeling using NEXRAD rainfall, GIS and HEC-HMS/RAS: A case study for the San antonio river basin summer 2002 storm event. J. Environ. Manage., 75: 325-336.
CrossRef - Zorkeflee, A.H., H. Nuramidah and S.Y. Mohd, 2009. Integrated river basin management (IRBM): Hydrologic modelling using HEC-HMS for sungai kurau basin, Perak. Proceedongs of the International Conference on Water Resources, (ICWR'09), River Basin Management Society, pp: 1-7.
Direct Link - Bahat, Y., T. Grodek, J. Lekach and E. Morin, 2009. Rainfall-runoff modeling in a small hyper-arid catchment. J. Hydrol., 373: 204-217.
CrossRef - Noorbakhsh, M.E., M.B. Rahnama and S. Montazeri, 2005. Estimation of instantaneous unit hydrograph with clark's method using GIS techniques. J. Applied Sci., 5: 455-458.
CrossRef - Suhaila, J. and A.A. Jemain, 2007. Fitting daily rainfall amount in malaysia using the normal transform distribution. J. Applied Sci., 7: 1880-1886.
CrossRefDirect Link