
H. Sofiah
Department of Engineering Science, Faculty of Science and Technology, University Malaysia Terengganu, 21030 Kuala Terengganu, Malaysia
A. Nora`aini
Department of Engineering Science, Faculty of Science and Technology, University Malaysia Terengganu, 21030 Kuala Terengganu, Malaysia
M.A. Marinah
Department of Chemical Sciences, Faculty of Science and Technology, University Malaysia Terengganu, 21030 Kuala Terengganu, Malaysia
Journal of Applied Sciences
Year: 2010 | Volume: 10 | Issue: 24 | Page No.: 3325-3330


ABSTRACT
In this study, the effects of polymer concentrations on the morphology and performance of ternary mixtures of polyethersulfone/N-methypyrolidone/water membrane dope solution were investigated. Three dopes with different polymer concentrations (13% [UF13], 15% [UF15] and 17% [UF17] polyethersulfone) were prepared via simple dry/wet phase-inversion technique. The membranes were characterised in terms of permeability coefficient, membrane morphology, Molecular Weight Cut-off (MWCO) and membrane surface. Separation performance of lysozyme show that the optimum transmissions at pressure of 3 bars for UF13, UF15 and UF17 membranes were 95.1, 97.4 and 46.2%, respectively and optimum flux were 105x10-6, 10.4x10⁻⁶ and 1.6x10⁻⁶ m3/m2 sec, respectively. As polymer concentration increased, the morphology of membranes also changed from a large finger-like structure to a thin finger-like structure with the presence of sponge-type and macrovoids. UF15 membrane was selected as the optimum membrane since it was able to promote the highest lysozyme transmission together with appropriate flux. Its characteristics as a negatively-charged membrane, with zeta potential of -62 mV and MWCO around 43 kD was provided great evidence for its suitability in the lysozyme separation process. This study demonstrated that the polymer concentration highly influenced the performance and morphology of UF membranes which in turn exhibited an improvement in separation ability.
PDF Abstract XML References Citation
Received: June 06, 2010;
Accepted: July 06, 2010;
Published: October 19, 2010
How to cite this article
H. Sofiah, A. Nora`aini and M.A. Marinah, 2010. The Influence of Polymer Concentration on Performance and Morphology of Asymmetric Ultrafiltration Membrane for Lysozyme Separation. Journal of Applied Sciences, 10: 3325-3330.
DOI: 10.3923/jas.2010.3325.3330
URL: https://scialert.net/abstract/?doi=jas.2010.3325.3330
DOI: 10.3923/jas.2010.3325.3330
URL: https://scialert.net/abstract/?doi=jas.2010.3325.3330
INTRODUCTION
Condition parameters of dope preparation and membrane fabrication provide a significant role in determining a good structure of asymmetric membrane and consequently the membrane performance. Membrane formulation greatly influenced the UF membrane at the first stage of membrane-making. This factor can alter the membrane morphology, pore size, thickness, molecular weight cut-off and membrane surface charge (Mark and Chellam, 1999). Composition of the polymer in membrane solution will affect the performance of the resultant membrane as it plays a role in improving macrovoid structure and thickness. Both separation performance and permeate flux of ultrafiltration membrane are conceptually related to its pore size. An optimum transmission can be obtained whenever the size of the solute is smaller relative to the pore size of the membrane.
Used of a more concentrated polymer has led to the production of a higher concentration of dope at the bimodal-phase separation point. Thus, a denser spongious structure will form as well as a lesser possibility of solvent extraction occuring from the surrounding polymer solution to the polymer-lean phase during the formation of the macrovoids. The pore structure of the skin formed on the face in contact with water was also changed in the same way. A skin will form at the first instant of the coagulation bath-casting dope contact and limit the process of diffusion of non-solvent in and solvent out from the layer beneath. As the diffusion rates are much lower at low temperatures, the macrovoids have longer time to grow in size and number according to nucleation-growth-coalescence process. During the gelling process, the viscoelastic properties of the polymer-solvent gel system control the thickness variation in an originally perfect flat film (Blancoa et al., 2006). When the casting solution comes into contact with the non-solvent in the coagulation bath, a rapid outflow of the solvent from the casting solution to the coagulation bath causes higher-concentration polymer molecules to be aggregated at the top layer (Chakrabarty et al., 2008). A lower polymer concentration and strong interaction between water and PES results in the growth of a thin polymer layer (Wang et al., 1993). Water is claimed to be a strong non-solvent for PES polymer and the coagulation process will occur faster when the polymer solution is brought into contact with water and the finger-like structure formed. Large finger-like macrovoids are generally formed when the coagulation process is faster, whereas the slow coagulation rate results in a porous sponge-like structure (Kesting, 1985).
To date, membrane properties have been tailored and adjusted to the specific task in order to enjoy numerous industrial applications with their advantages, including separation and purification of protein molecule. Lysozyme is one of the most significant proteins which achieves a great interest in biotechnology research and industries. It is known as the smallest protein in egg albumin with the concentration that make up approximately 3.4% of total eggs white protein (Ghosh and Cui, 2000). Lysozyme is a single polypeptide chain protein with molecular weight of 14,700 Da and is cross-linked by four disulfide bonds. Lysozyme has a special property as an antibacterial agent which can hydrolyse the peptidoglycan of Gram-Positive Bacterial cell walls.
The aim of this study was to investigate the effect of polymer concentration on the performance and morphology of asymmetric UF membranes. The suitability of three membranes formulations from 13, 15 to 17 wt.% for the separation of lysozyme were assessed using lysozyme single solution. The prepared membranes were evaluated and characterised in term of pure water permeability, membranes morphology, molecular weight cut-off, membrane zeta potential and lysozyme separation performance.
MATERIALS AND METHODS
Materials: All materials used were of analytical grades. Membranes were fabricated from a ternary casting solution which consisted of polyethersulfone (Merck) as polymer, N-methyl-2-pyrrolidone (NMP) (Merck) as a solvent and water as a non-solvent. Lysozyme (Mw = 14 700 Da) (Sigma Aldrich) has been used for the evaluation of membrane performance.
Membrane preparation: Membranes were prepared using three different ternary dope formulations of casting solutions as shown in Table 1. Asymmetric UF membranes were fabricated via phase-inversion techniques using semi-automated electrical casting machine at an approximately constant shear rate of 200 sec-1.
| Table 1: | Ternary dope formulation |
 | |
Distilled water was used as the first coagulation bath to induce the polymer precipitation for about 24 h. Subsequently, the membrane was immersed in methanol (Merck) for about 8 h to ensure the excess solvents were totally removed and to strengthen the molecular structure build in the membrane. The membrane was dried at room temperature for 24 h before use.
Membrane characterization
Permeation with pure water and lysozyme: All permeation experiments were carried out using dead end cells with 300 mL processing volume and effective permeation membrane area of 14.6. Distilled water was used for pure water permeation to obtain pure water permeability and to ensure the membrane stability. For lysozyme permeation, 500 mg L-1 lysozyme solution was prepared in sodium chloride (0.1 M) at room temperature. Feed pressure was controlled in the range of 1 to 5 bars by using compressed nitrogen and 10 mL of permeate was collected. The absorbance of feed, permeate and retentate of lysozyme permeation were analysed by UV-Vis spectrophotometer (HU-2000) at wavelength 280 nm. The average data of three replicates were reported.
Membrane morphology: Scanning Electron Microscopy (SEM) (JSM P/N HP475 model) has been used to inspect the cross section of the fabricated membranes. For this purpose, the membrane samples were fractured in liquid nitrogen and sputtered with gold, before observation under microscope.
Molecular weight cut- off: A series of protein (myoglobin [17 kD], ovalbumin [40 kD], Pepsin [35 kD] and BSA [66 kD]) with different molecular weights were used for rejection study to determine the molecular weight-cut off of the fabricated membranes. The permeation experiment was carried out at constant pressure, 3 bars. Feed and permeate concentrations were analysed using UV-vis spectrophotometer at wavelength 280 nm. Percentage of rejection was calculated using Eq. 1.
| (1) |
where, Cp and Cf are the concentration of permeate and feed, respectively.
Membrane zeta potential: Zeta potential was measured using Electro Kinetic Analyser (EKA) (Anton Paar Gmbh
Graz, Austria). The conductivity Dip-in-cell was calibrated before use. The membrane sheets were cut into a rectangular size (12.8x5.1 cm) and mounted on the measuring cell. Before measurement, EKA was rinsed with potassium chloride buffer (0.01 M) to remove the bubbles from the sample and results were analysed using Visiolab software.
RESULT AND DISCUSSION
Membrane characterization
Permeability coefficient: Pure water permeation has been implemented for all fabricated membranes at five different pressures from 1 to 5 bars. The graph of filtrate flux versus pressure for different polymer concentrations of UF membrane is displayed in Fig. 1.
All membranes show linear function for increased of applied pressure from 1 to 5 bars and this profile was followed the Hagen-Poiseuille equation which stated that the water flux incensement is proportional to the increase of applied pressure.
| (2) |
where, J is defined as the water flux through the membrane at a driving force of ΔP/Δx; ΔP is the pressure difference (N m-2) and Δx the membrane thickness (m). The proportionality factor contains the pore radius, r (m), the liquid viscosity is ή (P.a.s), the surface porosity of the membrane is ε (nπr2/surface area) and the tortuosity factor is τ.
Table 2 shows the permeability and regression coefficient of the three in-house fabricated membranes. UF13 presents the greatest permeability coefficient which was 44.31x10⁻⁶ m3 m-2 sec.
| Table 2: | Permeability coefficient of UF membrane |
 | |
 | |
| Fig. 1: | Pure water flux of (a) UF13, (b) UF15 and (c) UF17 |
The permeability coefficient decreased with increased polymer concentration in the dope solution. This was clearly seen since the permeability coefficient for UF15 and UF17 were reduced to 22.87x10x6 and 0.68x10⁻⁶ m3 m-2 sec bar, respectively. The result of pure water flux measurement also represents the hydraulic permeability of membranes which is the property that depends on the membrane thickness and porosity.
Increase in the polymer concentration increased the membrane thickness and reduced the porosity, consequently resulting in the declination of permeability rate. Thus, a higher polymer concentration membrane would promote a lower hydraulic permeability.
Membrane morphology: In this study, all the fabricated membranes display asymmetric structures with a combination of two layers: active layer and supporting layers. Both layers have significant role in membrane transport property. The cross-section morphology of UF membranes observed by SEM is depicted in Fig. 2a-c.
UF13 membrane comprises a skin layer that was well-developed and supported by a porous support layer with large finger-like, sponge-like and macrovoid structures. This was due to the solvent-non-solvent exchange, leading to the different starting conditions for phase separation at layers far from the surface. The formation of macrovoids is favoured when non-solvent diffusion rate into the polymer-poor phase being formed exceeds the rate of outward- solvent diffusion. This signifies that an increase macrovoids formation in UF13 membrane was due to its lower polymer concentration used in the dope preparation.
UF15 membrane shows a large microporous finger-like structure which indicated that this membrane posseses a high porosity. At lower polymer concentration, non-solvent concentration in the dope solution was higher. Thus, the non-solvent diffusion into the membrane was higher and the phase-separation velocity leads to the formation of big finger-like pores in the membranes as can be seen in UF15 membrane. Large finger-like structures which performed from top layer to the bottom layer and a very thin supporting layer of UF15 increased its porosity and permeability. A little or extra water content also influenced the active layer structure. Apart from that, lower polymer concentration membranes exhibited few sponge structures which resulted from the rapid solvent precipitation during phase-inversion process (Young and Chen, 1995). Separation behaviour occurs at the skin (active) layer of the membrane and the bottom layer (support layer) acts as the mechanical strength of the membrane.
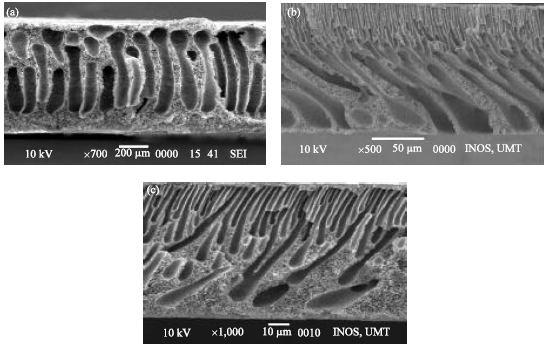 | |
| Fig. 2: | SEM cross section view of UF membranes; (a) UF13, (b) UF15 and (c) UF17 |
Thus, both membranes can be classified as porous membranes due to the visible and measurable pores traversing the membranes from one face to the others (Mulder, 1996).
UF17 presents the densest skin layer compared to the other fabricated membranes. It displayed tiny and micropore finger-like structure with fine-tuned arrangement. UF17 was built of high polymer concentration which enhanced the viscosity of the dope solution, leading to the formation of smaller pore size. This phenomenon occurs since high viscosity would avoid the diffusion exchange rate of solvent and non-solvent in sub-layer inducing fast-phase separation at the skin layer and slows the precipitation rate of the sub-layer. Hence, this results in the formation of an asymmetric membrane with dense and thick skin layer supported by a closed cell sub-layer. Besides, higher polymer concentration induced the chain entanglement and therefore reduced the formation of the macrovoid in the skin layer. On top of that, these conditions were affected by the thicker selective skins and transition layers which resulted from the slower redissolution of initial phase outermost separated regions of nascent membranes from an underlying homogeneous solution during dry-phase separation (Ahmad et al., 2005).
Membrane molecular weight cut-off: Molecular Weight Cut-off (MWCO) is customarily used to indicate the pore size of ultrafiltration membranes and its value can be determined from the solute rejection of membranes against the stable molecules with various weights, which can be measured with an ultrafiltration process (Becht et al., 2008).
| Table 3: | Melecular weight cut-off of UF membrane with different polymer concentration |
 | |
| Table 4: | Zeta potential of UF membrane with different polymer concentration |
 | |
Table 3 displays the estimation of MWCO of UF membrane with different polymer concentrations.
The molecular weight cut-off of UF 13 membrane was postulated to be 74 kD at the point where the rejection is 90%, which is a standard to determine whether or not the solid are successfully removed (Kulkami et al., 1992). Increasing the polymer concentration to 15% (UF 15) and 17% (UF 17) reduced the molecular weight cut-off of these typical membranes to 43 and 38 kD, respectively.
Membrane zeta potential: Zeta potential is an important indicator of the membrane surface charge which is essential for the design and operation of membrane processes. In-house fabricated membranes were further characterised to determine the zeta potential and observed result has displayed in Table 4.
All membranes were negatively charged and their charge distribution increased with increased polymer concentration.
 | |
| Fig. 3: | Filtrate flux of lysozyme permeation |
 | |
| Fig. 4: | Lysozyme transmission through UF membrane with different polymer concentration |
Negatively-charged membranes are widely used since they can selectively partition ions or solutes in the salt mixture through the electrostatic interaction between ions and membrane (Wang and Chung, 2005). In this study, negatively-charged membrane would attract the positively-charged lysozyme onto the membrane surface and membrane pores. Operating pressure applied would desorb the lysozyme molecule to pass through the membrane pores which tend to improve the filtrate flux and lysozyme transmission.
Separation performance of protein lysozyme: Figure 3 and 4 show the flux and percentage of lysozyme transmission through the three types of fabricated membranes at five operating pressures. For each membrane, the flux increased with increase of applied pressure. UF13 reached the highest lysozyme transmission (95%) at a pressure of 3 bars with high flux; 105.4x10⁻⁶ m3 m-2 sec and after this point the transmission started to decrease. This reduction might occur due to the accumulation of lysozyme onto the membrane surface which led to cake formation and pore-blocking phenomena and consequently fouled the membrane.
UF15 achieved the highest lysozyme transmission around 97.4%, also at a pressure of 3 bars. This high transmission was combined with moderate flux for about 10.4x10⁻⁶ m3 m-2 sec. Further increase of applied pressure to 4 and 5 bars would reduce the transmission to 94.2 and 92.9%, respectively.
| Table 5: | Flux and lysozyme transmission at optimum pressure |
 | |
This phenomenon occurred since most of lysozyme molecules can pass through the membrane during the initial stage of filtration process when the pore size of the membrane is larger than the pore radius of lysozyme. After it reached the saturating point, lysozyme started to deposit onto the membrane surface and pores which led to enhance the fouling and reduced the lysozyme transmission.
UF17 presented the lowest transmission and only reached the maximum transmission around 47.1% at a pressure of 2 bars. A small range of lysozyme transmission was between 38-47 % along with a low flux which only ranged between 0.8 to 2.8x10⁻⁶ m3 m-2 sec. A fine and high density of finger-like structures of UF17 just allowed some of lysozyme molecules to transmit. Most of the lysozyme would retain onto the membrane surface and its accumulation promoted a fouling and cake formation which consequently reduced the flux and transmission. Therefore, this membrane was determined to be unsuitable for lysozyme purification due to its low flux and lyzozyme transmission.
A low pressure would promote a lower flux and diffusion is a major transport mechanism in this condition. Positively-charged lysozyme was attracted by the negatively-charged membrane and it easily passed through the membrane. Increased pressure, increased the filtrate flux and, at high flux, convection is the major transport mechanism and effect of concentration boundry layer comes into play (Narsaiah and Agarwal, 2007). A thicker protein layer builds-up on the membrane surface and consequently reduces the lysozyme transmission. Thus, a pressure of 3 bars was chosen as the optimum pressure for lysozyme separation and purification. Table 5 shows the permeate flux and lysozyme transmission at optimum pressure. The results induced that the flux decreased in the sequence of 13% >15% >17% polymer concentrations, respectively. Higher permeability was observed at lower polymer concentration membranes due to the presence of larger molecular weight cut-off.
Overall result proved that polymer concentration provided a major role in determining a good membrane for specific application, such as protein purification. Polyethersulfone is a hydrophilic polymer, has high water solubility and a strong affinity with water which would increase the thermodynamics stability of the casting solution and improve the phase separation trend. Therefore, the leakage rate from the casting solution was lower, phase separation delay time was longer and skin layer was easier to form. Lower polymer concentration led to form a big pore size and pure water flux increased rapidly. This was clearly seen in UF13 which promoted the highest flux, due to it lower polymer concentration in dope. This membrane however is not suitable for lysozyme separation since it promoted too high flux and too loose substructure which can lead the other protein in chicken egg white to pass through the membrane together with lysozyme. Thus, UF15 which possesses a high lysozyme transmission together with appropriate flux, was postulated to be the optimum membrane for lysozyme separation.
CONCLUSION
Asymmetric UF membranes with different polymer concentrations were successfully developed via a simple dry/wet phase-inversion technique. The findings of this study prove that the polymer concentration greatly influence the membrane performance and morphology. Increase in the polymer concentration produced a denser membrane which led to the reduction of flux and lysozyme transmission. Based on the experimental data, 15 wt.% seems to be an optimum polymer concentration in preparing an ultrafiltration membrane with outstanding performance of lysozyme separation process.
ACKNOWLEDGMENTS
Authors wish to express their sincere gratitude to the Ministry Of Science, Technology And Innovation (MOSTI), for the grant of the E-Science Project and also for Engineering Science Department, Terengganu Malaysia University for their cooperation and support.
REFERENCES
- Ahmad, A.L., M. Sarif and S. Ismail, 2005. Development of an integrally skinned ultrafiltration membrane for wastewater treatment: Effect of different formulations of PSf/NMP/PVP on flux and rejection. Desalination, 179: 257-263.
CrossRef - Becht, N.O., D.J. Malik and E.S. Tarleton, 2008. Evaluation and comparison of protein ultrafiltration test results: Dead end cell compared with a cross flow system. Separation Purification Technol., 62: 228-239.
CrossRef - Chakrabarty, B., A.K. Ghoshal and M.K. Purkait, 2008. Preparation, characterization and performance studies of polysulfone membranes using PVP as an additive. J. Membrane Sci., 315: 36-47.
CrossRef - Ghosh, R. and Z.F. Cui, 2000. Protein purification by ultrafiltration with pre-treated membrane. J. Membr. Sci., 167: 47-53.
CrossRef - Blancoa, J.F., J. Subleta, Q.T. Nguyena and P. Schaetzel, 2006. Formation and morphology studies of different polysulfones-based membranes made by wet phase inversion process. J. Membrane Sci., 283: 27-37.
CrossRef - Narsaiah, K. and G.P. Agarwal, 2007. Transmission analysis in ultrafiltration of ternary protein mixture through a hydrophilic membrane. J. Membrane Sci., 287: 9-18.
CrossRef - Wang, D., K. Li, S. Sourirajan and W.K. Teo, 1993. Phase separation phenomena of polysulfone/solvent/organic non-solvent and polyethersulfone/solvent/organic non-solvent systems. J. Applied Polymer Sci., 50: 1693-1700.
Direct Link - Wang, K.Y. and T.S. Chung, 2005. The characterization of flat composite nanofiltration membranes and their applications in the separation of Cephalexin. J. Membrane Sci., 247: 37-50.
CrossRef - Young, T.H. and L.W. Chen, 1995. Pore formation mechanisms of membranes from phase inversion process. Desalination, 103: 233-247.
CrossRef