
B. Dibi
Laboratory of Geosciences and Environment, Department of Sciences and Environmental Management, University of Abobo-Adjame, 02 BP 802 Abidjan 02, C�te d�Ivoire
I. Doumouya
Laboratory of Geosciences and Environment, Department of Sciences and Environmental Management, University of Abobo-Adjame, 02 BP 802 Abidjan 02, C�te d�Ivoire
A. Brice Konan-Waidhet
Laboratory of Geosciences and Environment, Department of Sciences and Environmental Management, University of Abobo-Adjame, 02 BP 802 Abidjan 02, C�te d�Ivoire
K.I. Kouame
Laboratory of Geosciences and Environment, Department of Sciences and Environmental Management, University of Abobo-Adjame, 02 BP 802 Abidjan 02, C�te d�Ivoire
K.T. Angui
Laboratory of Geosciences and Environment, Department of Sciences and Environmental Management, University of Abobo-Adjame, 02 BP 802 Abidjan 02, C�te d�Ivoire
S. Issiaka
Laboratory of Geosciences and Environment, Department of Sciences and Environmental Management, University of Abobo-Adjame, 02 BP 802 Abidjan 02, C�te d�Ivoire
Journal of Applied Sciences
Year: 2010 | Volume: 10 | Issue: 18 | Page No.: 2058-2067


ABSTRACT
Despite abundant rainfall (2000 mm year-1) and the presence of many rivers, the Aboisso area is faced with a crucial shortage of drinking water. Water flow rates generally remain low, ranging from 0.25 to 11 m3 h-1. This study aims to identify potential groundwater zones (GWPZ). Both Geographical Information System (GIS) and multicriteria Analysis (MCA) were used in combination to resolve to this problem. The linear combination of the weights, based on pair wise comparisons was used. This method allowed for combining a set of parameters to express the accessibility, exploitability and availability of groundwater resources. This led to the mapping in support of the implementation of future water points. The results show that, in spite of good groundwater (61%) availability, coupled with easy accessibility (81%), the resource remains moderately exploitable (50%). The most suited areas to locate wells represented 59% of the Aboisso area.
PDF Abstract XML References Citation
Received: April 09, 2010;
Accepted: June 21, 2010;
Published: July 14, 2010
How to cite this article
B. Dibi, I. Doumouya, A. Brice Konan-Waidhet, K.I. Kouame, K.T. Angui and S. Issiaka, 2010. Assessment of the Groundwater Potential Zone in Hard Rock through the Application of GIS: The Case of Aboisso Area (South-East of Cote d’ivoire). Journal of Applied Sciences, 10: 2058-2067.
DOI: 10.3923/jas.2010.2058.2067
URL: https://scialert.net/abstract/?doi=jas.2010.2058.2067
DOI: 10.3923/jas.2010.2058.2067
URL: https://scialert.net/abstract/?doi=jas.2010.2058.2067
INTRODUCTION
Groundwater constitutes the largest single fresh water source in many parts of the world that provides a risk buffer to sustain critical water demands during and prolonged dry cyclical periods (Assaf and Saadeh, 2008). Studies pertaining to the behaviour of groundwater in crystalline rocks usually reveal that one out a set of factors are responsible for the high variability in well-productivity, although no conclusive evidence is available, such as geological, hydrogeological, geophysical and remote sensing techniques, as well as, Geographic Information Systems (GIS) and the multicriteria analysis (MCA), which are employed to delineate areas with good productivity (Prasad et al., 2008). These are considered as potential groundwater recharge zones around the world based on GIS and MCA techniques. Thus, Jaiswal et al. (2003) used GIS techniques to define groundwater prospective zones for rural development. Similar work was also conducted by Hajkowicz and Collins (2007) and Madrucci et al. (2008). Geographical information system has also been considered for multicriteria analysis (MCA) in resource evaluation (Boutt et al., 2001).
All these studies considered only the characteristics of the aquifer. They did not reflect the characteristics of the wells nor the socio-economic aspects that influence well establishment. Well parameters are the water table and the exploitation flow, which foster its exploitation. On the other hand, the socio-economic parameters are total well depth, index of success and distance from well source to the locality that facilitate its accessibility. However, wells are usually implanted in areas where water is available, accessible and exploitable.
In the present study, both Remote Sensing and GIS techniques were used to generate various thematic maps, using water availability, accessibility and exploitability parameters. The thematic maps were then integrated using MCA to define groundwater potential zones. MCA is used to deal with the difficulties that decision makers encounter in handling large amounts of complex data (Nas et al., 2010). The use of GIS in combination with MCA is a powerful technique to solve groundwater potential zone delineation problems, because GIS provides efficient manipulation and presentation of the data and MCA supplies consistent ranking of the groundwater potential zones, based on a variety of criteria. This study aims to evaluate the groundwater potential of the region and identify areas favourable to the location of wells.
MATERIALS AND METHODS
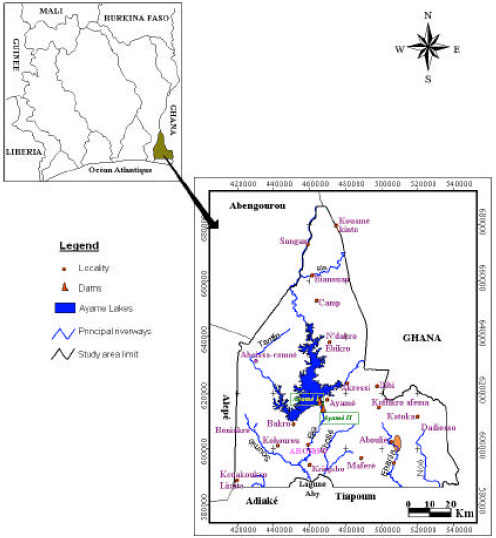
Study area description: The Aboisso area is located in the South-Eastern part of Côte d'Ivoire, between the 5°05 and 6°15 N and 2°40 and 3°25 W. It belongs to the administrative area of the South-Comoé, which covers an area of approximately 4563 km2. The study area comprises Aboisso, Ayamé, Bianouan and Maferé cities (Fig. 1). The population is estimated at 322 498 inhabitants.
The Aboisso area is a densely populated, with the presence of many agro-industrial farms. This region is essentially covered with strongly leached ferralitic soils do to heavy rainfall. The soils are characterized by highly watered permeable thick layers. Climate is subtropical, with 4 seasons (two dry; two wet and the average annual rainfall is 2000 mm). The relief varies is moderate, with elevations ranging from 150 to 200 m. On the hydrographic setting, the area is characterized by many rivers, with main being Comoé, Tanoé and Bia. In addition to these, secondary rivers such as Eholié, Soumié, Noé, Timin and Ehania are found. Two dams are built on the Bia, giving rise to the Ayamé I and II Lakes.
The main geological formations are granitoid, schists and sedimentary formations (Fig. 2). The granitoids are homogeneous and are generally observed in the central part of the study area. They are very prominent near the contact zone between the basement and the sedimentary rocks. The directions of the main lineaments are N0-30; N90-120; N150-160 and N50-60. These formations allow the existence of three types of aquifers, found in alterites, fractured rocks and sedimentary formations. Induced permeabilities varied from about 10-8 to 10-6 m sec-1. Wells depths ranged from 24 to 130 m. As a whole, Average wells depths were 50 m with flow rates generally ranging from 0,25 to 11 m3 h-1. Alterite thicknes ranged between 2,25 and 68 m.
Materials: The material is composed of MapInfo© 6.0 and ArcView© 3.3 softwares used to develop thematic charts and Envi 3.6 for the digital processing of images data. The data used are comprised of images, as well as cartographic, climatological and wells data. The image data are made up of an image ETM+ of Landsat 7 of scene 196-55 of February 2000 and images SRTM (Shuttle Radar Topography Mission) Product by NASA (National Aeronautic and Space Agency of the US) of the year 2000, whose coordinates are N05W003, N05W004 and N06W004.
 | |
| Fig. 1: | Study area |
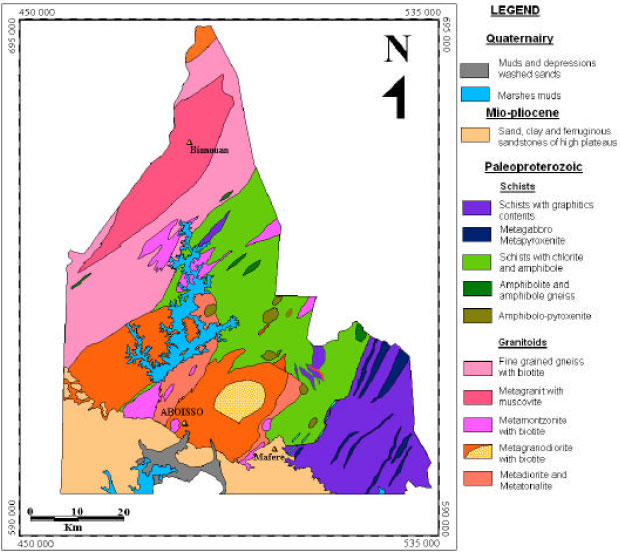 | |
| Fig. 2: | Cote d’Ivoire geologic map |
The cartographic data are composed of the geological maps form Grand-Bassam and Abengorou. The climatological data used (temperature, rain, ETP) was obtained from the weather stations of Abidjan airport (5°15 N, 3°55' 48 W), Adiaké (5°18 N, 3°18 W) and Alepé (5°30 N, 3°40 W). The data of flows are those of the hydrometric station of Bianouan (6°01 N, 3°11 W), obtained from Ivorian Electricity Compagny (IEC) in Ayamé Station and covered the period between 1984 and 1995. The data of 70 wells related to the following parameters: exploitation flow, weathered layer, water total depth and water table were used.
Methods
Factors establishment for groundwater potential zone delineation (GWPZ): The delineation of groundwater potential zone consists in identifying areas favourable for the occurrence of groundwater, based on a multiparametric approach (Skankar and Mohan, 2006). The parameters or factors used for GWPZ are composed of intrinsic factors, which determine aquifer productivity associated with both well characteristics as well as socio-economic parameters. All these factors are grouped in three quantitative indicators (accessibility, the exploitability and the availability).
The accessibility is an indicator of access conditions to the groundwater resources. The main factors are well total depth, distance from well point to the habitations and the index of success. Well total depth gives information on costs, depending on the number of linear depth drilled. The distance from a well point to human habitations shows the spatial accessibility to the well, because it allows evaluating the effort required to have access the water point. Generally, for rural water supply wells (RWSW) in Côte d’Ivoire, this distance must not exceed 500 m.
 | |
| Fig. 3: | Conversion into notations of assessment factors by S shape (A) and linear functions (C) |
The Index of success is a measure of the probability of having a productive well. It allow to distinguish areas of good productivity, characterized by positive wells (EF = 1 m3 h-1) from areas of low productivity, that encompass a large number of negative wells (EF<1 m3 h-1).
The exploitability of groundwater resources refers to the water flow and the water table. Exploitation flow is the rate at which the well is hand over to the population and thus represents well productivity. The water table allows monitoring the fluctuation of the water level within the aquifer (Jat et al., 2008).
Groundwater resources availability constitutes the most significant indicator because it encompasses all factors supporting the accumulation of these resources. The mains factors are slope, drainage density, lineament density and weathered layer. The importance of these factors has been shown by several studies. Jaiswal et al. (2003) used GIS technique to generate groundwater prospect zones for rural development. Singh and Prakash (2002) used GIS to delineate groundwater potential zones.
Classification and factors standardization: The various factors were classified, then standardized. The standardization consist in conversion into notations of assessment factors by S shape (A) and linear functions (C) (Fig. 3). When this step is constant, the linear function is applied. This function was used to elaborate factors of distance from well point to the locality and success index. For the other factors, the sigmoid function was used due to step variability. It is the case of the exploitation flow rate, the slope, the water, total depth, weathered layer, water table, drainage density and induced permeability.
| Table 1: | Correlation matrix of accessibility indicator |
 | |
During the standardization, the very unfavourable class has always the weakest note and the very favourable class, the highest note. However, these notes which generally vary from 0 to 10 also depend on the quality of the factor considered.
Quantitative factors weighting: The quantitative factors were weighted using the linear combination method of weights, based on the comparison technique. The linear combination allowed to produce standardized-weighting coefficients, whose sum is equal to 1 (Kouame et al., 2008).
Analytical Hierarchy Process (AHP) method has been used by Tudes and Yigiter (2009) for land use planning in Adana-Turkey. These coefficients are given starting from a series of comparison per pair by taking into account their importance in establishment of the potentiality map. Thus, we established the correlation matrix of accessibility (Table 1) from factors of well total depth, distance from well point to the habitations and the index of success. The same procedure has been adopted for the development of exploitability correlation matrix with the factors of exploitation flow and water table (Table 2) and also for the availability correlation matrix from factors of slope, drainage density, lineament density and weathered layer (Table 3). The pairwise comparison between indicators of accessibility, exploitability and availability gave the correlation matrix of indicators (Table 4).
| Table 2: | Correlation matrix of exploitability indicator |
| Table 3: | Correlation matrix of availability indicator |
 | |
| Table 4: | Correlation matrix of different indicators |
 | |
| Table 5: | The weighting coefficient of accessibility indicator |
 | |
| Table 6: | The weighting coefficient of exploitability indicator |
| Table 7: | The weighting coefficient of availability indicator |
 | |
| Table 8: | The weighting coefficient of different indicators |
 | |
These correlation matrix were used to determine the eigenvector (Vp) and the weighted coefficient of each factor of accessibility (Table 5), exploitability (Table 6) and availability (Table 7). The eigenvector (Vp) and the weighted coefficient has been also computed for the different indicators (Table 8). The eigenvector (Vp) were obtained by calculating the geometric mean by line of each factor or indicator:
| (1) |
| Vpi | = | Load vector of each factor |
| Ni | = | Value of each factor |
The weighted coefficient (Wij) of each factor or indicator is given as follows:
 | (2) |
The Weighted Linear Combination (WLC) is applied according to the following equation, where F is the favorability, wij the weight of class j from map i and Xi the criterion score of map I:
| (3) |
where, X i are the factors score of map i , ranging from 0 to 10.
Aggregation of factors: The multicriteria evaluation or the aggregations of factors generally use both complete and incomplete aggregations, which are two types of procedures to clear the best favourable area to establish wells.
In this study, the complete aggregation method, based on average weight, was adopted. It consisted in multiply each factor or indicator by its corresponding weighted-coefficient and then adding these results to produce an aptitude index. This step was used individually for the 3 decision making indicators, which are accessibility, exploitability and availability.
RESULTS AND DISCUSSION
Indicators combination: The linear combination of factors allowed obtaining accessibility, exploitability and availability maps which are combinate to delineate groundwater potential zone in Aboisso area. The maps of accessibility, exploitability and availability obtained were distinguished in 4 classes corresponding to very high, high, medium and low (Fig. 4).
The accessibility (Fig. 5) is dominated by the high class (62%) covered all the studied area, except the centre-western part. Some pockets, considered to be in the very high class (19%), were observed in the east. The medium class (18%) is met in the centre, with some appearances in the southern part. The low class of accessibility was, for all practical purposes, absent (1%).
The exploitability (Fig. 6) remains dominated by the high (46%) and average (43%) classes. The high class is observed around Maferé and Ayamé I lake, where a good groundwater flows are observed. The average class is rather present on the granitoid rocks, especially in South-west and North. Around these two classes revolve the low and very high classes, which occupy 7 and 4%, of the area, respectively. The low class is located in the, northern part, just at the border with Ghana.
 | |
| Fig. 4: | Groundwater potential zone delineation organization |
 | |
| Fig. 5: | Accessibility map |
 | |
| Fig. 6: | Exploitability map |
The very high one is found in Ayamé, M’possa, Dadiesso, Dibi, Yaou and Akressi where groundwater flows are very often superior to 8 m3 h-1.
Concerning the availability (Fig. 7), it dominate by the high class (62%) associated to the very high (8%). These two classes are found in the part of the area where slopes and drainage densities were weak. The very high class is present in the North near Bianouan and Songan, as well as the south-western part in the contact of the sedimentary and crystalline basement rocks. The medium (30%) and low (9%) availability are concentrated respectively in the East of Ayame I lake and in the surroundings of Aboisso-comoé, Soubré, Appouasso, Ayamé, Bakro and Kohourou.
Groundwater potential map delineation: The groundwater potential areas map (Fig. 8) was reclassified into 4 classes, ranging from low to very high. The low class covers 8% of the study area and is usually found on the granitoid formations. This class covers the areas of low to medium groundwater availability and concerns areas of low or medium groundwater availability on which can be added a low exploitability. The medium class establishment areas cover 34% of the study site and occupied areas of low exploitability and medium availability. The class with a high potential occurs in almost the entire study area, except at the East, where highlands reduce its presence. It occupies 49% of the study area and stays where the slopes are small with a low drainage density. The class of very high potentiality covers only 9% of the study area, with a much stronger presence in the North and the South-west. It covers low proportions in the East, where very high flow rates were obtained (M'possa (40 m3 h-1 flow air lift), Dadiesso (6 m3 h-1) and Dibi (10 m3 h-1).
Several studies, dealing with groundwater management showed the importance of GIS and MCA for supplying water to the populations (Hajkowicz and Collins, 2007; Prasad et al., 2008; Madrucci et al., 2008).
 | |
| Fig. 7: | Availability map |
 | |
| Fig. 8: | Groundwater potential zone delineation |
However, the choice of the parameters, to explain the results is very important and requires a good knowledge of soil data, which necessitates a good collaboration of between scientists at the time of weighting and of factor identification. The above factors were selected because they influence productivity (Neves and Morales, 2007) or play an importance role in groundwater potential zone delineation. For the accessibility, the most significant factor (well depth) remains generally weak throughout the study area. The remarkable presence of the high accessibilities area was due to the weakness of this factor. The distance between the well and the distribution point was used as a factor because of its determining role. Indeed, according to the National Office of Drinking Water (NODW), the rural populations could easily abandon a well point far away from the locality for a stream or a closer river. It was decided that the distance between the well point and the locality should not exceed 500 m. For the availability of the groundwater resources, the recharge is the most representative factor which strongly varies according to slope and drainage density. Indeed, in the area where drainage density is high, the rainwater infiltrates poorly in the ground because the majority of water runs into the downstreams. This behaviour was observed in several studies in western Lebanon and the West of Deccan Volcanic Province in India (Shaban et al., 2006; Jha et al., 2007). The weak slope constitutes an area of groundwater accumulation, contrary to the zones of strong slopes as indicated by Anbazhagan et al. (2005) and Skankar and Mohan (2006). These studies emphasized the importance of the slope in aquifer recharge. The influence of the slopes in the recharge was underlined by several authors who showed that the wells located in the valleys are most of the time more productive than those which are on strong slope (McFarlane et al., 1992). These authors also emphasized the importance of weathered layer otherness in the well productivity.
A good groundwater availability in the North, the South and some pockets in the East are due to both low slopes and drainage density. For the factors such as exploitation flow, water table and well total depth, the problem of interpolation arises because of aquifer discontinuity. In these media, aquifers, which are essential elements for the cartography of the groundwater resources are badly controlled. According to Long and Witherspoon (1985), the fracturing network which must be dense, well connected and well distributed in the preferential directions, are the reasons for assimilating an aquifer in an equivalent porous medium. These conditions being fulfilled in the fracturing zone, the aquifer could be considered as continuous, thus facilitating any interpolation.
CONCLUSIONS
Geographical Information System and Multicriteria analysis are two complementary techniques used to delineate favourable areas for well establishment. They have been used to integrate various geoinformative thematic maps, which play major role in the occurrence and movement of groundwater. The results of this study show that the region is potentially rich in groundwater resource, which represents 59% of the total area. These areas are concentrated in the east, with shale formations and in the south, characterized by sedimentary formations. The classes of lower potentiality cover 41% and are generally present in the center on granitoids This study has delineated the area are favorable for obtaining good rates of wells. But it does not incorporate the quality aspect. This work must continue with the combination of the map areas that are favorable and that the vulnerability to determine suitable areas that are not threatened by pollutants. It is also recommended to apply the same study with a smaller scale in all major areas of agricultural production.
ACKNOWLEDGMENTS
We would like to thank the Centre of Regional Water Supply and Sanitation Côte d’Ivoire (CRWSS-CI) for its support through the project Diagnostic Study of the state of pollution of in the river-lagoon system Aby-Bia-Tanoe and study of transfers of pollutants in the river-lagoon system Aby-Bia-Tanoe funded by the Fund for Global Environment Facility/Small Grants Programme (GEF/ NGO). We also want to thank Geology management body who took an active part in this project and finally, the populations from the villages, who contributed significantly to the success of this project.
REFERENCES
- Anbazhagan, S., S.M. Ramasamy and S.D. Gupta, 2005. Remote sensing and GIS for artificial recharge study, runoff estimation and planning in Ayyar basin, Tamil Nadu, India. Environ. Geol., 48: 158-170.
CrossRefDirect Link - Assaf, H. and M. Saadeh, 2008. Geostatistical assessment of groundwater nitrate contamination with reflection on DRASTIC vulnerability assessment: The case of the upper Litani Basin, Lebanon. Water Resour. Manage., 23: 775-796.
CrossRef - Nas, B., T. Cay, F. Iscan and A. Berktay, 2010. Selection of MSW landfill site for Konya, Turkey using GIS and multi-criteria evaluation. Environ. Monitoring Assess., 160: 491-500.
CrossRef - Hajkowicz, S. and K. Collins, 2007. A review of multiple criteria analysis for water resource planning and management. Water Resour. Manage., 21: 1553-1566.
CrossRef - Jaiswal, R.K., S. Mukherjee, J. Krishnamurthy and R. Saxena, 2003. Role of remote sensing and GIS techniques for generation of groundwater prospect zones towards rural development: An approach. Int. J. Remote Sensing, 24: 993-1008.
Direct Link - Kouame, K., J. Jourda, M. Saley and J. Biemi, 2008. Contribution d'un SIG a la selection de sites potentiels de stockage de dechets dans le district d'Abidjan (sud de la Cote d'Ivoire). Revue Internationale de Geomatique, 18: 169-196.
CrossRef - Long, J.C.S. and P.A. Witherspoon, 1985. The relationship of degree of interconnection to permeability in fracture networks. J. Geophys. Res., 90: 3087-3098.
Direct Link - Jha, M.K., A. Chowdhury, V.M. Chowdary and S. Peiffer, 2007. Groundwater management and development by integrated remote sensing and geographic information systems: Prospects and constraints. Water Resour. Manage., 21: 427-467.
CrossRefDirect Link - Madrucci, V., F. Taioli and C.C. De-Araujo, 2008. Groundwater favorability map using GIS multicriteria data analysis on crystalline terrain, Sao Paulo State, Brazil. J. Hydrol., 357: 153-173.
CrossRef - Jat, M.K., D. Khare and P.K. Garg, 2008. Urbanization and its impact on groundwater: A remote sensing and GIS-based assessment approach. Environmentalist, 29: 17-32.
CrossRef - McFarlane, M.J., P.J. Chilton and M.A. Lewis, 1992. Geomorphological controls on borehole yields: A statistical study in an area of basement rocks in central Malawi. Geol. Soc. London Special Publ., 66: 131-154.
CrossRef - Neves, M.A. and N. Morales, 2007. Well productivity controlling factors in crystalline terrains of Southeastern Brazil. Hydrogeol. J., 15: 471-482.
Direct Link - Prasad, R.K., N.C. Mondal, P. Banerjee, M.V. Nandakumar and V.S. Singh, 2008. Deciphering potential groundwater zone in hard rock through the application of GIS. Environ. Geol., 55: 467-475.
CrossRef - Shaban, A., M. Kahawlie and C. Abdallah, 2006. Use of remote sensing and GIS to determine recharge potential zones: The case of Occidental Lebanon. Hydrogeol. J., 14: 433-443.
CrossRef - Skankar, M.N.R. and G. Mohan, 2006. Assessment of the groundwater potential and quality in Bhatsa and Kalu river basins of Thane district, western Deccan Volcanic Province of India. Environ. Geol., 49: 990-998.
CrossRef - Tudes, S. and N.D. Yigiter, 2009. Preparation of land use planning model using GIS based on AHP: Case study Adana-Turkey. Bull. Eng. Geol. Environ., 69: 235-345.
CrossRef