
Sh. Rahmatizadeh
Department of Electrical and Computer Engineering, Shahid Beheshti University, Tehran, Iran
H. Shah-Hosseini
Department of Electrical and Computer Engineering, Shahid Beheshti University, Tehran, Iran
H. Torkaman
Department of Electrical and Computer Engineering, Shahid Beheshti University, Tehran, Iran
Journal of Applied Sciences
Year: 2009 | Volume: 9 | Issue: 5 | Page No.: 983-987


ABSTRACT
In this study, a new agent-based routing algorithm that are based on both ant and bee colony optimization algorithms is proposed and named as the Ant-Bee Routing (ABR) algorithm. In the proposed algorithm, the initial AntNet Routing (ANR) algorithm is modified where some intelligent features of bees are included to enhance the performance of the ANR algorithm. Experiments with the ABR algorithm are implemented using the OMNET++ software platform by means of NTTNET network topology. Results showed that the performance of ABR algorithm is much better than the ANR algorithm with reduction in packets delay. The ABR is also suitable in dynamic environments.
PDF Abstract XML References Citation
How to cite this article
Sh. Rahmatizadeh, H. Shah-Hosseini and H. Torkaman, 2009. The Ant-Bee Routing Algorithm: A New Agent Based Nature-Inspired Routing Algorithm. Journal of Applied Sciences, 9: 983-987.
DOI: 10.3923/jas.2009.983.987
URL: https://scialert.net/abstract/?doi=jas.2009.983.987
DOI: 10.3923/jas.2009.983.987
URL: https://scialert.net/abstract/?doi=jas.2009.983.987
INTRODUCTION
The Routing is the process of selecting paths in a network by which a packet travels from a source to a destination. Routing plays a critical role in communication networks in determining the overall network performance in terms of throughput and transmission delay. Routing algorithms are currently implemented through the information contained in routing table independently available at each node of the network (Kurose, 2005). Traditional routing algorithms are not intelligent and do not have enough flexibility to satisfy new routing demands and they need human assistance in order to adapt themselves to failure and changes.
The algorithm, which is proposed in this study, is inspired by earlier study on ant and bee colonies (DiCaro and Dorigo, 1998; Teodorovic et al., 2006). Real ants have been shown to be able to find shortest paths using only the pheromone trail deposited by other ants. The study by Schoonderwoerd et al. (1996, 1997) was the first attempt to apply it to a routing problem. Their algorithm called Ant-Based Control (ABC) was applied to the case of virtual circuit based on symmetric networks. The AntNet algorithm introduced by DiCaro and Dorigo (1998) for routing in packet switching networks outperformed all conventional algorithms on several packet-switched communications networks in their simulations.
The bee colony’s function according to nature is as follows. At first, each bee belonging to a colony looks for the food individually. When a bee finds the food, it informs other bees by dancing. Other bees collect and carry the food to the hive. After relinquishing the food to the hive, the bee can take three different actions.
| • | Abandon the previous food source and become again uncommitted follower |
| • | Continue to forage at the food source without recruiting the nestmates |
| • | Dance and thus recruit the nestmates before returning to the food source |
With a certain probability that is dependent on the obtained food quality, its distance from the hive and the number of the bees which are now engaged with this food source, a bee selects one of the stated actions and follows its work in a similar repetitive form (Teodorovic et al., 2006; Yang, 2005). This behavior may be applied to several complicated engineering problems.
There already exist many successful adaptations of ant behavior to network control with the most prominent being AntNet (DiCaro and Dorigo, 1998, 1997). An overview of swarm-based algorithms can be found by Kassabalidis et al. (2001).
The purpose of this study is to investigate the use of social insect metaphors to solve the adaptive routing problem without relying on the availability of priori global information.
THE ANTNET ROUTING ALGORITHM
First, A social insect metaphor provides a middle ground in which the concepts of a routing table and data packet still exist but in addition new control packets-ants are introduced that interact to keep the contents of the routing tables up to date.
| Table 1: | Performance comparison between ANR and ABR |
 | |
To do so, the operation of ant packet is modeled on observations made regarding the manner in which worker ants use chemical trails as a method of indirect stigmergic communication. Stigmergy is a form of indirect communication used by ants in nature to coordinate their problem-solving activities (Dorigo et al., 1999).
In the ANR, ants explore the network to find the best paths from the randomly selected source-destination pairs. Moreover, while exploring the network, ants update the probabilistic routing tables and build a statistical model of the nodes’ local traffic. The operation of the ANR is based on two types of agents: forward-ants which gather information about the state of the network and backward ants which use the collected information to update the routing tables of routers on their path. A sample routing table is shown in Table 1. A routing table is a LxN matrix in which L is number of outgoing links and N is the total No. of nodes in the network topology minus one. Element τij is a probability between 0 and 1 that stands for the goodness to destination j through outgoing link i and satisfies the following formula:
(1) |
An array ![]() defines a simple statistical traffic model experimented by the node k over the network where, Wd is used to store the value
defines a simple statistical traffic model experimented by the node k over the network where, Wd is used to store the value ![]() of the best ants’ trip time toward destination d. For each destination d in the network the estimated mean and variance, μd and
of the best ants’ trip time toward destination d. For each destination d in the network the estimated mean and variance, μd and ![]() , give a representation of the expected time to go to node d and its stability. To compute these statistics, the ANR uses the following exponential models:
, give a representation of the expected time to go to node d and its stability. To compute these statistics, the ANR uses the following exponential models:
(2) |
(3) |
where, Ok → d is the new observed trip time experienced by the ant while traveling from node k to destination d. The factor η weighs the number of most recent samples that will really affect the average.
The ANR’s behavior is summarized as:
At regular intervals and concurrently with the data traffic, from each network node artificial ants are launched toward destination nodes selected according to the traffic distribution. Assume fsd is measure of the data flow → d , then the probability of creating at node s a forward-ant with node d as destination is:
(4) |
Each forward-ant searches for minimum cost path joining its source and destination node. At each node i, each forward-ant headed toward a destination d selects the node j to move to; choosing among the neighbors did not already visit. The neighbor j is selected with a probability Pjd computed as:
(5) |
The heuristic value ηij is a [0, 1] normalized value function of the length qij (in bits waiting to be sent) of the queue on the link connecting the node i with its neighbor j:
(6) |
The α parameter weights ηij with respect to routing table entries.
| • | While moving, the forward-ants collect information about the time length, the congestion status and the node identifiers of the followed path |
| • | When a forward-ant reaches the destination it changes its type to a backward ant and goes back to its source node by moving along the same path as before but in the opposite direction. On its way back, the backward ant updates the associated routing table entries for all nodes along the path. The routing table is updated by incrementing the pheromone values τjd of selecting neighbor j when the destination is d which is given by: |
(7) |
Pheromones τnd for destination d of the other neighboring nodes decrease implicitly by normalization as:
(8) |
where, r ∈ [0, 1] is the reinforcement factor central to expressing path quality and should be a factor of trip time and local statistical model of the node neighborhood. r is defined as follows:
(9) |
where, Wbest is the best case trip time for a given destination in last observation period; T is the observed trip time taken by the ant:
where, γ gives the selected confidence level.
The value r obtained from Eq. 9 is finally transformed by means of a squash function (x):
(10) |
Where:
(11) |
THE PROPOSED ANT-BEE ROUTING ALGORITHM
The purpose of our algorithm is to increase the speed of convergence when some nodes of the network fail by defining a new cooperation between artificial ants and bees. In ant and bee colony cooperation algorithms, at the beginning ants try to find a suitable solution from one node to another then bees update the routing table based on ants collected data. In the ABR algorithm, each node generates an ant at regular intervals. The ant goes to the random destination based on Eq. 4. The probability of choosing the popular destination increase based on this equation. These ants which are called forward-ant should watch and collect the network traffic condition such as node identifiers and Trip Time. The forward-ants and data packets use Eq. 4 and 5 for selecting their next hops.
When a forward-ant reaches a node, if the node is not the destination node, the ant will continue its trip to the destination.
But if the node is the destination, the ant will be killed and a bee starts working. In the destination, a bee is created and all data which were collected by the forward-ant are delivered to the new born bee. Then, the artificial bee goes back to the source node by moving along the same path as before but in the opposite direction. The bees should update the routing tables. Each bee belongs to one of these groups randomly: dancers, followers and introversive bees (Karaboga and Basturk, 2007).
Every dancer also writes its trip time in each routing table of every node that it visits. The last M tripe times of the dancers that have visited the relevant node are kept.
The followers calculate the trip time based on Eq. 12, when they reach a node in returning path. Then, they use this new trip time to update the tables.
(12) |
In the Eq. 12, ![]() defines trip time for following ant,
defines trip time for following ant, ![]() shows selected time from written trip times by the dancers and β is a coefficient which shows the effectiveness of each time. If we set β = 1, the follower does not pay attention to the dancer and update the table based on itself trip time. If we set β = 0, the follower obeys the dancer. The effects of dancer to the follower are increased when we decrease β from 1 to 0 (Rahmatizadeh and Shah-Hosseini, 2008).
shows selected time from written trip times by the dancers and β is a coefficient which shows the effectiveness of each time. If we set β = 1, the follower does not pay attention to the dancer and update the table based on itself trip time. If we set β = 0, the follower obeys the dancer. The effects of dancer to the follower are increased when we decrease β from 1 to 0 (Rahmatizadeh and Shah-Hosseini, 2008).
Another point which the followers are faced is how they can select a trip time from a lot of times which are written by the dancers in the routing table.
For every follower in a node i coming from node j with destination d, one of the M trip times ![]() from the routing table of node i should be selected. The probability Pk of selecting the kth trip time is computed by:
from the routing table of node i should be selected. The probability Pk of selecting the kth trip time is computed by:
 | (13) |
It is clear that the probability of choosing the smallest time is more than the other trip times.
Introversive bees act the same as backward ants and do not pay attention to other bees.
EXPERIMENTAL RESULTS
All experiments were implemented with the Omnet++ (2008) software and were conducted on NTTNET, (Fig. 1). It is a narrow, long network with 57 nodes and 162 bi-directional links. Link bandwidth is 6 Mbps; link propagation delays are between 1 to 5 msec.
In all experiments, each node generates ants to random destination at every 0.3 sec and data packets are generated randomly according to the Poisson distribution. All reported data are averaged over ten trials lasting 1000 sec of simulation time.
In Table 1, the load is high or low which is determined by the mean of the packet inter-arrival time distribution. In the low load situation, it is set to 0.01 and in the high load to 0.005. Unlike the low load situation that all routers remain available, in the high load situation router 21 is down at a time step of 200 sec and up again at 500 sec and router 40 is down at a time step of 300 sec and up again at 700 sec.
It can be shown from Table 1, under low load both algorithms have similar performance but under high load and failures, major differences are observed regarding traffic delays. In ABR algorithm, average packet delay is 15% lower. Because in this algorithm employed three different kinds of bees which move around the network and share their good paths they have found, there is better chance to find less delay links which leads to overall smaller packet delay in the network.
 | |
| Fig. 1: | Japanese backbone-NTTNET (57 nodes) |
On the other hands in this algorithm bees handle more intelligent and gathering more useful data than backward ants in ANR Algorithm. In addition, Fig. 2 shows the trend of data packet delay and Fig. 3 shows the trend of throughput.
It should be noted that the trend of packet delay in ABR algorithm (Fig. 2) after start failing (at time step 200 sec) shows that the proposed Algorithm is one of the best fault-tolerant routing algorithms. The proposed ABR algorithm reached affordable delay at 400th sec and adapted itself quickly to changes in the network. After this time the packet delays did not increase any more while both nodes are still inactive.
Figure 2 shows that the ANR algorithm could not adapt itself to changes in the network until the both nodes became active again.
Also the ABR algorithm increased the average packet delays for the first 400 sec of simulation was about 0.09 sec but the increasing in ANR algorithm was continued up to 700th second by the value of 0.22 sec; In other words, we can say the ant bee algorithm works three times better than the ANR algorithm.
Figure 3 describes the throughput in two algorithms. It shows that the ANR has a less than 2% better throughput.
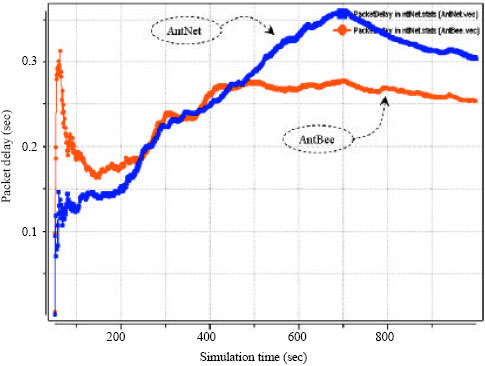 | |
| Fig. 2: | Packet delay of high load with failure |
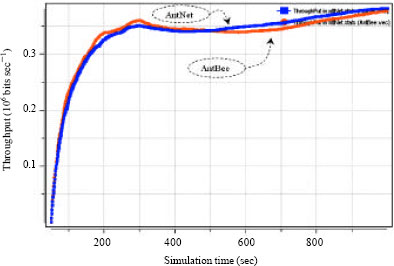 | |
| Fig. 3: | Throughput of high load with failure |
CONCLUSION
In fact, the proposed ABR algorithm combines ants with bees to create a fault-tolerant routing algorithm. Present purposed algorithm uses forward ants and back bees to update the routing tables of routers in a computer network. The ABR algorithm is tested in static and dynamic situations. It is seen that in static networks in which all routers are working properly, the ABR algorithm performs well and its performance is comparable to the ANR algorithm. However, in a dynamic network in which some routers may fail temporarily, the proposed routing algorithm delivers the packets with much higher speed while keeping the throughput almost at the same level of that of the ANR algorithm. In summary, the ABR algorithm is more suitable for dynamic and real computer networks where the failures of some routers are anticipated.
REFERENCES
- Di Caro, G. and M. Dorigo, 1998. AntNet: Distributed stigmergetic control for communications networks. J. Artif. Intell. Res., 9: 317-365.
CrossRefDirect Link - Dorigo, M., G. DiCaro and L.M. Gambardella, 1999. Ant algorithms for discrete optimization. Artificial Life, 5: 137-172.
CrossRefDirect Link - Karaboga, D. and B. Basturk, 2007. Artificial Bee Colony (ABC) optimization algorithm for solving constrained optimization problems. Proceedings of the 12th International Fuzzy Systems Association World Congress, June 18-21, 2007, Springer, Berlin/Heidelberg, pp: 789-798.
Direct Link - Kassabalidis, I., M.A. El-Sharkawi, R.J. Marks, P. Arabshahi and A.A. Gray, 2001. Swarm intelligence for routing in communication networks. Proceedings of the Global Telecommunications Conference, November 27-29, 2001, San Antonio, TX., USA., pp: 3613-3617.
CrossRefDirect Link - Schoonderwoerd, R., O. Holland, J. Bruten and L. Rothkrantz, 1996. Ant-based load balancing in telecommunications networks. Adaptive Behav. J., 5: 169-207.
Direct Link - Schoonderwoerd, R., O. Holland and J. Bruten, 1997. Ant-like agents for load balancing in telecommunications networks. Proceedings of the 1st International Conference on Autonomous Agents, February 5-8, 1997, Marina del Rey, CA., USA., pp: 209-216.
CrossRefDirect Link - Teodorovic, D., P. Lucic, G. Markovic and M. Dell’Orco, 2006. Bee colony optimization: Principles and applications. Proceedings of the 8th Seminar on Neural Network Applications in Electrical Engineering, September 25-27, 2006, Belgrade, Serbia and Montenegro, pp: 151-156.
CrossRefDirect Link