
P.A. Ekunwe
Department of Agriculture, Benson Idahosa University, Benin City, Nigeria
S.I. Orewa
Department of Agriculture, Benson Idahosa University, Benin City, Nigeria
C.O. Emokaro
Department of Agriculture, Benson Idahosa University, Benin City, Nigeria
Asian Journal of Agricultural Research
Year: 2008 | Volume: 2 | Issue: 2 | Page No.: 61-69


ABSTRACT
The study examines resource use efficiency on yam production in Delta and Kogi States of Nigeria. Both primary and secondary data were used for the study. Primary data were collected using a set of structured questionnaire from 200 selected Agricultural Development Programme (ADP) contact yam farmers from each state. A multi-stage sampling technique was used in selecting the 200 farmers from each state, which were then interviewed by trained enumerators, out of these 200, only 146 and 144 copies of the questionnaires from Delta and Kogi States, respectively were found adequate and used in the analysis for the study. Data collected were analysed using descriptive statistics such as mean and standard deviation, marginal analysis as well as the stochastic frontier production function. Results from the study show that on the average more males (98.6%) were involved in yam production in both states as compared to 1.4% in the case of female. The technical efficiency of the farmers in both States varied. In Delta State, their technical efficiency varied from 0.20 to 0.93 with a mean of 0.85, while about 80% of the farmers had technical efficiencies exceeding 0.80. In Kogi State, the technical efficiency of farmers varied from 0.20 to 0.95, with a mean of 0.65, while only about 23% of the farmers had technical efficiencies exceeding 0.80. The results for resource use efficiency show that there were under utilization of land, labour and planting materials (seed yam) as the ratios of the value of marginal product to marginal fixed cost were greater than one in both states.
PDF Abstract XML References Citation
How to cite this article
P.A. Ekunwe, S.I. Orewa and C.O. Emokaro, 2008. Resource-Use Efficiency in Yam Production in Delta and Kogi States
of Nigeria. Asian Journal of Agricultural Research, 2: 61-69.
DOI: 10.3923/ajar.2008.61.69
URL: https://scialert.net/abstract/?doi=ajar.2008.61.69
DOI: 10.3923/ajar.2008.61.69
URL: https://scialert.net/abstract/?doi=ajar.2008.61.69
INTRODUCTION
Yam is a highly valued staple food crop in Nigeria, with the bulk of it consumed boiled or pounded. Sub-Saharan Africa currently produces about 90% of the world`s total yam output, while the rest is grown in the West Indies and parts of Asia, South and Central America. Over 600 yam species are currently grown around the world but only three species are known to be grown in West Africa. The species are white yam (Dioscorea rotundata), yellow yam (Dioscorea cayenesis) and water yam (Dioscorea alata) and these are also the species cultivated in Nigeria (International Institute of Tropical Agriculture, 1988; Okaka and Anajekwu, 1990; Okaka et al., 1991). In the yam-producing areas of West Africa, many important cultural values are attached to it, especially during weddings and other social and religious ceremonies. Its consumption is also relatively high in urban areas in spite of the competition from other products like maize, cassava, rice and sorghum (International Institute of Tropical Agriculture, 2001; FAO, 2001). Yam production in Nigeria has more than tripled over the past 45 years, from 6.7 million tons in 1961 to 39.3 million tons in 2006 (FAO, 2007). This increase in output is attributed more to the large area planted to yam than with increased productivity. Though the area cultivated to yam is still being increased, production growth rate declined tremendously from the average of 27.5% between 1986 and 1990 to 3.5% in the 1996-99 periods. However between 2001-2006 production growth rate increased by about 31.5%.
Decline in average yield per hectare has been more drastic; it dropped from 14.9% in 1986-90 to -2.5% in 1996-99 (Central Bank of Nigeria, 2002; Amegbeto et al., 2002). However increase in average yield has been recorded (23.4%) between 2001-2006 (FAO, 2007). The observed productivity decline in Nigeria before the 2001 to 2006 periods represents a major challenge to increasing yam production and its availability as food in the country.
Delta and Kogi States are located in the yam producing areas of Nigeria. Over time, farm productivity has begun to decline and this has affected the production of yam in virtually all the yam producing areas in Nigeria. The decline in productivity could be due to decline in the unit output from the various agricultural inputs. These are capital, land, labour and management. Also, there are likely constraints in yam production that would have significant effect on overall yield. Such constraints would include factors such as soil fertility decline, soil borne pest and diseases, inadequate planting materials, high cost of labour, labour intensive operations and the marketing of the product.
This study examines the importance of yam in the socioeconomic life of yam farmers in the study area. It intended to promote regional crop specialization and gives baseline information for decision making. It also intended to identify the causes for the decline in the growth rate in yam production in Nigeria and the socioeconomic problems farmers are faced with and how they affect their levels of productivity, amongst others.
This research focused on resource-use efficiency in yam production in Delta and Kogi States with a view to making some comparison. It is expected that the findings would help in providing solutions to the declining productivity and yield of yam per hectare and encourage yam producers to export some of their produce. The general objective of the study was to examine the efficiency of resources used on yam production in Kogi and Delta States. To achieve this, the following specific objectives were considered to describe and compare the socio-economic characteristics of yam producers in Kogi and Delta States, to determine and compare the resource use efficiency and technical efficiency for yam production in the study area and to make recommendations on improvements in the efficiency of yam production in the study area.
MATERIALS AND METHODS
Area and Scope of the Study
The study was carried out in 2006 in the Northern part of Delta State and the Eastern part of Kogi State. Northern Delta and Eastern part of Kogi States are among the major yam producing areas in Nigeria. They possess similar climatic conditions and share boundaries with the River Niger.
Delta State is made up of 25 Local Government Areas (LGAs). The LGAs selected for the study in Delta State are; Oshimili North, Aniocha North, Ika North East, Ndokwa West and Oshimili South. The state has a tropical climate marked by two distinct seasons; the dry and raining season. Delta State is rich in tubers and root crops such as yam, cassava, cocoyam and sweet potatoes. Geographically, the state lies within longitude 17.5° East and latitude 1.9° South of the Greenwich Meridian.
Kogi State on the other hand is made up of twenty (20) LGAs. The LGAs selected for the study in Kogi State were; Dekina, Idah, Ankpa, Ofu and Omala. The State is blessed with suitable ecological and climatic conditions and this is attested to by the wide variety of crops grown in the area such as yam, maize and sorghum. Geographically the State lies between longitude 6° and 9° East and latitude 4° and 7° North of the Greenwich Meridian.
Sampling Technique
A multi stage sampling technique was adopted in selecting yam producers within the yam producing areas in both States (Delta and Kogi). The first stage was a purposive sampling of Delta North and Kogi East. The second stage involved selecting Five Local Government Areas (LGAs) out of eight in Delta North and five LGA out of nine in Kogi State (Kogi East). The third stage involved a simple random sampling of 5 villages from each LGA and finally eight ADP contact farmers from each village using the Agricultural Development Programme (ADP) list of contact farmers from each village as the sampling frame. In all, 200 yam farmers were interviewed in each State using trained enumerators who administered well-structured questionnaire. However for the analysis only 146 copies of the questionnaires from Delta State and 144 copies from Kogi State were found adequate and used for the study bringing the sample size to 290.
Analytical Techniques
Three analytical techniques were employed in this study as shown below.
Descriptive Statistics
Descriptive statistics such as (Mean, Standard deviation, frequency counts and percentages) were used to analyse the socio-economic characteristics of the farmers in the study area.
Stochastic Frontier
The stochastic frontier production function was used to analyse the efficiency of inputs used in the production of yam in the study areas. A production frontier is defined in terms of the maximum output that can be achieved from a set of inputs given the technology available to the farm.
The production technology of the farmers was specified by the Cobb-Douglas frontier production function defined by Coelli (1994) as:
logY = b0 + b 1logX1+ b 2logX2+ b 3logX3+ b4log X4+ (Vi-Ui) | (1) |
| Where: | ||
| Log | = | Natural logarithm |
| Y | = | Quantity of yam produced in kg ha-1 |
| X1 | = | Area cultivated with yam (ha) |
| X2 | = | Planting materials (seed yam) kg ha-1 |
| X3 | = | Labour (man-days ha-1) |
| X4 | = | Fertilizer (kg ha-1) |
| b0, b 1, b2 and b 3 | = | Regression coefficients |
| Vi | = | Random variables which are assumed to be independent of Ui, identical and normally distributed with zero mean and constant variance N (0, σV2). |
| Ui | = | Non-negative random variables which are assumed to account for technical inefficiency in production and are often assumed to be independent of Vi such that U is the non-negative truncated (at zero) of half normal distribution with |N (0,σU2)|. |
The inefficiency of production, Ui was modeled in terms of the factors that are assumed to affect the efficiency of production of the farmers. Such factors are related to the socioeconomic variables of the farmers. The determinant of technical inefficiency is defined by Coelli (1994):
μ= δ0 + δ1Z1i + δ2Z2i + δ3Z3i + δ4Z4i + δ5Z5i + δ6Z6i | (2) |
| Where: | ||
| μ | = | Technical inefficiency |
| Z1 | = | Gender |
| Z2 | = | Age |
| Z3 | = | Marital status |
| Z4 | = | Family size |
| Z5 | = | Educational level |
| Z6 | = | Farming experience |
| δ0 to δ6 | = | Inefficiency parameters |
These variables are assumed to influence technical efficiency of the farmers. The gamma (γ = δu2/δ2) which is the ratio of the variance of U (δu2) to the Sigma squared (δ2) which is a summation of variances of U and V (δu2+δv2) were also determined. The Maximum Likelihood Estimate Method using the computer FRONTIER version 4.1 was used to estimate the parameters of the Stochastic Frontier Production Function (Coelli, 1994).
Marginal Analysis Concept
For resource use efficiency, Marginal Factor Costs (MFCs) was compared with Value of Marginal Products (VMPs) and their ratios were calculated to decide on the efficiency of resource use. The Marginal Physical Product (MPP) is given as:
(3) |
Where
| MPPxi = Marginal physical product of the inputs X1-X4 in Eq. 1 |
When VMP is greater than MFC, then a resource is said to be under utilized and vice versa. Efficiency is upheld when VMP = MFC. The VMP was calculated using the following formula:
VMPxi = MPPXi. Py | (4) |
| Where: | ||
| Xi | = | Mean value for each of the inputs |
| Py | = | Unit price of the output |
| VMP | = | Value of marginal product of Xi |
Marginal Factor Cost (MFC) is equal to the unit price of the input
At equation:
VMPxi = MFC = Pxi | (5) |
VMPxi = MPPxi. Py = Pxi | (6) |
MPPxi Py = Pxi | (7) |
Therefore,
MPPxi. = Pxi/Py (Utomakili and Aganmwonyi, 1995) | (8) |
RESULTS AND DISCUSSION
Socioeconomic Characteristics of the Respondent Yam Farmers
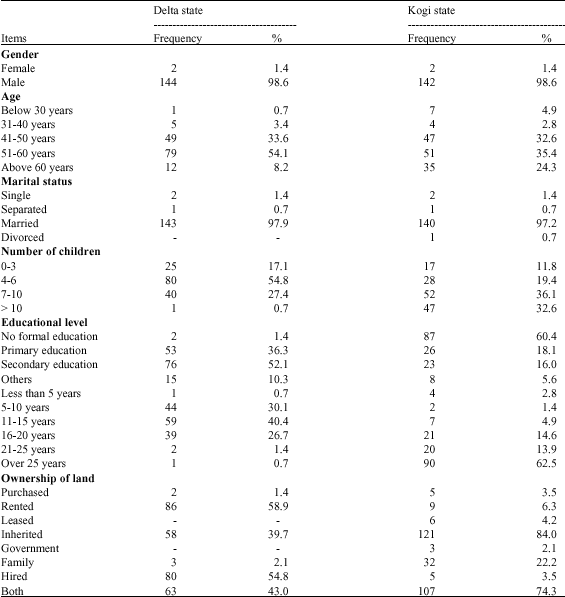
The results on the socioeconomic characteristics are presented in Table 1. With respect to gender equal percentages (98.6 and 1.4%) of male and female, respectively were involved in yam production in both States. This shows that yam farmers in Delta and Kogi States were predominantly male. This corroborated with the research of Agbaje et al. (2005), which showed that 98% of yam farmers in Ondo State were males. The analysis of the data for Delta State indicated that 54.1% of the farmers were within the age bracket of 51 and 60 years, while in Kogi State it was 35.4%. In Kogi State 24.3% of the farmers were above 60 years while in Delta State only 8.2% were above 60 years. The mean age of farmers in Delta State was about 52 years while that of Kogi State was 53 years. However the mean age showed that farmers in both States are aging. The results showed that most of the farmers were married. This is shown in Table 1 also. In Delta State 97.9% of the farmers` interview were married, while for Kogi State it was 97.2%. The rest of the farmers were single, separated or divorced.
| Table 1: | Socioeconomic characteristics of Yam farmers in Delta and Kogi States |
 | |
| Source: Computer from field data 2006 | |
This result again is in agreement with the findings of Bamire and Amujoyegbe (2005) who found about 98% status of farmers in Ekiti State to be married. The result of the analysis showed that in terms of family size Delta State had an average of seven persons per family, while Kogi State had nine persons per family. In Delta State, about 92% of the farmers had one wife, while in Kogi State only 69% of farmers had one wife. Forty one percent of farmers in Kogi State had two wives, while those in Delta State with two wives were only 8%. The result also showed that farmers in Delta State with Children below 10 were 99.3%, while for Kogi State it was 67.4%. On the other hand farmers with children above 10 in Delta State were 0.7% while that of Kogi State was 32.6%. The results show that Kogi State yam farmers had larger family size as compared to Delta State yam farmers.
The results showed that in Delta State, farmers who had up to secondary school education were 52.1%, while in Kogi State they were only 16%. Those with no formal education were also more in Kogi State (60.4%) as opposed to 1.4% for Delta State. In Delta State, the average year of formal education of the farmers was 10 years, while in Kogi State it was about four years. This results show that farmers in Delta State are more educated than those in Kogi State. This agrees with the finding of Bamire and Amujoyegbe (2005) which also showed that yam farmers in Southern and Middle belt of Nigeria had an average of only three and seven years of formal education, respectively. The result of the data analysis showed that majority of the farmers in Delta State had farming experience of between 11 to 15 years (40.4%), while for Kogi State it was 4.9%. In Delta State yam farmers with farming experience over 25 years were 0.7%, while for Kogi State it was 62.5%. The average farming experience for yam farmers in Delta State was 18 years, while for Kogi State it was 25 years. It shows that farmers in Kogi State have long been in the yam production business.
The farm ownership structure for the two states as presented in Table 1 also showed that farm ownership system in Kogi State was mainly through inheritance (84%), while in Delta State it was mainly rented land (58.9%). In Kogi State the other forms of farm ownership included purchased land (3.5%), rented land (6.3%), leased (4.2%) and government owned land (2.1%), while in Delta State the purchased farm land was 1.4% and inherited land was 39.7%.
The analysis showed that the farm size varied from 0.05 to five ha in Delta and Kogi States. In Delta State the average farm size was 0.66 ha, while in Kogi State it was 0.97 ha. The results of the analysis show that the total land area cultivated by the farmers in Delta State was 98.94 ha, while in Kogi State it was 137.18 ha. This agrees with the findings of Utomakili and Aganmwonyi (1995) which revealed that farm sizes are small in Nigeria with an average less than five ha.
The source of labour revealed that in Delta State, 43.2% of the farmers used both family and hired labour, while in Kogi State it was 74.3%. Also, in Delta State 2.1% of the respondents used family labour alone, while in Kogi State it was 22.2%. The percentage of farmers that used only hired labour in Delta State was 54.8%, while in Kogi State it was 3.5%.
Estimates of the Stochastic Frontier Production Function Parameters
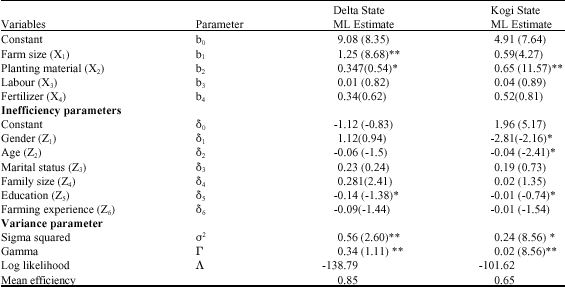
The results showed that all the independent variables (farm size, planting materials fertilizer and labour) had positive signs for both states. The estimated maximum likelihood coefficients for farm size was significant at 1% for Delta State and not significant for Kogi State, while for planting materials they were significant at 1% for Kogi and 5% for Delta. Fertilizer was not statistically significant at 5 or 1% level of significance for both States. The results obtained from the stochastic production function as shown by the ML for yam production in Delta and Kogi States are presented in Table 2.
Technical Inefficiency of the Respondents
The sign of the coefficient of the variable in the inefficiency model is very important in explaining the observed level of technical efficiency of the farmers. A negative coefficient implies that the variable has the effect of reducing technical inefficiency. While a positive coefficient has the effect of increasing technical inefficiency.
| Table 2: | Stochastic estimation of production function for Delta and Kogi States |
 | |
| Values in parenthesis are t-ratio, *Significant at 5% level, **Significant at 1% level, Source: Computed from primary data 2006 | |
Technical inefficiency parameters for the farmers in Delta and Kogi States as shown in Table 2 indicated that age education and farming experience contributed negatively to farmers` inefficiency in both States. This means that farming experience, education and age led to decline in technical inefficiency. This result also confirmed a priori expectation that the more experienced and educated farmers have higher level of technical efficiency than the less experienced and educated farmers. Family size and marital status contributed positively to farmers` inefficiency in both States. This means that these variables led to increase in technical inefficiency. In Kogi State only gender, education and age were statistically significant at 5% level of significance, but in Delta State only education was statistically significant at 5% level of significance, while others that is age, gender, farming experience and family size were not significant at 1 or 5% levels of significance.
The sigma square (σ2) is statistically different from zero at 1% level thus going credibility to the goodness of fit of the model from the MLE as well as the correctness of the specific distributional assumption of the composite error term (V-U) for Delta and Kogi States.
The variance ratio (γ = σu2/σ2) estimated was 0.34 for farmers in Delta State and 0.02 for farmers in Kogi State and were both statistically significant at 1% level. This infers that 34 and 2% of the variation in yam output among the farmers in Delta and Kogi States, respectively was due to differences in their technical efficiencies.
Range of Technical Efficiency of the Respondents
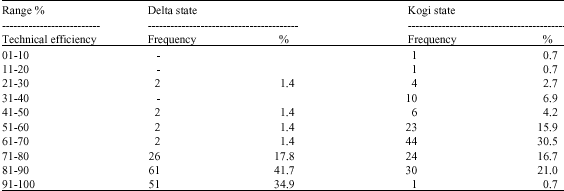
The computed mean for the technical efficiency range showed that 79% of the farmers in Delta States fell within the 81-90% range of technical efficiency, while in Kogi State only 23.5% of farmers fall within that same range. The technical efficiency of farmers in Delta and Kogi States showed that yam farmers in Delta State were more technically efficient than their counterparts in Kogi State. The technical efficiency of yam producers in Delta and Kogi States are shown in the frequency distribution table (Table 3).
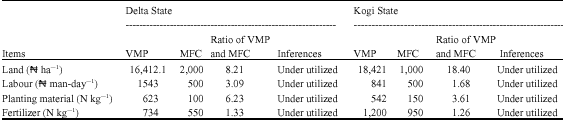
Marginal Analysis of the Farmers’ Inputs
The VMP for land (farm size) labour and planting materials were higher than their MFC, implying under utilization of the inputs by yam farmers in Delta and Kogi States. Also, the VMP/MFC ratios which were also greater than one, indicating the existence of resource-use disequilibria and in this case, with under utilization of inputs, yam farmers in both States could have increased their output and raised their profit margin by increasing their average farm size, labour and expenditure on planting materials.
| Table 3: | Range of technical efficiency (%) in Delta and Kogi States |
 | |
| Source: Computed from primary data 2 | |
| Table 4: | Marginal analysis of input use by yam farmers in Delta State and Kogi State |
 | |
| Source: Derived from field data 2006 | |
This is in agreement with Fasasi and Fasina (2005) who also showed that labour, seed yam and farm size were under utilized in Ondo State. Table 4 shows the marginal analysis of input used by farmers in the study area.
CONCLUSION
This study has contributed enormously to knowledge in the area of resource use efficiency. This study noted from the analysis carried out that farmers in Delta State were more technically efficient than those in Kogi State due to the influence of socioeconomic variables such as gender, family size, marital status and education.The study also shows that resources were under utilized in the traditional agriculture practice of yam farmers in Delta and Kogi States. The under utilized resources included labour, land, fertilizer and planting materials (seed yam). The result showed that there was disequilibrium in the use of resources, since the VMPs were greater than the MFCs for labour, land and planting materials (seed yam). The study therefore identified that improving efficiency in yam farming is relevant for increased agricultural production in both States. Although several studies have been carried out on yam production in the study areas, no comprehensive comparative analysis on yam production between Delta and Kogi States has been carried out. If in the future there is need to promote regional crop specialization, this study gives baseline information for decision as to which State might be more favoured for promoting increased yam production.
UDIMAL THOMAS BILALIIB Reply
Congratulation for the nice job done.But I will be very gratefull to have the full version of your research ,as I am also planninng to do mine on profitability and technical efficiency on yam