
E. Aflaki
Department of Civil and Environmental Engineering, Amirkabir University of Technology, Hafez Ave, Tehran, Iran
Asian Journal of Applied Sciences
Year: 2009 | Volume: 2 | Issue: 1 | Page No.: 50-62


ABSTRACT
This study deals with the analysis and monitoring aspects of Shirindarreh earth dam with the height of 64 m which is located in the northern Khorasan Province in Iran. Characteristics of the foundation and six types of available materials for construction are described. For design of this dam, the major considerations were controlled under seepage and deformations i.e., arching and settlement criterion. Large deformation of the body and foundation of an earth dam can cause the core to be cracked. As a result, concentrated seepage and piping through the core might be developed. On the other hand, control of the stresses in the core and shell needs specific attention to the arching phenomena. To achieve the above mentioned purposes data from monitoring of instrumentations have been compiled. Stress-strain distribution in the body and foundation of the Shirindarreh earth dam at the end of construction is evaluated using PLAXIS software (Version 7.2) and its hardening soil model which is based on total stress approach. The results have been compared with measured data. Generally, the results of back analyses show good agreement with those of instrumentation.
PDF Abstract XML References Citation
How to cite this article
E. Aflaki, 2009. Comparing Numerical Analysis Predictions and Experimental Data for Shirindarreh Embankment Earth Dam. Asian Journal of Applied Sciences, 2: 50-62.
DOI: 10.3923/ajaps.2009.50.62
URL: https://scialert.net/abstract/?doi=ajaps.2009.50.62
DOI: 10.3923/ajaps.2009.50.62
URL: https://scialert.net/abstract/?doi=ajaps.2009.50.62
INTRODUCTION
Providing water for irrigation of some parts of the northern Khorasan Province in Iran, water for drink and industry of the province, environmental water supply and flood control were the main purposes which have been considered by Khorasan Water Organization. Therefore, design and construction of the Shirindarreh earth dam is supervised by the same organization. Shirindarreh dam on the Shirindarreh river, one of the Atrak river branches, was constructed between 2003 and 2007 forms a 91.5 MCM reservoir and 63 m height from the riverbed. The construction of this dam was of considerable geotechnical interest, due to the different material used in construction of the shell. This research gives details of some important aspects of material characteristics and the method of their determination based on the laboratory test results, instrumentation and monitoring data and back analysis. Readings carried out and the results of analysis compared with those of instrumentation data. Subsequently, the behavior of the dam was evaluated.
Different ideas and methods have been proposed about the earth dams design, investigation of their functioning, behavior during construction and operation stages. Among them, Rouainia and Wood (2001), Lollino et al. (2005), Rozycki et al. (2006), Guler et al. (2006), Pagano and Desideri (2006) and also back analysis method are well-known approach that can modify the design assumptions and led to the optimization of up coming projects. The dam performance at the end of construction mainly based on settlement and arching is considered.
SHIRINDARREH EARTH DAM AND THE GEOLOGICAL SETTING
Shirindarreh dam is a central clay core earth dam type. It has been constructed on the Shirindarreh river, one of the Atrak river branches. The highest cross-section of the dam, the location of total pressure cells and inclinometers and also the dam longitudinal section along its axis are shown in Fig. 1-3, respectively.
The rocks underlying the site are sediments of the Certaceous Sarcheshmeh Formations and are typically shale and clay-marl as it is presented in Fig. 4. The region has been subjected to complex faulting, folding and fracturing. More recent geological deposits are granular alluvium in the valley bottom. Geological section of the formations along the axis of the Shirindarreh dam is shown in Fig. 4.
Site investigations were conducted in stages to establish the dam foundation conditions and to investigate materials for use in construction. Because of the limited borrow area, different sites for shell material supply, were detected and so different materials were used for the dam shell. Some soil layers contain a high percentage of flaky, elongated materials and fine grains. Analysis shows that they have been displaced more than expected. The triaxial strength and consolidation test results including the general information about the dam geometry are shown in Table 1. Dam body construction began on May 2003 and finished on March 2007.
 | |
| Fig. 1: | The highest cross-section of Shirindarreh dam |
 | |
| Fig. 2: | Location of total pressure cells and inclinometers in section 5 of Shirindarreh dam |
 | |
| Fig. 3: | Longitudinal section along the axis of Shirindarreh dam at the location of section 5 |
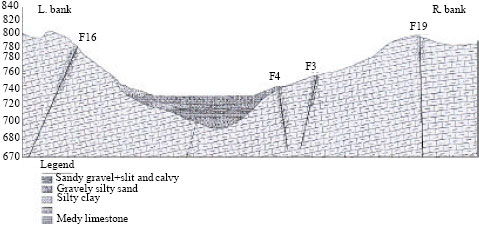 | |
| Fig. 4: | Geological section showing the geological formations |
NUMERICAL MODELING AND STAGES OF ANALYSIS
The major purpose of this research is studying the displacements, cracking and arching of dam body regarding the total stress analysis. Therefore, the analyses were conducted by total stress method and the use of associated parameters. In the detailed study of the dam, the consolidation analysis were performed and the results show that the foundation alluvium behaves drained. Consequently, the effective parameters of foundation alluvium are included in the modeling.
The analysis were carried out only for the highest cross section of the dam as follows:
| • | In situ stress calculation for foundation alluvium, before the dam construction |
| • | Cofferdam modeling |
| • | Main dam modeling, layer by layer approach and in 9 layers |
The generated finite element mesh of the model is shown in Fig. 5.
MATERIAL CONSTITUTIVE MODEL
Considering several soil mechanics tests results related to materials of the foundation alluvium and different parts of the dam body, the Hardening Soil Model which is included in PLAXIS Version 7.2 code is used for the modeling.
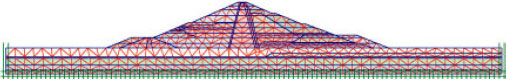 | |
| Fig. 5: | The finite element mesh of the model at the highest cross-section of the Shirindarreh dam |
Hardening Soil Model
This model is an elastoplastic model with the following features:
| • | Yield surface can be expanded due to plastic strains (in contrast with perfect elastoplastic constitutive model in which yield surface is constant) |
| • | Two types of hardening are defined in the model: Shear and compressive hardening. |
| • | In drained triaxial loading condition, relation between deviatoric stress and axial strain is assumed to have an equation of hyperbolic form Duncan and Chang (1970) |
| • | The use of the theory of plasticity, formulating the soil dilatancy at shear and introduction of a yield cap are advantages of the special PLAXIS Version 7.2 hardening model beside well-known hyperbolic model |
Similar to that of Duncan and Chang (1970), constitutive curve of this model is hyperbola. The material stiffness is dependent on both the lateral stress level and the value of deviatoric stress. Three kinds of stiffnesses are determined by the Eq. of 1-3 and the angle of dilatation can be determined by Eq. 4.
| | (1) |
| | (2) |
| | (3) |
| | (4) |
The main parameters of the model are:
| C | : Cohesion |
| ψ | : Angle of dilatancy |
| φ | : Angle of internal friction |
| : Secant stiffness in standard drained triaxial test | |
| : Tangent stiffness for primary oedometer loading | |
| : Unloading/reloading stiffness | |
| m | : Exponent for stress-level dependency of stiffness |
| Pref | : Reference stress for stiffness (default Pref = 100 stress unit) |
Determination of Numerical Model Parameters
The Parameters of Foundation Alluvium
The foundation alluvium of Shirindarreh dam site is composed of five layers with three different materials, as shown in Table 1. Using back analysis method and the detailed phase study of the dam analysis, the required parameters for material hardening model were fixed.
| Table 1: | Shirindarreh dam geometry and material characteristics |
 | |
| Table 2: | Hardening soil model parameters for foundation alluvial materials of the Shirindarreh dam |
 | |
In addition, the results of laboratory and in-situ soil mechanics tests were considered. The summary of different parameters of soil layers are presented in Table 2.
The Parameters of Dam Embankment Materials
Hardening parameters of the dam body material were determined as follows:
| • | Determination of strength parameters was based on the triaxial test results |
| • | Initial approximation of the stiffness and deformability parameters were based on triaxial and consolidation test results |
| • | Parameters for different materials of the dam body were fixed based on the back analysis method. In this analysis, effort was made to achieve the maximum displacement value at the end of construction. In addition, minimizing the difference between instrumentation data and analytical results was realized. At the end of this stage, an acceptable approximation of parameters for dam body materials was obtained. |
| • | The initial approximation of parameters for filter and drain materials was selected from similar samples. |
| • | Gharnas, Shirindarreh riverbed, Atrak and Masil 7 materials were used for the upstream shell but Gharnas, Shirindarreh riverbed, Masil 2 and rockfill were used for the downstream shell of the dam. |
The parameters of different parts of the Shirindarreh dam body (core, filter, drain and shell) are shown in Table 3.
RESULTS
For studying the total vertical stresses and settlements of the dam body, the following measured data from instrumentations in dam cross-section 5 (Fig. 2, 3) such as inclinometers (INC), Magnetic Settlement gauge (MS) and Total Pressure Cells (TPC) have been compared with the numerical analyses results.
| Table 3: | Hardening soil model parameters for Shirindarreh dam body |
 | |
| Table 4: | Values and level of maximum settlement obtained from monitoring and analysis for crosss-section 5 of Shirindarreh dam |
 | |
Settlement Results
The values of vertical displacements in horizontal cross section 5 of Shirindarreh dam were obtained from INC.5-1, INC.5-2 and MS.5-1 instruments. The maximum data and their elevation for both monitoring and analytical results are presented in Table 4.
The settlement diagrams for both instrumentation data and numerical analyses are drawn in Fig. 6-8. It can be observed that the diagrams are related to the reading after embankment completion (end of construction). The dam crest level and riverbed are 800.5 and 736.5 above m.a.s.l, respectively. A good correlation is observed between analytical outputs and those of instrumentation data. The trend of settlement curves are expected to be normal.
Review of Fig. 6 and 7 accentuates the following points:
| • | The maximum settlement is measured by inclinometer (INC.5-1) installed in clay core. It was in a highest elevation compared with those that installed in the shell |
| • | The maximum settlement of the dam body was occurred in the core and is about 1.8 m. The occurrence of this large settlement is due to the high compressibility and low consistency of fine-grained layers of foundation alluvium and dam materials |
| • | The maximum settlement of foundation alluvium in the upstream and downstream is 1.18 and 1.32 m, respectively. The reason for this difference of settlement is the thickness of fine-grained layers in the downstream, which is more than the thickness of similar layers in the upstream. This point was considered in the analysis |
By comparing the analyses outputs and monitoring data, the following points can be stated about the causes of high values of settlements:
| • | Low consistency of some of the foundation alluvium that have fine-grained texture predominates more in downstream than upstream. |
| • | Inadequate stiffness of some parts of the shell; It is necessary to remark that Shirindarreh dam shell consists of six different materials. Back analyses have presented stiffness module of these parts with appropriate approximation and indicates that rating of their quality from highest to lowest is Rockfill, Atrak, Masil 7, Masil 2, Gharnas and Shirindarreh riverbed |
| • | The coarse materials from the Shirindarreh riverbed and the ravines, form the materials for the dominant part of the shell that contain many flaky and elongated aggregates. During the compaction operation, part of the aggregates has been crushed under the roller such that the fine grains reached to 20-30%. In addition, they have cracking potential so that the observation of transverse cracks on the crest and longitudinal ones on the downstream berm might be related to a relatively large settlement of the foundation alluvium and the brittle behavior of the above-mentioned materials |
| • | Gharnas coarse materials are resistant rounded aggregates but they have many fines and therefore show soft behavior |
 | |
| Fig. 6: | Comparison between measured and numerical analysis settlements (INC.5-1) |
 | |
| Fig. 7: | Comparison between measured and numerical analysis settlements (INC.5-2) |
 | |
| Fig. 8: | Comparison between measured and numerical analysis settlements (MS.5-1) |
| Table 5: | Comparison between total vertical stresses obtained from analyses and instruments readings at the end of construction stage (for cross section 5) |
 | |
| σv: Total stress, q: Overburden stress | |
Total Stress Results
Values of total stresses were taken from total pressure cells (TPC.5-1 to TPC.5-9). The results of instrumentation data and the magnitude of total vertical stresses were obtained from these instruments after the end of dam construction (Table 5).
Arching in embankment dams is as a result of vertical stress reduction at a point due to transfer of some of its overburden stresses to the other parts of the dam body or abutments. Vertical stress is a significant factor for closing the possible horozontal core cracks. Therefore its decreasing can be led to serious damages of dam body. During dam impounding, water penetrates into the cracks which increase pressure on the crack walls. Consequently hydraulic fracturing in the core and finally dam failure may occur.
Arching ratio is defined as the ratio of the total vertical stress (σv) to overburden stress (q), which is given in Table 5. Due to the arching phenomenon, all of the total pressure cells installed in the core resulted in arching ratio less than unity. While this ratio is more than unity based on the results of drain total pressure cell (TPC.5-8). This can be correlated to the numerical analysis and observed behavior of other earth dams.
The total pressure-time (date)-embankment elevation diagrams are presented in Fig. 9-17 for all nine total pressure cells. In each figure, four curves are plotted. Two of these curves show the stress values obtained from instrumentations and analysis. The other two denote the embankment elevation and its weight.
 | |
| Fig. 9: | Comparison between TPC.5-1. Readings and numerical analysis |
 | |
| Fig. 10: | Comparison between TPC.5-2. Readings and numerical analysis |
 | |
| Fig. 11: | Comparison between TPC.5-3. Readings and numerical analysis |
 | |
| Fig. 12: | Comparison between TPC.5-4. Readings and numerical analysis |
 | |
| Fig. 13: | Comparison between TPC.5-5. Readings and numerical analysis |
 | |
| Fig. 14: | Comparison between TPC.5-6. Readings and numerical analysis |
 | |
| Fig. 15: | Comparison between TPC.5-7. Readings and numerical analysis |
 | |
| Fig. 16: | Comparison between TPC.5-8. Readings and numerical analysis |
Analytical results have indicated a good correlation with measured values. However, the following points should be noted about the nine total pressure cells:
| • | TPC.5-1 total pressure cell: Instrument reading curves have good correlation with analytical result in the period of 19/Aug/2004 to 26/Oct/2004. From 26/Aug/2004, a reduction in instrument readings is shown. This may be due to incorrect readings. Again, the increasing trend of readings is established |
| • | TPC.5-2, 3, 6 and 8 total pressure cells: General trend of the curves obtained from analyses and readings has a suitable consistency |
| • | TPC.5-4 and 7 total pressure cells: The stress quantities resulted from analyses shows a close trend with the increasing of embankment weight but, measured and analytical curves have a considerable discrepancy. This might be due to instrument failure or false readings |
| • | TPC.5-5 total pressure cell: A constant difference is noticed between stresses obtained from instrument and analysis throughout entire reading period |
| • | TPC.5-9 total pressure cell: This instrument is definitely unsound. Analyses of stresses are close to embankment weight |
 | |
| Fig. 17: | Comparison between TPC.5-9. Readings and numerical analysis |
The results of numerical analyses are somewhat more than those obtained from monitoring data. This could be due to the effect of third dimension and stress devolution from dam center to the abutments especially due to the relatively large settlement of the foundation alluvium.
CONCLUSION
The performance and behavior of Shirindarreh earth dam, realizing the displacement and arching criteria based on total stress approach have been studied. Due to borrow limitations six non-regular coarse grained materials have been used for dam construction. Regarding the comparison of numerical back analysis using PLAXIS Version 7.2 and measured data gathered from monitoring, the following results are derived.
The relatively large settlement of Shirindarreh earth dam can be related to the low consistency of some of the foundation alluvial deposits and low stiffness of some parts of the shell materials. Average of arching ratio in the core is 0.6 which indicates the occurrence of non-severe arching. Therefore, in the first reservoir impounding, the hydraulic fracturing in the core may occur. Studies also denoted that in general, instruments installed in the highest dam section have a proper performance and their outputs are reliable. Ultimately, the suitable agreement of measured and predicted output of back analysis of embankment dam body can be led to more optimized design in upcoming projects.
REFERENCES
- Duncan, J.M. and C.Y. Chang, 1970. Nonlinear analysis of stress and strain in soils. J. Soil Mech. Found. Division, 96: 1629-1653.
Direct Link - Pagano, L., S. Sica and A. Desideri, 2006. Representativeness of measurements in the interpretation of earth dam behaviour. Can. Geotech. J., 43: 87-99.
CrossRefDirect Link - Guler, G., H. Kilic, G. Hosbas and K. Ozaydin, 2006. Evaluation of the movements of the dam embankments by means of geodetic and geotechnical methods. J. Surving Eng., 132: 31-39.
CrossRefDirect Link - Lollino, P., F. Cotecchia, L. Zdravkovic and D.M. Potts, 2005. Numerical analysis and monitoring of pappadai dam. Can. Geotech. J., 42: 1631-1643.
CrossRefDirect Link - Rouainia, M. and W.D. Muir, 2001. Implicit numerical integration for a kinematic hardening soil plasticity model. Int. J. Numerical Anal. Meth. Geomechanics, 25: 1305-1325.
CrossRefDirect Link - Rozycki, A., J.M. Ruiz Fonticiella and A. Cuadra, 2006. Detection and evaluation of horizontal fractures in earth dams using the self-potential method. J. Eng. Geol., 82: 145-153.
CrossRefDirect Link