
M. Davoodi
Geotechnical Engineering Research Center, International Institute of Earthquake Engineering and Seismology, Tehran, Iran
M.A. Sakhi
Geotechnical Engineering Research Center, International Institute of Earthquake Engineering and Seismology, Tehran, Iran
M.K. Jafari
Geotechnical Engineering Research Center, International Institute of Earthquake Engineering and Seismology, Tehran, Iran
Asian Journal of Applied Sciences
Year: 2009 | Volume: 2 | Issue: 1 | Page No.: 36-49


ABSTRACT
In this study, the classical and modern signal processing methods are used to extract dominant frequencies of Masjed Soleiman dam, the highest embankment dam in Iran. The signals were recorded in the gallery, mid-height and the crest of the dam during local earthquakes. Since the amplitude and frequency contents of earthquake acceleration time histories vary with time, classical signal processing techniques are limited to extracting the exact characteristics of the signal. Time-frequency distribution and wavelet analysis were used in this study to overcome this limitation. The proposed modal frequencies of the dam body were evaluated using both the classical and new techniques and the results compared. Differences between the two sets of methods are described and the benefits of the modern signal processing methods are discussed. It is shown that, in non-stationary signals such as earthquake records, higher frequencies are extracted by modern methods that cannot be obtained using classical methods. Besides, the spectral variations of the scalograms clearly indicate that lower frequency contents become more dominant as the excitation amplitude decreases. The lower mode shapes of dam body are excited during the weak part of an earthquake, whereas during the stronger part, all the high and low modes are excited.
PDF Abstract XML References Citation
How to cite this article
M. Davoodi, M.A. Sakhi and M.K. Jafari, 2009. Comparing Classical and Modern Signal Processing Techniques in Evaluating Modal Frequencies of Masjed Soleiman Embankment Dam during Earthquakes. Asian Journal of Applied Sciences, 2: 36-49.
DOI: 10.3923/ajaps.2009.36.49
URL: https://scialert.net/abstract/?doi=ajaps.2009.36.49
DOI: 10.3923/ajaps.2009.36.49
URL: https://scialert.net/abstract/?doi=ajaps.2009.36.49
INTRODUCTION
Evaluation of the seismic behavior of embankment dams can be performed by observations made from dam response during earthquakes, testing such as blasting and ambient tests on prototype dams to determine dynamic properties, experiments on reduced scale models such as shaking tables or centrifuges or, finally, by analytical study. The use of recorded results of earthquake signals on embankment dams are recommended to verify the mathematical models used in the dam design stage for a better prediction of dam behavior. Several earlier studies have used ground motion data to estimate modal responses of embankment dams during seismic events (Gazetas, 1981a, b; Abdel-Ghaffar and Koh, 2006; Akkose et al., 2007).
The Kassa embankment dam in Japan has a height of 90 m and a length of 478 m. This dam was triggered by an earthquake which allowed the performance of system identification. As a basis for comparison of the those results, the dam was investigated using classical signal processing techniques under forced, ambient and blasting tests and the two records compared (Allen, 1977).
The earthquake on May 5, 1986 in Turkey caused extensive longitudinal cracks at the crest of Surgu dam and possible loss of slope stability. The researchers used numerical analysis in strong and weak motions to compare the damage that occurred on the dam body (Ozkan and Erdic, 1990).
A seismic stability assessment of the Ririe dam in Idaho was done by the U.S. Army Corps of Engineers. This dam is an earth and rockfill dam with a central impervious core constructed between 1966 and 1975 in a narrow canyon. The seismic analysis included a dynamic response analysis of the dam using the three-dimensional finite element method. Accelerogram records at the abutment during the October 28, 1983 Mt. Borah earthquake were also used to calculate the dynamic response of the dam body. From the analysis results, a finite element model and the soil parameters were calibrated to represent a 3D dynamic response of the dam more accurately (Mejia and Sykora, 1991).
As an experiment and a case study on embankment dams in Iran, the responses of the Masjed Soleiman dam body to forced vibrations, ambient vibrations and large explosives were measured (Jafari and Davoodi, 2006). First, the signals were analyzed using the classical signal processing methods of Power Spectra Density (PSD), Cross Power Spectra density (CPS), Coherency Spectra (CS) and also phase spectra (4-spectra method) and the dynamic characteristics of the Masjed Soleiman dam body were extracted. Next, the dynamic characteristics of the dam body were obtained by numerical analysis and the results compared with the in situ test results. The comparison showed that the 4-spectra method can be a powerful tool to process stationary signals.
In the present study, non-stationary recorded earthquake signals of the dam body were used to extract the dynamic characteristics of the dam. Classical signal processing methods such as the 4-spectra method which assume a stationary condition as their basis are not appropriate methods to identify the systems because of the non-stationary properties of the earthquake signals. Consequently, wavelet and Time-frequency Distribution (TFD) is required.
There are some applications of wavelet transforms in the wind and ocean engineering (Gurley and Kareem, 1999). Damping evaluation (Hans et al., 2000; Boltezar and Slavic, 2004) and system identification (Ghanem and Romeo, 2000; Kijewski and Kareem, 2003) are another applications of wavelet transforms. Also, this transform is used for modal analysis of structures (Ndambi et al., 2000; Yan et al., 2004; Chakraborty et al., 2006). Yan presented an integrated identification method to consider the uncertainty effect on modal parameters. This method is based on the wavelet transform (Yan et al., 2006). Site response during earthquake events is analyzed by wavelet methods, too (Zhou and Adeli, 2003; Montejo and Suarez, 2006). However identification of site frequencies is not as straightforward as the estimation of structural frequencies (Celebi, 2003). There are also a few applications in the areas of soil dynamics such as the works of Suarez (Suarez and Montejo, 2005). The Ovanesova used the wavelet method for locating the cracks in structural frames (Ovanesova and Suarez, 2004). Haigh used wavelet analysis to investigate the dynamic behavior of geotechnical structures (Haigh et al., 2002). Recently, Davoodi et al. (2007a) applied the wavelet method in signal processing and system identification of a structure. Davoodi et al. (2007b) also proposed the use of the wavelet transform method to process recorded explosion signals on Masjed Soleiman embankment dam.
Some applications of TFD can be found in engineering. Neild et al. (2003) presented a review of TFD tools for the analysis of non-linear vibrations of structures. A TFD was used to analyze the response of Longyangxia dam to blasting excitation. Longyangxia dam is a 178 m high concrete gravity arch dam located in China. The main purpose of the experiment was to process the dynamic response of a large dam-water-foundation system and to further study the dynamic behavior of arch dams, including dam-water-foundation interaction effects. In this study, blasting records were analyzed using the spectrogram method (Ghanaat and Chen, 1999).
As it can be seen in the literature review, little research has been reported on the use of wavelet transform and TFD methods to study the dynamic behavior of embankment dams under seismic loading. In this study, the recorded earthquake signals of Masjed Soleiman embankment dam were processed using the 4-spectra, TFD and wavelet methods to compare the evaluated modal frequencies. The results were compared with those of earlier studies and the benefits of the modern signal processing methods are described.
TFD SIGNAL PROCESSING METHOD
The 4-spectra method is a powerful, easy and straight forward method to process stationary signals (Jafari and Davoodi, 2006). Since it processes signals in only the frequency domain, non-stationary signals should be analyzed in both the time and frequency domains. The TFD method maps a one-dimensional signal into a two-dimensional function of time and frequency and describes how the spectral content of the signal changes with time. Many forms of TFD have been developed based on Short-Time Fourier Transforms (STFT) that are used to generate the spectrogram (SP) technique (Allen, 1977). Nawab and Quatieri (1988) have published a review of linear STFTs. STFT originates from the Fourier transform evaluation of a signal with the prior application of a suitable time window identifying the signal’s stationary segments. However, the frequency resolution provided by this technique is limited and inversely proportional to the duration of the segments to which the transform is applied.
The other form of TFD is the Wigner-Ville Distribution (WVD). The Cohen class of transform makes it possible to obtain time-frequency representations that are invariant to time and frequency shifts. The WVD satisfies a large number of desirable properties, but it suffers from cross-term interference when applied to multi component signals such as earthquake data. Cross-term interference causes the TFD to occasionally be negative. Furthermore, for multi-component seismic signals, the presence of cross-terms makes it almost impossible to carry out detailed signal identification and it is only possible to identify general characteristics. The Choi-Williams distribution overcomes WVD limitations supporting a great amount of the cross-term interference, but some time-frequency resolution is lost (Boashash, 1992).
In general, cross terms cannot be completely abolished. The newly Reduced Interference Distribution (RID) overcomes this problem to a significant extent. Margenau-Hill-Spectrogram TFD is another distribution that reduces interference distribution. Also a new time-frequency distribution with many attractive features; called ZAM; has been developed by Zhao et al. (1990). This distribution significantly enhances the time and frequency distribution and suppresses the cross terms. Furthermore, they have examined the basic conditions which a distribution must satisfy to have good time and frequency resolution.
Wang and Jiang (2008) presented three schemes for designing the generalized time-frequency distributions for multi-component Polynomial Phase Signals (PPS) based on the matched-phase principle. The PPS are illustrated as follows: (1) the scheme based on the Wigner-Ville distribution (WVD) and the L-Wigner-Ville Distribution (LWVD), (2) the scheme based on the fractional matched-phase principle and (3), the scheme based on the complex lags. The interference terms induced by the nonlinearity of the signals can be suppressed. For multi-component signals, the CLEAN technique is adopted to filter out each component by a band-pass filter and the interference terms between different components can be eliminated. The new generalized time-frequency distributions are superimposed to yield a high-readability representation.
Totally, there are many TFD methods for processing non-stationary signals that should be examined to extract the best method to give the best resolution in both the time and frequency domains. In this study, a number of new TFDs were examined and the Margenau-Hill-Spectrogram TFD (Boashash, 1992) was selected because of its high resolution in the time and frequency domains.
WAVELET TRANSFORM METHOD
Fourier spectral analysis is meaningful only for linear and stationary periodic phenomena and is not appropriate to process a non-stationary signal. In addition to the TFD method, the time-frequency character of wavelet transforms allows adaptation of both time and frequency domain approaches to examine nonlinear and non-stationary signals. The TFD method has a constant resolution in the time and frequency domains, but the wavelet method allows for the resolution in time and frequency to change based on specific requirements. Consequently, the wavelet method can be a more powerful tool than the TFD method in processing non-stationary signals such as earthquake records.
Wavelet analysis was developed by mathematicians and seismologists working on seismic signal analysis (Grossmann and Morlet, 1984; Daubechies, 1993). A number of articles have been published on earthquake signal processing using wavelet transforms, including detection of the arrival time of the primary wave (P) and secondary wave (S) (Oonincx, 1999), prediction of future earthquakes (Alperovich and Zheludev, 1998) and strong ground motion synthesis (Iyama and Kuwamura, 1999).
Modern wavelet theory emerged as a coherent and mature theory in the 1980s from the work of French exploration geophysicists (Grossmann and Morlet, 1984). It was motivated by the need for high resolution methods for analysis of seismic reflection signals. The wavelet transform is defined with a particular function, called a mother wavelet, which satisfies certain properties. The most important is the admissibility condition, which is required for an inverse wavelet transform to exist. It implies that the Fourier transform of the mother wavelet has no DC bias and therefore, must have oscillations to cause it to act as a bandpass filter.
According to modern wavelet theory, the wavelet transform is that which maps a function, x(τ), into a two dimensional domain (the time-scale plane) and is denoted by Wa, b(t):
(1) |
where, *denotes a complex conjugate dilation by scale a inversely proportional to frequency representing the periodic or harmonic nature of the signal; b is the translation parameter that localizes the wavelet basis function at time (t = b) and its vicinity. Both parameters a and b are dimensionless. The resulting wavelet coefficient represents a measure of the similitude between the dilated/shifted parent wavelet and the signal at time t and scale (frequency) a. The wavelet is dilated if a >1 and is contracted if a <1, therefore, a is the scaling parameter that captures the local frequency content. The normalizing constant ![]() is such that all wavelets have the same norm, usually set to unity:
is such that all wavelets have the same norm, usually set to unity:
(2) |
The wavelet function is defined as:
(3) |
So, Eq. 1 can be expressed as:
(4) |
 | |
| Fig. 1: | Wavelet transform |
| Table 1: | Masjed Soleiman embankment dam specifications |
 | |
By this approach, time-frequency localization is possible. To implement wavelet transform, signal x (τ) is first sampled at discrete points on the time axis and then a set of scaling parameters (a) is chosen to achieve an appropriate range of frequency resolution. The set of translation parameters (b) is usually taken at the same points where the original signal is sampled. After a and b are chosen, the basic wavelet is dilated or compressed by a to produce a family of wavelets ψa, b(t). The wavelets are multiplied by x (τ) at different a scales and different b translations (Fig. 1). The wavelet transform coefficients, Wa, b, are then obtained by summing the products, which indicates the correlation between the signal and ψa, b(t) As a result, at high frequencies good time resolution is achieved whereas, at low frequencies good frequency resolution is obtained.
Note that there is an inverse relationship between a and the frequency of the signal:
(5) |
In this equation, fa is the pseudo-frequency corresponding to a in Hz, as a function of the center frequency of wavelet fc (Abry, 1977). The center frequency of the wavelet is a characteristics of any given wavelet function. For example, the center frequency for the Morlet wavelet is 0.8125. The fs parameter in Eq. 5 is the sampling frequency of the original signal. The inverse of the pseudo-frequency is the pseudo-period for any given a.
MASJED SOLEIMAN DAM
The Masjed Soleiman rockfill dam is located on the Karun River in Khuzestan Province in Southwest Iran. It was built to generate 2000 MW of hydroelectric energy. As can be seen from Table 1, the dam has a maximum height of 177 m (Fig. 2) and a dam body volume of nearly 13.4x10⁶ m3. The dam was inaugurated in 2001 with one 250 MW power plant.
ANALYSIS OF EARTHQUAKE RECORDS
General Characteristics of the Records
Since 2002, four GeoSIG sa 99 SMACH accelerometers have been installed on the crest, dog-way and bottom gallery of Masjed Soleiman dam (Fig. 3). The earthquake signals were recorded in the upstream-downstream, longitudinal and vertical directions.
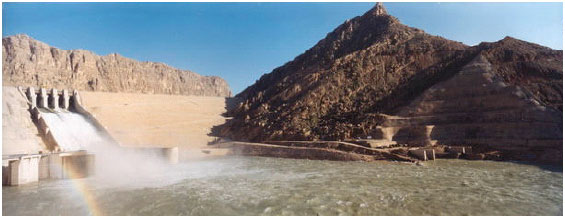 | |
| Fig. 2: | Masjed Soleiman embankment dam; view from downstream |
 | |
| Fig. 3: | Location of accelerometers on Masjed Soleiman dam body (gallery, dog-way and crest) |
| Table 2: | General characteristics of 6 Jan 2004 earthquake on Masjed Soleiman dam |
 | |
| U-D: Upstream-downstream, L: Longitudinal, V: Vertical | |
Three different events have been recorded on the dam body using a sampling frequency of 200 samples per second. The characteristics of the strongest recorded event are summarized in Table 2. The corresponding acceleration time histories and related Fast Fourier Transforms (FFT) of these records are shown in Fig. 4.
Figure 5 shows the variation of peak acceleration amplitude with the height of the dam. As can be seen, the amplification effect of the Masjed Soleiman dam body during the recorded earthquakes is distinguished from bottom to top in all three directions.
Classical Method
A MATLAB subroutine (Mathworks, 2002) was coded as follows:
| • | In the preprocessing step, file formats were converted to volt sec-1 and instrument corrections were applied |
| • | Base line correction and band pass filtering was done in the 0.6-30 Hz frequency range |
| • | The corrected signals were processed using the classical (4-spectra), TFD and wavelet methods |
 | |
| Fig. 4: | (a) Acceleration time histories and (b) FFT values for Masjed Soleiman embankment dam during 6 Jan, 2004 earthquake. From top to bottom: crest (L, U-D, V directions), dog-way (L, U-D, V directions) and gallery (L, U-D, V directions) |
 | |
| Fig. 5: | Amplification diagram in three directions for Masjed Soleiman embankment dam during 6 Jan, 2004 earthquake |
 | |
| Fig. 6: | Filtered time histories for gallery and dog-way, their PSD amplitudes, CPS, CS and CCPS in the longitudinal direction for Masjed Soleiman dam using the 4-spectra method |
First, the proposed dominant frequencies of dam body were extracted using classical signal processing methods. Since input signals in earthquake records are not exactly known, the PSD function, CPS and CS between two points of response measurement were used to obtain the dynamic properties of the embankment dam. A PSD peak at any response point either represents a resonance frequency associated with the mode of vibration of the dam system or corresponds to a peak in the excitation spectrum. To distinguish the spectral peaks representing dam vibration modes from those corresponding to peaks in the input spectrum, the amplitude and phase of CPS was used. That is, all points of the dam body in a lightly damped mode of vibration were either in phase or 180° out-of-phase with each other, depending on the shape of the normal mode. The phase relationships between two response measurement points are obtained from the Cross Correlation Phase Spectrum (CCPS).
The high capability of the 4-spectra method (using the PSD, CPS, CCPS and CS simultaneously) in the identification of different structural systems has been studied previously. The natural frequencies, mode shapes and modal damping values of two embankment dams were evaluated in forced vibration, ambient vibration and explosion tests Jafari and Davoodi, 2006), on one 7-story structure during an ambient vibration test (Davoodi et al., 2007a) and on a scale model of a 4-story structure during ambient vibration and impulse testing (Davoodi, unpublished data). Overall, the 4-spectra method seems to be a powerful, easy, rapid and straight forward tool to analyze stationary signals. For example, the processing results of the recorded earthquake signal in the longitudinal direction are presented in Fig. 6. As can be seen, by comparing the PSD, CPS, CS and CCPS of two points on the dam body (on the dam crest and at mid-elevation, in this case), the proposed dominant frequency of 1.45-1.65, can be clearly extracted.
The proposed modal frequencies of the dam body were extracted in all three directions based on the complementary results of the plots. Consequently, in the upstream-downstream direction, 1.3-1.5, 1.7-1.8, 2.6-2.8, 5.1-5.3 and 5.8-5.9 Hz frequencies were extracted. In the longitudinal direction, 1.45-1.65, 2.1-2.2 and 3.3-3.4 Hz frequencies were extracted. In the vertical direction, 1.9-2.1, 2.9-3.1, 3.8-3.9 and 5.7-5.9 Hz frequencies were obtained. A summary of the results is presented in Table 3.
TFD Method
As mentioned, non-stationary signals should be analyzed in both the time and frequency domains. Consequently, earthquake records were analyzed using the Margenau-Hill TFD method. An example of the processed earthquake records in the longitudinal direction of the dam crest is presented in Fig. 7. This Fig. 7 shows that the peak points from a 2D view are related to the proposed 1.7-1.8, 2.1-2.2, 3.3-3.4 and 4.6-4.8 Hz dominant frequencies. These dominant frequencies were extracted based on all the recorded signals on the dam body. Based on this figure and complementary ones, it can be distinguished that low frequencies are dominant in the week motion portion, whereas both low and high frequencies dominate in the strong motion portion. In the other words, as the strong motion portion of the signal passes, the dominant frequencies of the dam body decrease. By comparing the 2D plot and the energy spectral density, as is shown in the left part of this figure, it is evident that the dominant frequencies in the two plots are close to each other (horizontal red lines).
The vertical green lines show that the main shocks in the earthquake time history record can also be distinguished in the 2D plot. These shocks can be seen as peak points in the frequency domain in each time. Also, these peaks clearly show the excited dominant frequencies in each shock. Consequently, it can be said that, in each strong motion, special dominant frequencies are excited that may be different from one another. In the other words, in an earthquake record, the dominant frequencies in the weak motion, strong motion and coda portions may be different. For example, the 3.3-3.4 Hz frequency is clearly excited in the strong motion portion, whereas this frequency is difficult to distinguish in the coda portion. It is obvious that these results can be distinguished based on the 2D plot of the TFD of non-stationary earthquake records. A summary of the results obtained in all three directions are shown in Table 3.
Wavelet Method
In the TFD method, the resolution is constant in both the low and high frequencies. In the wavelet method, the resolutions in time and frequency are not constant in the low and high frequencies and can be changed based on specific requirements. Consequently, the wavelet transform can be a powerful tool in processing non-stationary earthquake signals.
| Table 3: | Modal frequencies of Masjed Soleiman embankment dam based on different signal processing methods |
 | |
| *Results of previous study on Masjed Soleiman dam body based on ambient, explosion, forced vibration tests and numerical modeling (Jafari and Davoodi, 2006) | |
 | |
| Fig. 7: | Recorded acceleration time history of Masjed Soleiman dam crest in longitudinal direction (top); its corresponding PSD (left); and related TFD contour plot (right) |
In this research, the earthquake records were analyzed using a continuous Morlet wavelet transform to describe the signal energy in the time-scale domain. The Morlet was selected as the proper wavelet to analyze earthquake records after an examination of a number of wavelet transforms.
Figure 8 shows the scalogram of the recorded signal on the dam crest in the longitudinal direction. As can be seen, the variation of frequency content in a non-stationary signal such as an earthquake record can be distinguished in the time domain. Figure 8 also shows separately which dominant frequencies are excited in each portion of the record. It is obvious that these variations in both the time and frequency domains are related to the non-stationary properties of the signal. The brighter spots and peak points in this three dimensional figure indicate the higher absolute values of the wavelet coefficients that were used to extract the dominant frequencies of the dam body.
 | |
| Fig. 8: | Three-dimensional surface plot of wavelet coefficients for earthquake signals recorded on dam crest in the longitudinal direction |
Based on complementary studies, the wavelet method was selected to analyze all the earthquake records on the dam body. The dominant frequencies of the dam body are related to the peaks in the TFD, as seen in Fig. 7. The 1.45-1.55, 1.7-1.8, 2.5-2.6 and 2.9-3.0 Hz frequencies in the upstream-downstream direction, 1.7-1.8, 2.1-2.2, 3.0-3.2 and 3.6-3.7 Hz frequencies in the longitudinal direction and 2.0-2.2, 2.7-3.0, 3.9-4.1 and 6.0-6.2 Hz frequencies in the vertical direction were obtained as dominant frequencies of the dam body.
RESULTS AND DISCUSSION
The extracted dominant frequencies of the dam body based on the analysis of the recorded earthquake signals by the 4-spectra, wavelet and TFD methods are summarized in Table 3. In order to compare these results with the results of earlier study, the modal frequencies of the earlier results are also recorded. The earlier results were based on ambient vibration, forced vibration and explosion tests as well as numerical analysis. All the recorded signals were analyzed by the 4-spectra method.
As can be seen, some dominant frequencies that were hidden in the classical methods were extracted by the TFD and wavelet methods, such as the 3.6-3.7 and 4.6-4.8 Hz frequencies in the longitudinal direction. The similar results can also be distinguished in the upstream-downstream and vertical directions. The 2.5-2.6, 3.2-3.4, 3.8-4.0 and 4.7-4.8 Hz frequencies are extracted in the upstream-downstream direction and the 4-4.3, 4.7-4.8, 5.2-5.3 and 6.8-7.1 Hz frequencies are extracted in the vertical direction. Overall, the analysis indicates that the modern signal processing methods that can process a non-stationary signal in both the time and frequency domains are powerful tools for analyzing earthquake records.
Detailed comparisons of the results of earthquake records and other in-situ tests reveals that the extracted dominant frequencies obtained by earthquake signals are up to 5% smaller than the results of other tests (including ambient, forced vibration and explosion tests). The difference can relate to decreasing stiffness of the soil material during earthquake excitation. It should be noted that the analyzed earthquake records were extremely weak motions. Consequently, this difference in natural frequencies is expected to increase to 10% for strong earthquakes.
CONCLUSION
Classical signal processing methods such as FFT, PSD and CPS are powerful, easy and straight forward tools to process stationary signals, but these methods have some limitations to processing non-stationary earthquakes and explosions. To overcome their limitation of analyzing a signal only in the frequency domain, modern processing methods were developed. The TFD method analyzes signals in both the time and frequency domains, but the resolutions in these domains are constant. The wavelet method is another alternative having the flexibility of separately varying resolutions in the time and frequency domains. The time-frequency character of wavelet transforms and TFDs allow adoption of both traditional time and frequency domain system identification approaches.
In this study, three methods for analyzing the earthquake records from Masjed Soleiman embankment dam were performed. First, in the classical 4-spectra method (incorporating PSD, CPS, CS and CCPS), the natural frequencies of the dam body were obtained. Next, for the first time, time-frequency signal analysis of earthquake records using the TFD method and wavelet decomposition were used to identify the dominant frequencies of the dam.
The results show that some dominant frequencies hidden in the classical methods are extracted in the TFD and wavelet methods in the upstream-downstream, longitudinal and vertical directions. In addition, the spectral variations of the scalograms indicate that lower frequency contents become more dominant as the excitation amplitude decreases. The lower mode shapes of the dam body are excited during the weak part of an earthquake, whereas during the stronger part, all the high and low modes are excited. Complementary studies on strong earthquake records would be of benefit in obtaining more detailed results. Totally, the results of this research suggest that modern signal processing methods are powerful tools in the thorough analysis of non-stationary earthquake signals.
ACKNOWLEDGMENT
The authors are grateful to the Iranian Water and Power Company, which owns Masjed Soleiman dam and to Mr. Ahmadzadeh and his co-workers for their excellent cooperation.
REFERENCES
- Abdel-Ghaffar, A.M. and A.S. Koh, 2006. Longitudinal vibration of non-homogeneous earth dams. Earthquake Eng. Struct. Dyn., 9: 279-305.
CrossRef - Akkose, M., A. Suleyman, A. Bayraktar and A.A. Dumanoglu, 2007. Stochastic seismic response of Keban dam by the finite element method. Applied Math. Comput., 184: 704-714.
CrossRef - Allen, J.B., 1977. Short-time spectral analysis, synthesis and modifications by discrete fourier transform. IEEE. Trans. Acoust. Spech Signal Proc., 25: 235-238.
Direct Link - Alperovich, L. and V. Zheludev, 1998. Wavelet transform as a tool for detection of geomagnetic precursors of earthquakes. Phys. Chem. Earth, 23: 965-967.
CrossRef - Boltezar, M. and J. Slavic, 2004. Enhancements to the continuous wavelet transform for damping identifications on short signals. Mech. Syst. Signal Processing, 18: 1065-1076.
CrossRef - Celebi, M., 2003. Identification of site frequencies from building records. Earthquake Spectra, 19: 1-23.
CrossRef - Chakraborty, A., B. Basu and M. Mitra, 2006. Identification of modal parameters of a MDOF system by modified L-P wavelet packets. J. Sound Vibrat., 295: 827-837.
CrossRef - Daubechies, I., 1993. Orthonormal bases of compactly supported wavelets II. Variations on a theme. SIAM J. Math. Anal., 24: 499-519.
CrossRefDirect Link - Davoodi, M., M.A. Sakhi and M.K. Bakavoli, 2007. Using advanced signal processing techniques on ambient vibration records of a structure. Proceedings of the International Symposium on Advances in Earthquake and Structural Engineering, October 24-26, 2007, Suleyman Demirel University, Isparta-Antalya, Turkey, pp: 235-244.
Direct Link - Davoodi, M., M.K. Jafari and M.A. Sakhi, 2007. Using TFD signal processing to evaluate dynamic characteristics of masjed soleiman embankment dam by blasting tests. Proceedings of the 5th International Conference on Seismology and Earthquake Engineering, May 13-16, 2007, Tehran, Iran, pp: 1-3.
Direct Link - Gazetas, G., 1981. Longitudinal vibration of embankment dams. ASCE. J. Geotech. Eng. Div., 107: 21-40.
Direct Link - Gazetas, G., 1981. Vertical oscillation of earth and rockfill dams: Analysis and field observation. Soils Foundat., 21: 56-68.
Direct Link - Ghanem, R. and F. Romeo, 2000. A wavelet-based approach for the identification of linear time-varying dynamical systems. J. Sound Vibrat., 234: 555-576.
CrossRef - Ghanaat, Y. and H.Q. Chen, 1999. Measurement of dynamic response of arch dams including interaction effects. Proceedings of the 12th World Conference on Earthquake Engineering, January 30-February, 1999, Auckland, New Zealand, pp: 1-9.
Direct Link - Grossmann, A. and J. Morlet, 1984. Decomposition of hardy functions into square integrable wavelets of constant shape. SIAM. J. Math. Anal., 15: 723-736.
CrossRef - Gurley, K. and A. Kareem, 1999. Application of wavelet transforms in earthquake, wind and ocean engineering. Eng. Struct., 21: 149-167.
Direct Link - Hans, S., E. Ibraim, S. Pernot, C. Boutin and C.H. Lamarque, 2000. Damping identification in multi-degree-of-freedom systems via a wavelet-logarithmic decrement-part 2: Study of a civil engineering. J. Sound Vibrat., 235: 375-403.
Direct Link - Haigh, S.K., B. Teymur, S.P.G. Madabhushi and D.E. Newland, 2002. Applications of wavelet analysis to the investigation of the dynamic behavior of geotechnical structures. Soil Dynam. Earthquake Eng., 22: 995-1005.
CrossRef - Iyama, J. and H. Kuwamura, 1999. Application of wavelets to analysis and simulation of earthquake motions. Earthquake Eng. Struct. Dyn., 28: 255-272.
Direct Link - Jafari, M.K. and M. Davoodi, 2006. Dynamic characteristics evaluation of masjed soleiman dam using in situ dynamic tests. Can. Geotechnical. J., 43: 997-1014.
CrossRef - Kijewski, T. and A. Kareem, 2003. Wavelet transform for system identification in civil engineering. Comput. Aided Civil Infrastructure Eng., 18: 339-355.
Direct Link - Montejo, L.A. and L.E. Suarez, 2006. Wavelet-based identification of site frequencies from earthquake records. J. Earthquake Eng., 10: 565-594.
CrossRefDirect Link - Ndambi, J.M., B. Peeters, J.D. Visscher, M.A. Vahab and J. Vantomme et al., 2000. Comparision of techniques for modal analysis of concrete structures. Eng. Struct., 22: 1159-1166.
CrossRef - Neild, S.A., P.D. McFadden and M.S. Williams, 2003. A review of time-frequency methods for structural vibration analysis. Eng. Struct., 25: 713-728.
CrossRefDirect Link - Oonincx, P.J., 1999. A wavelet method for detecting S waves in seismic data. Comput. Geosci., 3: 111-134.
CrossRefDirect Link - Ovanesova, A. and L.E. Suarez, 2004. Application of wavelet transforms to damage detection in frame structures. Eng. Struct., 26: 39-44.
CrossRef - Ozkan, Y. and M. Erdic, 1990. Damage at surgu dam during May 5, 1986, Malatya, Turkey Earthquake. Earthquake Spectra, 6: 779-796.
CrossRef - Suarez, L.E. and L.A. Montejo, 2005. Generation of artificial earthquakes via the wavelet transform. Int. J. Solids Struct., 42: 5905-5919.
CrossRef - Wang, Y. and Y. Jiang, 2008. Generalized time-frequency distributions for multicomponent polynomial phase signals. Signal Processing, 88: 984-1001.
CrossRef - Yan, B.F., A. Miyamoto and S. Goto, 2004. A comparison of wavelet transform and hilbert-huang transform for modal parameter extraction of structure. J. Applied Mech. JSCE., 7: 1167-1178.
Direct Link - Yan, B.F., A. Miyamoto and E. Bruhwiler, 2006. Wavelet transform-based modal parameter identification considering uncertainty. J. Sound Vibrat., 291: 285-301.
CrossRef - Zhao, Y., L.E. Atlas and R.J. Marks, 1990. The use of cone shaped kernels for generalized time-frequency representations of nonstationary signals. IEEE. Trans. Acoust. Speech Signal. Process, 38: 1084-1091.
Direct Link - Zhou, Z. and H. Adeli, 2003. Time-frequency signal analysis of earthquake records using mexican hat wavelets. Comput. Aided Civil Infrastructure Eng., 18: 379-389.
Direct Link